ScRNA-seq reveals dynamic macrophage heterogeneity in chronic liver disease progression and prognostic biomarkers KLF2/SPP1 in HCC
Qi Pan, Xinru Wang, Borui Li, Zhenzhen Cai, Shuwen Chen, Jiahong Hu, Xuenan Yuan, Jie Yang, An-Yuan Guo, Zhihong Zhang

TL;DR
This study uses single-cell RNA sequencing to track changes in liver immune cells during chronic liver disease progression and identifies KLF2 and SPP1 as potential biomarkers for liver cancer prognosis.
Contribution
The study introduces a stage-resolved cellular atlas of chronic liver diseases and identifies SPP1 and KLF2 as novel prognostic biomarkers for hepatocellular carcinoma.
Findings
CXCL3+ and CXCL10+ macrophages are enriched in MASH and linked to inflammatory programs driving progression to HCC.
SPP1+ macrophages are exclusive to HCC and associated with T-cell dysfunction but not direct suppression.
KLF2 and SPP1 are validated as prognostic biomarkers for HCC using clinical datasets and RNA FISH.
Abstract
Metabolic dysfunction-associated steatohepatitis (MASH)-induced chronic liver diseases (CLDs) were worldwide prevalence and incidence. The stage-resolved cellular and molecular programs remained incompletely defined. This study aimed to resolve stage-specific immune and transcriptional features across CLDs processes and to identify prognostic biomarkers. We integrated single-cell RNA sequencing datasets from healthy liver, MASH, cirrhosis and HCC to construct a stage-resolved cellular atlas. We performed cell-state scoring, diffusion pseudotime, gene regulatory network inference, and cell–cell interaction to decipher various macrophages and T cells transcriptional profiles. We established a method of gene sets enrichment score to detect prognostic markers and employed RNA fluorescence in situ hybridization (FISH) to validate macrophage subtype abundances and spatial interactions. The…
Genes, proteins, chemicals, diseases, species, mutations and cell lines named across the full text — each resolved to its canonical identifier and authoritative record.
Click any figure to enlarge with its caption.
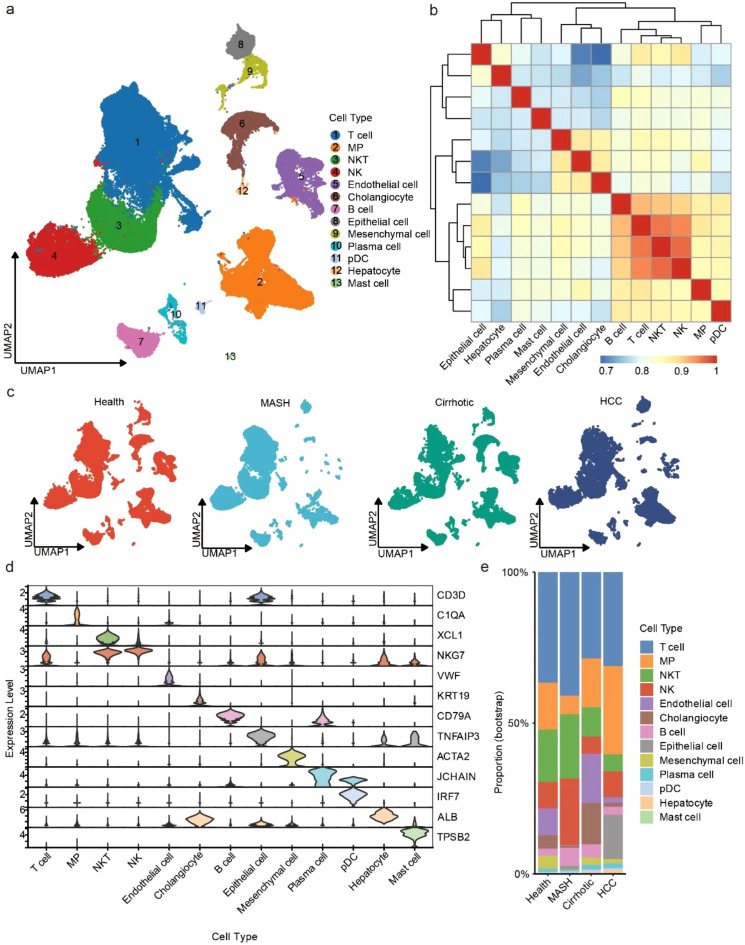 Figure 1
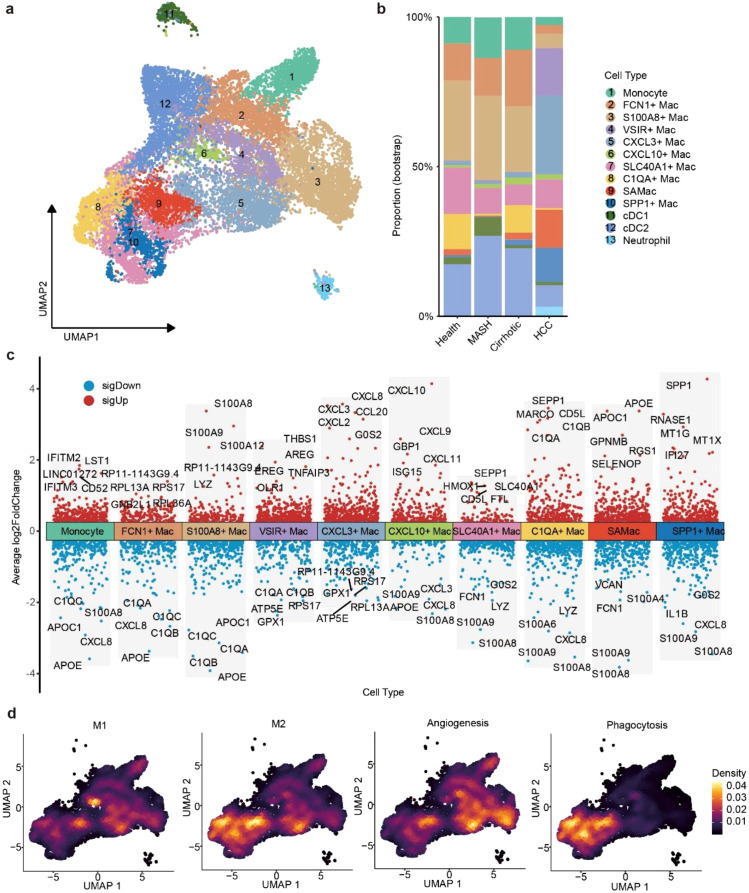 Figure 2
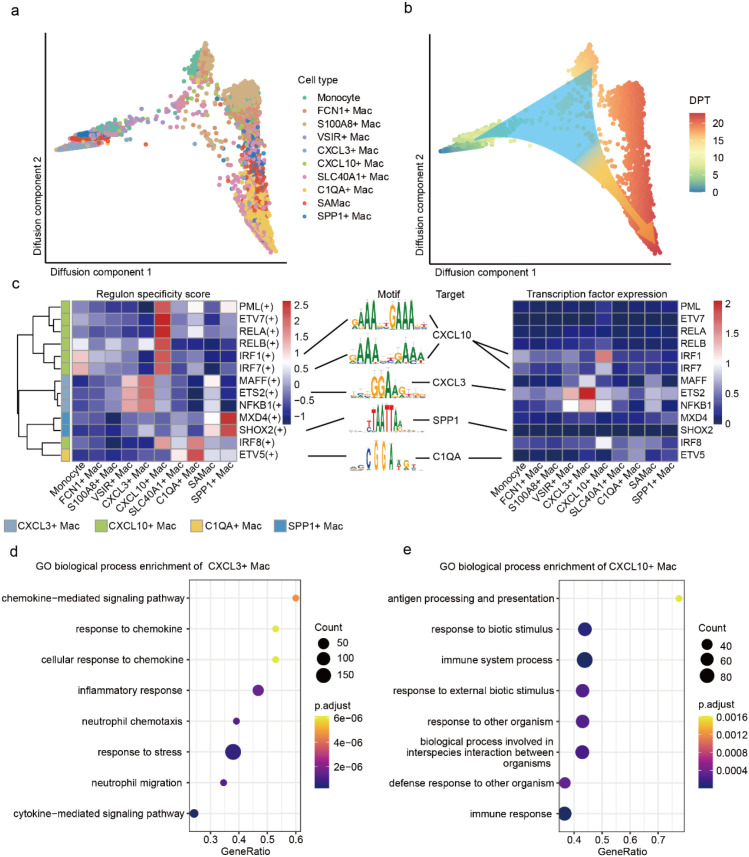 Figure 3
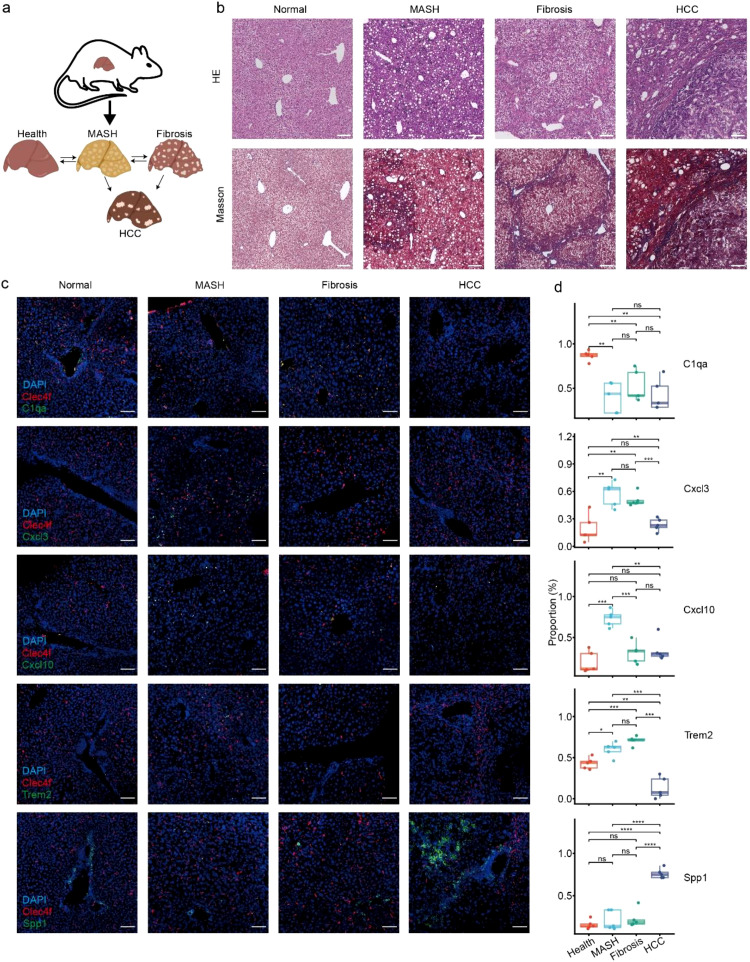 Figure 4
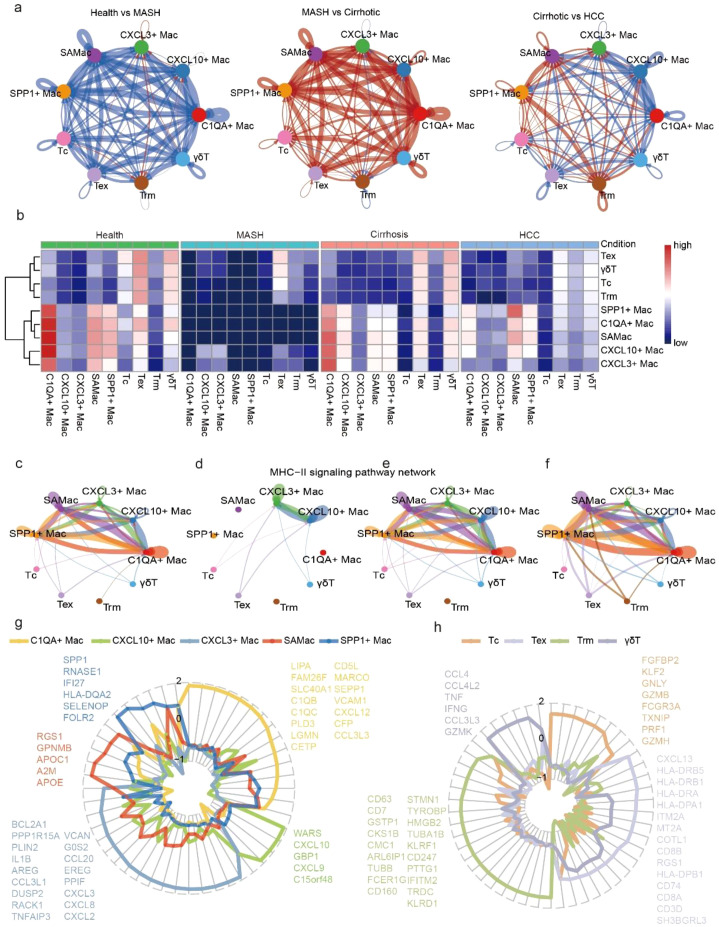 Figure 5
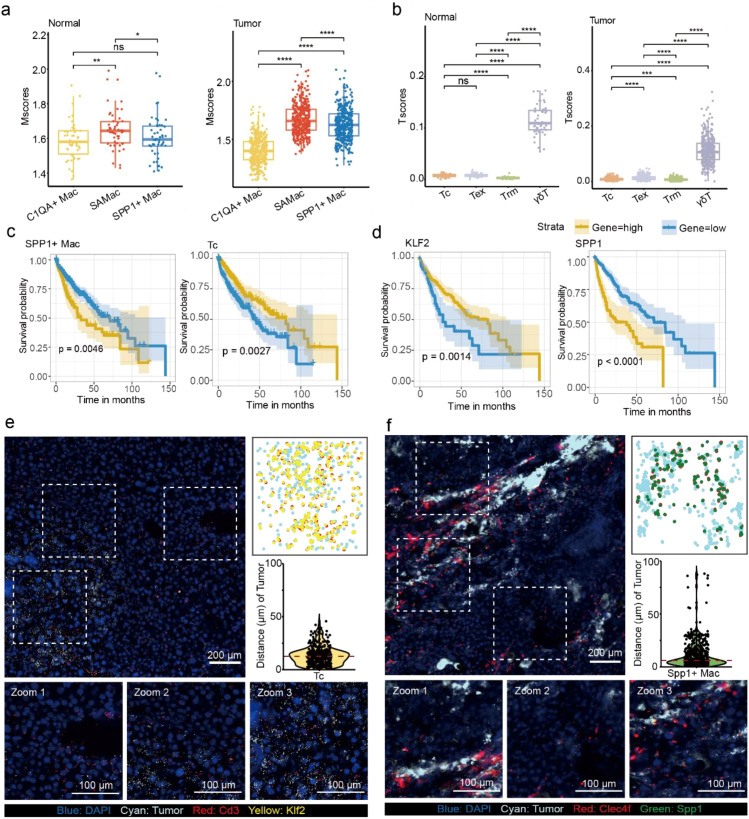 Figure 6
Peer Reviews
No public reviews on file for this paper yet. If you reviewed it on a platform where reviews are public (OpenReview, ICLR, NeurIPS, ICML), you can paste yours below so the community can read it here.
Videos
No videos yet. Explain this paper in a talk, walkthrough, or lecture? Add one.
Taxonomy
TopicsLiver Disease Diagnosis and Treatment · Kruppel-like factors research · Liver Diseases and Immunity
Introduction
1
Chronic liver diseases (CLDs) presented a significant global health burden, with a mortality rate of two million deaths per year (1). CLD was also a continuous and progressive deterioration of liver functions (2). The distribution of CLDs was changing, metabolic dysfunction–associated steatohepatitis (MASH) has become the most prevalent cause of CLD, and its global incidence and prevalence were steadily rising within the next decade significantly (3). Cirrhosis was a leading cause of death among patients of CLD worldwide, frequently progressed to hepatocellular carcinoma (HCC) (4). Although the rapidly evolving single-cell RNA sequencing (scRNA-seq) technologies have provided valuable insight into the pathogenesis of liver diseases (5, 6), comprehensive analysis of diverse cellular populations and phenotypic states during the transition from MASH to advanced liver disease and HCC remained limited. Hence, a deep understanding of the stage-specific immune landscapes and transcriptional programs of CLDs was urgently needed to improve the rational design of immunotherapies.
The immune system played a critical role in CLDs (7). It has been reported that both innate and adaptive immune cells shaped the hepatic microenvironment during the progression from MASH to fibrosis, cirrhosis, and HCC (8). Macrophages (Macs) represent a first-line defense in the liver, they showed impaired turnover in MASH and could be driven toward pro-inflammatory activation by the excess lipids and tissue damage in the fatty liver (9). The scar-associated macrophages (SAMacs), displaying a pro-fibrogenic phenotype, have been identified expand in liver cirrhosis (5). Tumor-associated macrophages (TAMs) exhibited distinct transcriptional states and were associated with poor prognosis in HCC (10). However, the cellular and molecular mechanisms involved in CLDs pathogenesis remain largely unknown.
Here, we integrated 29 samples of scRNA-seq data from healthy liver, MASH, cirrhosis and HCC to identify stage-specific macrophage and T cell subpopulations across chronic liver disease processes. We clarified the molecular dynamics of C1QA^+^ Mac, CXCL3^+^ Mac, CXCL10^+^ Mac, SAMac and SPP1^+^ Mac along CLDs processes, and discovered the transcription factor ETS2 (ETS proto-oncogene 2) and IRF1 (interferon regulatory factor 1) as key regulators in macrophages, potentially driving the transitions of MASH to HCC. Moreover, we revealed SPP1^+^ macrophages established anergic interactions with cytotoxic T cell (Tc), with SPP1 serving as a poor prognostic biomarker, whereas KLF2 (KLF transcription factor 2) exhibited an anti-tumor phenotype in HCC.
Materials and methods
2
Data collection
2.1
ScRNA-seq data were collected from Gene Expression Omnibus (GEO; https://www.ncbi.nlm.nih.gov/geo/) database and Mendeley Data (https://data.mendeley.com/). The inclusion criteria for scRNA-seq datasets were as follows: (1) liver tissue samples with clearly annotated disease status relevant to MASH, liver cirrhosis, or HCC; (2) the availability of raw or processed gene expression matrices and corresponding cell-type annotations; (3) the scRNA-seq analysis results have been confirmed by FISH, flow cytometry, immunostaining, or experimental studies in original article. We selected 5 cases of healthy controls and 5 cases of liver cirrhotic patients from GSE136103, (5) 3 cases of MASH patients from GSE159977. (6) Because the annual incidence of hepatocellular carcinoma arising from NASH-related cirrhosis was relatively low, we were unable to collect the dataset. Viral hepatitis-induced and NASH-induced HCC have been reported to share overlapping inflammatory and immune signaling pathways that drive malignant transformation (11). Therefore, we collected 6 cases of HBV-related cirrhosis with HCC from skrx2fz79n (12) as a surrogate. The data accession numbers and information were provided in Supplementary Table 1. Additionally, the RNA expression data and clinical information of HCC used in this study were obtained from The Cancer Genome Atlas public access web portal (TCGA-LIHC; https://portal.gdc.cancer.gov/).
Single-cell RNA-seq data analysis
2.2
Cases from GSE136103 and GSE159977 were obtained raw fastq files. They were processed with the Cell Ranger pipeline (version 6.0.2, 10X Genomics) and mapped to GRCh38 reference genome to generate count matrices. The count matrix of skrx2fz79n dataset was obtained from rds files (https://data.mendeley.com/datasets/skrx2fz79n/1). We used the “emptyDrops” function of the R package DropletUtils (version 1.14.2) (13) to remove barcode-swapped pseudo-cells. We applied “doubletFinder_v3” function of R package DoubletFinder (version 2.0.3) (14) to identify doublets. For quality control, cells with mitochondrial gene percentages less than 10%, genes expressed in over 3 cells, and detected genes between 200 to 4000 were kept. The R package Seurat (version 4.2.1) (15) was utilized to perform data normalization and dimensionality reduction. Gene expression counts were normalized and scaled by “SCTransform” function with glmGamPoi model, and we calculated a PCA matrix by “RunPCA” function. After PCA, we used the “RunHarmony” function with SCT assay for batch effect correction and datasets integration in the R package harmony (version 0.1.0) (16).
Unsupervised clustering and cell-type annotation
2.3
The top 40 harmony dimensions were used to carry out the uniform manifold approximation and projection (UMAP) dimensional reduction. We then constructed the nearest-neighbour graph by the “FindNeighbors” function with the reduction as ‘harmony’. The “FindClusters” function was then used to identify clusters with the resolution parameter of 0.09 of the whole object, which resulted in 15 clusters; the resolution of 0.3 for T cells and 0.4 for mononuclear phagocytes. To identify cluster-specific marker genes, we used “FindAllMarkers” function to select those detect in a minimum of 25% of cells within the cluster, displaying a p value < 0.05 in the Wilcoxon rank-sum test, and demonstrating a differential expression threshold of 0.25 log fold change (log2FC). The main cell types were annotated with known cell-type marker genes based on CellTypist (https://www.celltypist.org/) (17) and CellMarker 2.0 (http://117.50.127.228/CellMarker/) (18). We applied type-specific markers to annotate mononuclear phagocyte and T cell subtypes.
Trajectory inference and cell-cell communication
2.4
Trajectory and diffusion-pseudotime (DPT) analysis were generated using the R package destiny (version 3.22.0) (19). The number of nearest neighbors, k, was set to 10. The principal components were set to 30. The R package CellChat (version 1.6.1) (20) was utilized to explore the communication of macrophages and T cells into functionally relevant signaling pathways. We used the processed expression matrices from the “SCT” data slot of the Seurat object with corresponding annotations to create a CellChat object. CellChatDB.human was set as the ligand-receptor interaction database. We applied the minimum cell count criterion of 10.
Macrophage and T cell states
2.5
We used the R package AUCell (21) to calculate the signature score of curated gene sets relate to macrophage and T cell functional states (22, 23) (Supplementary Tables 2, 3). AUCell could provide a relative measure of gene importance in each cell to evaluate the degree of gene set enrichment. The ranked gene expression matrix was built by the AUCell_buildRankings function, and then we calculated the AUC value using the AUCell_calcAUC function.
Functional enrichment analysis and SCENIC analysis
2.6
We performed GO enrichment analysis with the R package clusterProfiler (version 4.2.2) (24). The top 8 GO annotations were chosen for C1QA^+^ Mac and SPP1^+^ Mac for visualization. Enrichment scores for the eight selected GO annotations were calculated by a hypergeometric statistical test with a significance threshold of 0.01.
SCENIC (21) was a tool that utilizes scRNA-seq data to reconstruct gene regulatory networks. We used the pySCENIC (version 0.12.1) package in Python (version 3.10) to assess transcription factor enrichment and regulator activity of monocyte and nine macrophage subtypes. The grn function was used to infer gene co-expression relationships between transcription factors and their potential target. Then, ctx function was used to refine the regulons and separate direct and indirect target. Finally, the regulon activity was calculated by aucell function. The R package ComplexHeatmap (25) was used to visualize the regulon activity.
Signature genes
2.7
Based on cluster-specific marker genes, we identified the signature genes from FindAllMarkers function of Seurat (15). For macrophages, genes with adjusted p value < 0.01 by Wilcoxon rank-sum test, in a minimum of 50% of cells within the cluster and in a maximum of 50% of cells within the others cluster (pct.1 > 0.5 and pct.2 < 0.5), and demonstrating a differential expression threshold of 1 log fold change (avg_log2FC > 1) were defined as macrophage subtypes specific signature genes. For T cells, genes with adjusted p value < 0.01 by Wilcoxon rank-sum test, and demonstrating a differential expression threshold of 0.5 log fold change (avg_log2FC > 0.5) were defined as T cell subtypes specific signature genes. Then, we manually checked the cell subtypes specific signature genes. We removed ALB and ATP5F1E to confirm the signature genes were specific to cell subtypes. Furthermore, we performed SelectGene function of R package (26) (version 1.0) to calculate total entropy difference. The genes with greater total entropy difference tend to be more specific and would be retained as cell subtypes specific signature genes.
Survival analysis and prognostic gene selection
2.8
We collected 424 samples from the TCGA-LIHC cohort, including 50 normal liver samples and 374 HCC samples. Clinical information and gene expression matrix were retrieved using the R package TCGAbiolinks. The clinical information was retrieved using the GDCquery_clinic function. Bulk RNA-seq data were obtained using the GDCquery function with project set to “TCGA-LIHC”, data_category set to “Transcriptome Profiling”, data_type set to “Gene Expression Quantification”, and workflow_type set to “STAR–Counts. The TCGA-LIHC data was used to evaluate the prognostic performance of signature gene sets derived from macrophage and T cell subtypes clusters. We performed survival analysis using the Cox proportional hazards model implemented in the R package survival (version 3.3-1). And the ggsurvplot function was employed to correct patient age and plot Kaplan–Meier survival curves. Least absolute shrinkage and selection operator (LASSO) Cox regression analysis was applied to construct the prognostic model of the signature genes of SPP1^+^ Mac and Tc. Univariate Cox proportional hazards regression analysis was performed on the signature genes of SPP1^+^ Mac and Tc to screen genes significantly associated with OS in HCC (27).
Gene set enrichment score calculation
2.9
We employed ImmuCellAI (28) to calculate immune cell enrichment score (IS) of each sample to correct the bias of immune cell abundance. Hepatocytes can impair the function of T cell (29), so we calculated the enrichment score of Tc (CA) to assign the deviation. Next, we used the expression of signature gene set as input of ssGSEA to obtain the enrichment score (ES) of SPP1^+^ Mac and Tc. Finally, the gene set enrichment score are as follows:
Gene set enrichment score of SPP1^+^ Mac (Mscore):
Gene set enrichment score of Tc (Tscore):
Mice
2.10
Experiments were conducted on 7–8 weeks old C57BL/6J male mice. Mice were purchased from the Hunan SJA Laboratory Animal Co., Ltd (Changsha, Hunan, China) and were bred in a specific pathogen‐free barrier facility at the Animal Center of Wuhan National Laboratory for Optoelectronics. 5 healthy mice as control. For Diet-induced MASH mice models, 5 mice were fed with MCD diet for up to 3 weeks. Liver fibrosis models were induced in 5 mice through an intraperitoneal injection of 25% CCL_4_ in corn oil (Sinopharm Chemical Reagent Co., Ltd., China) twice a week for 6 weeks. 5 HCC mice models generated by hydrodynamic tail vein injection of plasmids carrying the Akt and N-ras genes were established over six weeks and purchased from Shouzheng Pharma (Wuhan) Biotechnology Co., Ltd. Finally, all mice were anesthetized and transcardially perfused with RNase-free PBS. Liver samples of mice were immediately collected and subjected to further experiments.
Histology and FISH
2.11
H&E staining and Masson’s trichrome staining were used to evaluate and examine the histopathologic changes in liver structure. The sections were imaged with PanoBrain (Tinyphoton, Hubei, China). For each specimen, 5 fields per tissue section were randomly chosen and quantified by ImageJ software (National Institutes of Health, USA).
For FISH, the livers were maintained and fixed with 4% paraformaldehyde (PFA) for 6 hours, then incubated with 30% sucrose with 4% PFA. The liver lobes were immersed in optimal cutting temperature (OCT) tissue blocks, and stored at -80 °C. Cryosections 30 μm thick were used for in situ amplification and hybridization. Padlock probes and primers were designed as target sequence of genes (C1qa, Cd3, Clec4f, Cxcl3, Cxcl10, Klf2, Trem2, Spp1, Akt and Nras). In brief, the sections were incubated with buffer (2×SSC, 35% formamide, 1% TritonX-100 in RNase-free PBS) contain probes overnight at 37 °C. Then, 5.7 U/μl T4 DNA ligase (TaKaRa, Japan) was added to ligate padlock probes at room temperature for 4 hours. After ligation, the sections were incubated with rolling circle amplification mixture (250 μM dNTP, 4 μM Dithiothreitol, 0.4 U/μl Recombinant RNase Inhibitor in ddH_2_O) by Phi29 DNA polymerase (New England Biolabs, America) at 30°C for 2 hours. The sections were then incubated with monomer buffer (4% acrylamide, 0.2% bis-acrylamide, 0.1% ammonium persulfate, 0.2% tetramethylethylenediamine) at room temperature for 2 hours. Next, the sections were digested with Proteinase K (Biofrox, Germany) overnight in 37 °C. Finally, the sections were incubated with fluorescent oligo (Alexa Fluor 488, TAMRA, Alexa Fluor 647) complementary to DNA amplicon at 37 °C for 30 minutes. The sections were imaged on Olympus FLUOVIEW FV3000 confocal laser scanning microscopes for gene expression validations or cell subtypes analysis. The detailed probe information was listed on Supplementary Table 4.
Distance quantification of FISH data
2.12
The quantification of spatial distance was computed using cv2 python module. We used DAPI to stain the cell nucleus as the center point of the cell. We defined macrophages based on the fluorescent points of cell marker within the diameter of 20 μm, T cells were 10 μm. The FISH images were converted to the HSV color space, and which binary masks of valid regions were generated by applying specific thresholds. Next, the connected component analysis was performed on the masks to filter out small connected components and eliminate noise. The effective contours of fluorescent cells were extracted, and the distribution of their center points was calculated and visualized. For SPP1^+^ Mac and Tc, the shortest distance to a tumor cell was extracted from the pairwise cell-cell distance matrix of all cell distances, which defined as the distance to the closest tumor cell.
Results
3
A comprehensive cellular landscape of CLDs explored by integrated scRNA-seq data
3.1
To uncovered the single-cell landscape during different processes of CLDs, we applied scRNA-seq data to characterize the dynamics from health liver, MASH, liver cirrhosis and HCC. In total, 99, 593 high-quality cells from 29 samples of 19 patients were analyzed after quality control in our study (Supplementary Table 1). After performing quality control, sctransform normalization, dimensionality reduction, batch effect removal, and clustering, the 13 distinct main cell types were annotated by CellTypist (17) and cell marker genes from CellMarker (30) (Figure 1a). We computed the spearman correlation of the main cell, and we observed a distinct correlation between adaptive immune cells (NKT and T cell) and innate immune cells (MP) and wanted to explore this further (Figure 1b). Each dataset with no obvious batch effects after batch correction (Supplementary Figure 1a). All cells with the number of genes per cell between 200 and 4000, and the proportion of mitochondrial gene counts less than 10% were selected (Supplementary Figure 1b). Of note, MP, T cell and NKT proportion were obviously dominant and distinct across different processes of CLDs, suggesting they might play a role in the immune microenvironment (Figure 1c). T cell expressed the T-cell receptor (TCR) signaling mediators CD3D (31), Mononuclear phagocyte (MP) was identified by the expression of C1QA, Natural killer T cell (NKT) was marked by XCL1 (32), Natural killer cell (NK) was identified by natural killer cell granule protein 7 (NKG7) (33), Endothelial cell was marked by known liver endothelial cell marker VWF (34), Cholangiocyte marker gene was KRT19 (35), B cell was identified by the canonical marker gene CD79A, Epithelial cell was defined by TNFAIP3 (36), Mesenchymal cell was marked by ACTA2 (37), Plasma cell was identified by the expression of JCHAIN (17), Plasmacytoid dendritic cell (pDC) was marked by IRF7 (38), Hepatocyte was defined by their classical marker ALB, Mast cell was positive for expression TPSB2 (39) (Figure 1d, Supplementary Figure 1c). To characterize the heterogeneous cellular compositions among the four processes of CLDs, we calculated the proportion of cell types by a bias-corrected and accelerated (BCa) bootstrap algorithm (40). Interestingly, we observed MPs and T cells (including T cells and NKT cells) proportion were distinct across different processes, which suggesting the progression heterogeneity of CLDs (Figure 1e). This indicated the complexity immune-specific microenvironment of CLDs (41). Hence, we proceeded to further annotated MPs and T cell subtypes with manual marker-based annotation method for in-depth analysis.
Single-cell RNA-seq landscape of major cell types at different processes of CLDs. (a) UMAP plot showing cell clusters in the progression of the chronic liver disease. MP, Mononuclear phagocyte; NK, natural killer T cell; NK, natural killer cell; pDC, plasmacytoid dendritic cell. (b) Spearman correlation of transcriptomic profiles of different cell populations. (c) UMAP plot colored by different progression of chronic liver diseases. (d) Violin plots showing the expressed marker genes of main cell types. (e) Histogram showing the proportion of main cell types in different progression of chronic liver diseases.
Intrahepatic macrophages and T cells subtypes exhibited distinct features during the progression of CLDs
3.2
To pinpoint the transcriptional diversity in four processes of CLDs, we performed unsupervised clustering analyses of MPs. In addition to conventional dendritic cells (cDC1 and cDC2) and neutrophils, we annotated 10 other myeloid cell subtypes, including monocytes and 9 macrophage subtypes (Figure 2a). We found C1QA^+^ Mac highly enriched in healthy liver. SAMac and SPP1^+^ Mac was predominant in liver cirrhosis and HCC (Figure 2b). CXCL3^+^ Mac and CXCL10^+^ Mac highly expressed the genes of CXCL subfamily. CXCL3^+^ Mac exhibited the highest expression of CXCL8, CXCL3, CXCL2 and CCL20, which implied CXCL3^+^ Mac might be associated with liver disease progression and survival time (42, 43). CXCL10^+^ Mac was characterized by the inflammatory response chemokines of CXCL10 and CXCL9. It has been reported CXCL10 and CXCL9 were often localized with CXCL13-expressing T cells, which suggested they could participate in inflammation and antitumor reactivity (44). C1QA^+^ Mac highly expressed C1QA and C1QB, indicating that C1QA^+^ Mac might be involved in inhibiting tumor progression (45). SAMac specifically expressed TREM2, which was known to regulate scar-producing myofibroblasts (5). SPP1^+^ Mac was strikingly enriched in HCC and highest expressed immunosuppressive gene of SPP1 (46) (Figure 2c).
Characterization of macrophage subtypes and states during CLDs. (a) UMAP plot showing the MPs clusters, colors represent different cell populations, dots represent individual cells. cDC1, conventional dendritic cell 1; cDC2, conventional dendritic cell 2. (b) Histogram showing the proportion of MPs in different progression of CLDs. (c) Differential gene expression analysis showing up- (red) and down- (blue) regulated genes of monocytes and 9 macrophage subtypes. Adjusted p value < 0.05. (d) Density plot showing M1, M2, angiogenesis and phagocytosis properties of monocytes and 9 macrophage subtypes.
We next evaluated the macrophage polarization states of M1, M2, angiogenesis and phagocytosis properties to infer their functional states (Supplementary Figure 3a; Supplementary Table 2). CXCL10^+^ Mac showed the highest M1 score, whereas CXCL3^+^ Mac showed the higher M2 and angiogenesis score, suggesting CXCL10^+^ Mac take part in chronic inflammation, CXCL3^+^ Mac was an immunosuppressive phenotype (22). C1QA^+^ Mac display the highest M2 and phagocytosis score, revealing that C1QA^+^ Mac might promote tolerance and diminished pro-inflammation (47). Notably, C1QA^+^ Mac also expressed the highest level of CD5L and MARCO, reported to be associated with anti-inflammation (48, 49), which implicating that C1QA^+^ Mac could be a beneficial cell population of CLDs (Figures 2c, d). SPP1^+^ Mac showed the lowest M1 score, supporting SPP1^+^ Mac contributors to pro-tumor (50). Our observations elucidated the inflammatory response of CXCL3^+^ Mac, CXCL10^+^ Mac and C1QA^+^ Mac, and revealing SPP1^+^ Mac predominant present in HCC, implicating their important roles during CLDs processes.
We identified 14 T cell subtypes by unsupervised clustering analysis of T cells and NK cells (Supplementary Figure 2a), including naive T cell (Tn), NKT, exhausted T cell (Tex), effector T cell (Teff), proliferating T cell (Tproli), T helper cell (Th), T regulatory cell (Treg), stress response T cell (Tstr), effector memory T cell (Tem), cytotoxic T cell (Tc), Cycling NK & T, gamma delta T cell (γδT), mucosal-associated invariant T cell (MAIT) and tissue-resident memory T cell (Trm). But we didn’t observe changing patterns in T cell compositions during CLDs processes (Supplementary Figure 2b). Tn expressed high levels of naive markers. Tex demonstrated the highest expression of CXCL13. Tstr characterized by high expression of heat shock genes. Tc markedly expressed cytolytic activity-related genes. Tem showed high expression of immunoglobulin-related genes (Supplementary Figure 2c). To understand the state of T cells, we calculated the scores of naive, activation, cytotoxicity, and exhaustion onto the UMAP, which was following their expected functions (Supplementary Figure 2d; Supplementary Table 3).
The trajectories and regulators of macrophages and T cells subtypes in different CLDs processes
3.3
The CLDs processes were dynamic (51). To reveal novel cellular and molecular mechanisms driving MASH to HCC, we further explored the differentiation trajectories and transcriptional regulation of macrophages and T cells subtypes. We applied Destiny (19) to infer the differentiation trajectory of macrophages and T cells subtypes. Macrophages subtypes displayed a trajectory that started with monocytes. FCN1^+^ Mac, S100A8^+^ Mac, and VSIR^+^ Mac were primary site in initial state same as monocyte. CXCL3^+^ Mac and CXCL10^+^ Mac mainly in intermediate state, which might drive the unique transcriptomic identities of MASH microenvironment (52). C1QA^+^ Mac, SAMac and SPP1^+^ Mac were dominating located in terminal state (Figures 3a, b), SAMac has been proved accumulation within the fibrotic niche (5). These findings supported that the HCC was correlated with C1QA^+^ Mac and SPP1^+^ Mac. T cells displayed two paths started with Tn. The path 1 ending in a terminally differentiation of Tex, Tc, γδT and Trm. The path 2 contained Tn, Treg and MAIT (Supplementary Figures 4b, c). These suggested the path 1 of T cells might be associated with HCC (23).
Developmental trajectory and of transcription factor activity analysis of macrophage subtypes during the progression of CLDs. (a) Confirmation of trajectories using a diffusion-map approach. (b) Pseudo-time trajectory projected of macrophage subtypes. Pseudo-time values were color coded. DPT, diffusion pseudo time. (c) Heatmap showing the regulon activities of transcription factors (left) and expression profiles (right) in different macrophage subtypes; the color key from blue to red indicated regulon specificity score and relative expression levels from low to high. (d, e). Dot plots showing the enrichment of the biological process-related GO terms in CXCL3+ Mac (d) and CXCL10+ Mac (e).
To investigate the transcriptional regulation dynamics of different macrophage subtypes during CLDs progression, we applied SCENIC (21) to calculate the activity of cell-type-specific regulators across CLDs processes. Interestingly, we found various transcription factors were highly expressed within the corresponding macrophage subtypes. The expression of ETS2 and IRF1 were consisted with transcription factors activities, which suggested that ETS2/IRF1 was specific targeting to CXCL3^+^ Mac/CXCL10^+^ Mac (Figure 3c; Supplementary Figure 4a). In addition, we explored gene ontology (GO) analyses to reveal CXCL3^+^ Mac was enriched in chemokine−mediated signaling pathway and inflammatory response (Figure 3d), CXCL10^+^ Mac was significantly enriched in response to biotic stimulus and immune response (Figure 3e). These implied that CXCL3^+^ Mac and CXCL10^+^ Mac might play important roles in MASH.
Validation of the macrophage subtypes compositions using mouse models
3.4
To validate the compositions of macrophage subtypes across CLDs progresses from scRNA-seq analysis, we constructed the mouse models of MASH, liver fibrosis and HCC (Figure 4a). Firstly, we evaluated the inflammation and fibrosis at the histological level by H&E and Masson’s trichrome staining to confirm the results in the scRNA-seq analysis (Figure 4b). Next, we utilized FISH to visualize those macrophage subtypes and directly calculated their cellular abundances. We used Clec4f as canonical liver macrophage marker. The well-conserved genes of C1qa, Cxcl3, Cxcl10, Trem2 and Spp1 were used to mark the signature genes (Figure 4c; Supplementary Table 4). If the signal of macrophage subtype signature genes were within 20 microns in diameter of Clec4f signal at 400 µm × 400 µm region, we recognized they were the corresponding macrophage subtype. As a result, C1QA^+^ Mac was enriched in healthy liver, CXCL3^+^ Mac and CXCL10^+^ Mac were commonly present in MASH, SAMac was enriched in liver fibrosis, and SPP1^+^ Mac was predominantly present in HCC (Figures 4d, e). Collectively, we affirmed the 5 macrophage subtypes presented at different processes of CLDs progresses.
Validation of the macrophage subtypes abundance with healthy liver, MASH, liver fibrosis, and HCC mice models. (a) Schematic representation of the mouse models. (b) Histological observation of Healthy liver, MASH, liver fibrosis and HCC by H&E and Masson’s trichrome staining. Images were representative of three biologically independent mice. Scale bar: 200 µm. (c) FISH staining to validate the macrophage subtypes compositions. Scale bars: 200 µm. (d) The macrophage subtypes compositions across chronic liver disease progressions calculated from Figure 4c (n = 5). Two-sided Student’s t test. Statistical significance was indicated as follows: p < 0.05 (), p < 0.01 (), p < 0.001 (), and p < 0.0001 (**), ns, not significant.
Macrophages-T cells interactions revealed hetero-cellular crosstalk in CLDs progresses
3.5
We next aimed to understand the complex cellular interactions among diseases-associated macrophages and T cells. CellChat (20) was used to compare macrophages-T cells interactions in the previous versus subsequent processes of CLDs. The comparisons of macrophages-T cells interactions were distinct differences during the progression of CLDs. We observed CXCL3^+^ Mac and CXCL10^+^ Mac showed stronger crosstalks with Tex, Trm and γδT between health and MASH processes. The interaction strength of SAMac and SPP1^+^ Mac were increased in both MASH versus cirrhosis and cirrhosis versus HCC. C1QA^+^ Mac showed strong interaction strength in healthy liver and from MASH to cirrhosis (Figures 5a, b). MHC class II (MHC-II) were constitutively expressed on the surface of macrophages. MHC-II complexes depended on the distinct macrophage subtypes (53). We inferred cell-cell communication at the signaling pathway level. The interactions between CXCL3^+^ Mac and CXCL10^+^ Mac were mediated mainly by MHC-II signaling pathway. The interactions of MHC-II signaling pathway increased significantly from C1QA^+^ Mac, SAMac and SPP1^+^ Mac in healthy liver and HCC (Figures 5c-f). To further elucidated the molecular characteristics of diseases-associated macrophages and T cells, we utilized entropy test to detect the signature gene sets from the differentially expressed genes of each cell subtype (Figures 5g, h). Notably, we found SPP1, IFI27, FOLR2 and SELENOP were the signature gene sets of SPP1^+^ Mac. These genes were reported to participate in immunosuppression and influence liver metabolic activites (12, 54, 55). The signature gene sets of Tc contained cytotoxicity-related molecules (FGFBP2, GNLY, GZMB, PRF1 and GZMH) and the transcription factor of suppress exhaustion (KLF2) (56, 57). These results indicated that SPP1^+^ Mac and Tc could be potential targets for HCC immunotherapy. We want to further identify the potential therapeutic targets from the signature gene sets. In brief, our results suggested a differentiated macrophages-T cells interactions and molecular phenotypes during the progression of CLDs.
The intercellular communication and signature genes of disease associated T cell and macrophage in different disease processes. (a) Circos plot showed differential interaction strength relative in healthy liver, MASH, liver cirrhosis and HCC, red indicated increased interaction strength and blue indicated decreased strength. (b) Heatmap showed interaction strength among 9 cell subtypes in chronic liver disease progressions, red represented increased interactive strength, blue represented decreased interactive strength. c-f. The MHC-II signaling pathway network in healthy liver (c), MASH (d), liver cirrhosis (e) and HCC (f). (g) Radar charts showed the entropy difference of gene in C1QA+ Mac, CXCL3+ Mac, CXCL10+ Mac, SAMac and SPP1+ Mac. (h) Radar charts showed the entropy difference of gene in Tc, Tex, Trm and γδT.
Integration of bulk RNA-seq data to revealed predictive prognostic biomarkers in HCC
3.6
ScRNA-seq provided an insight on the cellular heterogeneity in the TME. However, the scRNA-seq studies lacked survival data. We employed TCGA-LIHC data to verify the expression patterns of signature gene sets in HCC and reveal the key genes contributing to HCC. We developed a method of gene sets enrichment score to validate the signature gene sets from scRNA-seq (Figures 5g, h) based on TCGA-LIHC dataset. We calculated gene sets enrichment score of macrophage subtypes and defined as Mscore. The Tscore was defined for gene sets enrichment score of T cell subtypes. The Mscore and Tscore were extensions of the ImmuCellAI (28), designed to provide a simple and intuitive summary of predefined immune gene sets derived from scRNA-seq data, enabling the comparison of estimated cell populations in HCC. The details of the method calculating gene sets enrichment score were described in Methods. We found Mscore of SPP1^+^ Mac and Tscore of Tc were significant difference in the HCC group than the normal group (Figures 6a, b), which further validating SPP1^+^ Mac and Tc were associated with HCC. Next, basing on the clinical data from the TCGA-LIHC project, we confirmed that the higher Tscore of Tc was associated with a survival advantage in HCC, while an opposite effect was observed in SPP1^+^ Mac (Figure 6c), consistent with our hypothesis. Furthermore, we employed LASSO regression model and Cox regression analysis to reveal KLF2 was contributed to favorable prognosis and SPP1 were associated with poor outcomes in HCC (Figure 6d; Supplementary Figures 6a, b). As reported, KLF2 was favored effector differentiation and suppressed exhaustion (58). SPP1 overexpression was identified in tumor-associated macrophages across several cancer types and associated with poor prognosis (59).
KLF2 contributed to the good and SPP1 induced bad clinical outcome in HCC. (a) Boxplot showing the Mscores of macrophage subtypes in healthy liver (n = 50) and HCC (n = 374). Wilcoxon test. (b) Boxplot showing the Tscores of T cell subtypes in healthy liver (n = 50) and HCC (n = 374). Wilcoxon test. (c) Kaplan-Meier plots showing clinical outcome in HCC with Mscore of SPP1+ Mac and Tscore of Tc. (d) Kaplan-Meier plots showing clinical outcome in HCC with the expression of SPP1 and KLF2 in HCC. (e, f). Left: Representative FISH micrographs (n ≥ 3) showed the distribution of Tc (e) and SPP1+ Mac (f) in HCC. Close-up images on the (left bottom) correspond to boxed regions on the (top left). Top right: Scatterplots showed the distribution of SPP1+ Mac and Tc corresponding to FISH micrographs on the Zoom 3. Bottom right: Violin plots showed the distance quantification of SPP1+ Mac and Tc to the closest tumor cell corresponding cells identified on FISH micrographs on Zoom 3. Spp1 (green), Klf2 (yellow), Cd3 and Clec4f (red), HCC (cyan) and DAPI (blue). Statistical significance was indicated as follows: p < 0.05 (), p < 0.01 (), p < 0.001 (), and p < 0.0001 (**), ns, not significant.
In addition, we revealed the spatial distribution and cellular interaction of SPP1^+^ Mac and Tc. We quantified distance from SPP1^+^ Mac and Tc to its closest HCC cell by FISH micrographs. Figures 6e, f showed the FISH micrographs of the markers (top left, Supplementary Table 4), the corresponding dot plots of Zoom 3 representing the spatial distribution of SPP1^+^ Mac and Tc (bottom left), and the corresponding distance quantification from SPP1^+^ Mac and Tc to the closest HCC cell in Zoom 3 (bottom right). We found that Tc localized further away from the HCC cell (Figure 6e and Supplementary Figure 6c, with a median distance of 12.6 μm) compared to SPP1^+^ Mac that infiltrated and tightly surrounded the HCC cell (Figure 6f and Supplementary Figure 6c, with a median distance of 6.1 μm). The FISH micrographs also demonstrated that the number of SPP1^+^ Mac and Tc were significantly higher in HCC, and the double-positive cell pairs of Spp1 with Clec4f and Klf2 with Cd3 were close proximity to that in healthy liver (Supplementary Figures 6d-g, with a median distance of 0 μm). It suggested the potential crosstalk between SPP1^+^ Mac and Tc. Taken together, these findings suggested SPP1^+^ Mac contributed to the immunosuppressive microenvironment in HCC, Tc played anti-tumorigenic roles of HCC. We also determined that KLF2 and SPP1 involved in the progression of HCC and could be further clinical investigation.
Discussion
4
MASH now became the fastest growing cause of liver cancer; however, the increased risk of HCC in patients with MASH was often misdiagnosed (51). Our study deciphered the molecular signatures and functional properties of the immune cells at different stages of CLD processes, rather than a linear evolutionary trajectory of NASH-induced chronic liver disease. By integrating scRNA-seq, bulk RNA-seq and FISH, we elucidated diverse cellular populations, phenotypic states and transcriptional profiles, which providing molecular characteristics for clinical diagnosis and immunotherapy of CLDs. Because mRNA and protein expression levels could differ substantially and were not necessarily linearly correlated, we employed FISH to validate the molecular markers at the transcriptional level. Future validation at the protein level using immunofluorescence or flow cytometry could strengthen these findings.
It has been recognized that both innate and adaptive immune mechanisms played important roles in promoting hepatic inflammation of MASH-HCC (8). Focused on macrophages and T cells, we identified five macrophage subtypes (CXCL3^+^ Mac, CXCL10^+^ Mac, C1QA^+^ Mac, SPP1^+^ Mac and SAMac) and four T cell subtypes (Tex, Tc, γδT and Trm) associated with CLDs processes. We overcame the limitations of single-disease data and identified stage-specific cell types by integrating data from multiple stages of CLDs. The stage-specific macrophage subtypes exhibited diverse patterns. The lipid-associated macrophage has been reported to arise prominently under obesity conditions in adipose tissue, highlighting the specific expression of Trem2 (60). However, it resembled the SAMac in liver cirrhosis (5). We found CXCL3^+^ Mac and CXCL10^+^ Mac were enriched in MASH and resided in intermediate stages of CLDs progression, with ETS2 and IRF1 potentially involved in regulating their transcriptional programs, which might potentially contribute to the transition from MASH to HCC. ETS2 has been reported as a central regulator of macrophage inflammation (61). IRF1 could regulate the transcription of inflammation and cell death related genes, which induced further elicited inflammatory injury (62). C1QA^+^ Mac, SPP1^+^ Mac and SAMac displayed terminal-stage characteristics. Together, these findings suggested the distinct cellular heterogeneity gave rise to phenotypic and functional diversity, which in turn shaped microenvironmental variation in CLDs progression. A limitation of these results was supported at the transcriptomic level based on FISH; further validation at the protein level using immunofluorescence or flow cytometry could strengthen these findings.
Previous studies have reported SPP1^+^ Mac could induce exhaustion and dysfunction of tumor-reactive CD8 ^+^ T cell in extrahepatic tumors (63), while their effects on T cell subtype responses in HCC remained unclear. Notably, we uncovered SPP1^+^ Mac was predominant in HCC and correlated with poor prognosis, potentially driving immune evasion by establishing anergic crosstalk with Tc. In addition, we constructed gene sets enrichment score to detect KLF2 in Tc and SPP1 in SPP1^+^ Mac as HCC prognosis-related genes. KLF2 has been reported to improve the clinical benefit in HCC (64), whereas SPP1 was associated with worse overall survival in macrophage (46). We first found the closely interaction between SPP1^+^ Mac and Tc in HCC, suggesting that SPP1^+^ Mac could directly suppress the activation of Tc in HCC microenvironment, with KLF2 and SPP1 as key molecular biomarkers.
In conclusion, our work constructed the transcriptional atlas of CLD progression at single cell level, which might contribute to understanding molecular characteristics for clinical diagnosis and immunotherapy of CLDs. We revealed stage-specific macrophage subtypes and identified ETS2/IRF1 regulated macrophage programs driving MASH to HCC transition. Additionally, we combined the signature gene sets from scRNA-seq with the TCGA-LIHC to resolve SPP1 and KLF2 were the HCC associated genes, which might provide relevant therapeutic targets.
The reference list from the paper itself. Each links out to its DOI / PubMed record.
- 1Cheemerla S Balakrishnan M . Global epidemiology of chronic liver disease. Clin Liver Dis. (2021) 17:365–70. doi: 10.1002/cld.1061, PMID: 34136143 PMC 8177826 · doi ↗ · pubmed ↗
- 2Manikat R Ahmed A Kim D . Current epidemiology of chronic liver disease. Gastroenterol Rep. (2023) 12:goae 069. doi: 10.1093/gastro/goae 069, PMID: 38915345 PMC 11194530 · doi ↗ · pubmed ↗
- 3Marcellin P Kutala BK . Liver diseases: A major, neglected global public health problem requiring urgent actions and large-scale screening. Liver Int. (2018) 38:2–6. doi: 10.1111/liv.13682, PMID: 29427496 · doi ↗ · pubmed ↗
- 4Huang DQ Terrault NA Tacke F Gluud LL Arrese M Bugianesi E . Global epidemiology of cirrhosis — aetiology, trends and predictions. Nat Rev Gastroenterol Hepatol. (2023) 20:388–98. doi: 10.1038/s 41575-023-00759-2, PMID: 36977794 PMC 10043867 · doi ↗ · pubmed ↗
- 5Ramachandran P Dobie R Wilson-Kanamori JR Dora EF Henderson BEP Luu NT . Resolving the fibrotic niche of human liver cirrhosis at single-cell level. Nature. (2019) 575:512–8. doi: 10.1038/s 41586-019-1631-3, PMID: 31597160 PMC 6876711 · doi ↗ · pubmed ↗
- 6Pfister D Núñez NG Pinyol R Govaere O Pinter M Szydlowska M . NASH limits anti-tumour surveillance in immunotherapy-treated HCC. Nature. (2021) 592:450–6. doi: 10.1038/s 41586-021-03362-0, PMID: 33762733 PMC 8046670 · doi ↗ · pubmed ↗
- 7Pinyol R Torrecilla S Wang H Montironi C Piqué-Gili M Torres-Martin M . Molecular characterisation of hepatocellular carcinoma in patients with non-alcoholic steatohepatitis. J Hepatol. (2021) 75:865–78. doi: 10.1016/j.jhep.2021.04.049, PMID: 33992698 PMC 12164395 · doi ↗ · pubmed ↗
- 8Llovet JM Willoughby CE Singal AG Greten TF Heikenwälder M El-Serag HB . Nonalcoholic steatohepatitis-related hepatocellular carcinoma: pathogenesis and treatment. Nat Rev Gastroenterol Hepatol. (2023) 20:487–503. doi: 10.1038/s 41575-023-00754-7, PMID: 36932227 PMC 12165718 · doi ↗ · pubmed ↗