Genotype and Age at Onset Drive Vermis Atrophy in CACNA1A- and GAA-FGF14-related Ataxias
Elisabetta Indelicato, Wolfgang Nachbauer, Matthias Amprosi, David Pellerin, Stephanie Mangesius, Elke R. Gizewski, Stefan Kiechl, Bernhard Brais, Sylvia Boesch, Florian Krismer

TL;DR
This study shows that genetic factors and age at which symptoms begin strongly influence the degree of cerebellar vermis atrophy in two types of inherited ataxia.
Contribution
The study identifies genotype-specific and age-related patterns of vermian atrophy in CACNA1A and GAA-FGF14-related ataxias using deep learning-based MRI analysis.
Findings
Vermian atrophy is most prominent in patients with missense CACNA1A variants and early disease onset.
Age at onset correlates with vermian atrophy (rs(26) = 0.47, p = 0.01), but not with clinical severity of chronic ataxia.
Three distinct atrophy patterns were identified, with genotype and episodic symptom type differing across clusters.
Abstract
CACNA1A- and GAA-FGF14-related channelopathies are among the most frequent genetic etiologies of cerebellar ataxia. They display overlapping features consisting of both chronic and episodic neurological symptoms and usually show only a mild cerebellar atrophy in imaging studies, with prevalent involvement of the vermis. To evaluate cerebellar volumetry as a biomarker for distinguishing between these disorders and for understanding their neuroanatomical correlates. We applied a deep learning method (CerebNet) for the lobular segmentation and volumetry assessment of the cerebellum on 3.0 Tesla MRI scans of patients with genetically confirmed CACNA1A- (n = 16) and GAA-FGF14-related (n = 12) ataxia. K-means clustering and principal component analysis were employed to assess infratentorial atrophy patterns. Three distinct clusters based on the patterns of infratentorial volume loss were…
Genes, proteins, chemicals, diseases, species, mutations and cell lines named across the full text — each resolved to its canonical identifier and authoritative record.
Click any figure to enlarge with its caption.
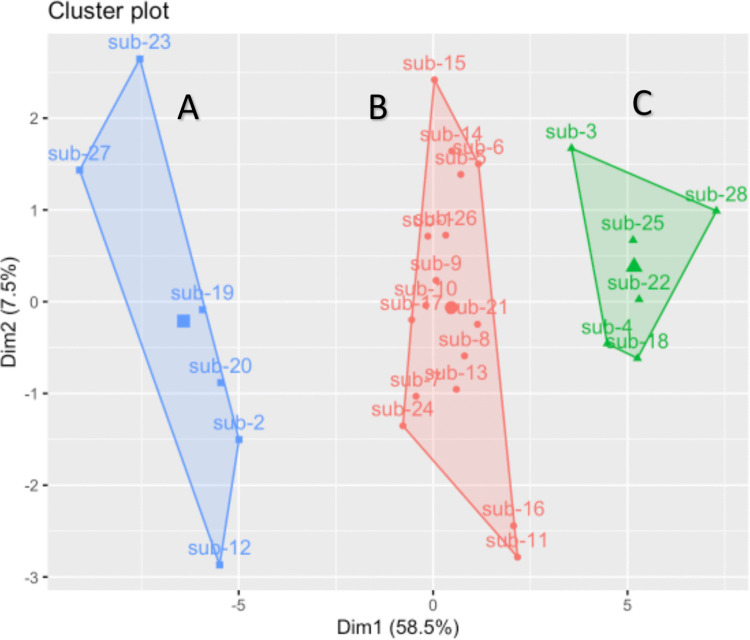 Figure 1
- —University of Innsbruck and Medical University of Innsbruck
Peer Reviews
No public reviews on file for this paper yet. If you reviewed it on a platform where reviews are public (OpenReview, ICLR, NeurIPS, ICML), you can paste yours below so the community can read it here.
Videos
No videos yet. Explain this paper in a talk, walkthrough, or lecture? Add one.
Taxonomy
TopicsGenetic Neurodegenerative Diseases · Ion channel regulation and function · Hereditary Neurological Disorders
Introduction
Ion channel dysfunction is a recurring etiology of inherited ataxias [1]. Ataxic syndromes associated to channelopathies typically present with both episodic and chronic neurological symptoms and usually show a prevalent or exclusive involvement of the vermis in imaging studies [1–4]. These features are recapitulated by CACNA1A- [OMIM *601011] and FGF14- [OMIM *601515] related disorders, which list among the most frequent molecular etiologies of inherited ataxias [5, 6].
CACNA1A is a bicistronic gene which encodes both the pore-forming α1A-subunit of the neuronal P/Q Ca^2+^ channel and the transcription factor α1ACT which drives maturation of the Purkinje cells in the early development [7]. Single nucleotide variants and small deletions in CACNA1A are associated with dominantly inherited phenotypes sharing a common denominator of chronic cerebellar signs and paroxysmal features [2]. Classical episodic manifestations associated with CACNA1A disease spectrum include hemiplegic migraine, which is typically associated with missense variants (OMIM #141500, “Familial Hemiplegic Migraine 1”), and episodic ataxia, which are more often observed in cases with loss-of-function variants (OMIM #108500, “Episodic Ataxia Type 2”) [8]. Clinical features associated with CACNA1A variants can vary greatly, even within the same family. Age at onset can range from the first to the seventh decade [5].
FGF14 encodes a member of the fibroblast growth factor family, which has been shown to directly bind and regulate potassium and voltage-gated sodium channels, thus influencing membrane potential and synaptic transmission [9, 10]. Recently, a pathologically expanded deep intronic GAA•TTC repeat in the FGF14 gene has been associated with a dominantly inherited adult-onset ataxia with frequent episodic features, also known as spinocerebellar ataxia 27B (SCA27B, OMIM #620,174) [6]. Cumulative evidence suggests that this entity may become one of the most frequent inherited ataxias as the genetic testing becomes widely available [11].
From a clinical perspective, phenotypes of adult patients with GAA-FGF14- and CACNA1A-related episodic ataxia largely overlap [12]. Sparse literature describes either unremarkable brain MRI or a mild cerebellar atrophy, usually restricted to the vermis in both disorders [13–15].
With these entities being increasingly recognized, a growing interest is focusing on the definition of biomarkers which may support differential diagnosis, reflect prognostic trajectories and clinical course, with potential application in future trials. Cerebellar volume estimation from structural MRI is a relevant neuroanatomical marker which has been intensively studied in other inherited cerebellar ataxias [16–20]. In CACNA1A disorders, systematic imaging studies are limited to single cohorts studied with MR spectroscopy [21, 22]. One study identified hyperintensities of the superior cerebellar peduncles on MRI as a characteristic, albeit modestly sensitive, sign of GAA-FGF14-related ataxia [15].
In the present study, we applied a deep learning method for the lobular segmentation of the cerebellum [16] to assess cerebellar volumetry in a cohort of patients with cerebellar ataxia due to either non-polyglutamine CACNA1A variants or GAA-FGF14-expansions. Our objectives were i) to evaluate the diagnostic performance and discriminative power of this novel methodology and ii) to identify molecular and clinical correlates associated with the neuroanatomical mapping-based findings.
Patients and Methods
Study Population
Adult patients with cerebellar ataxia and genetically confirmed non-polyglutamine CACNA1A disease (from now on referred to as “CACNA1A disease”) or GAA-FGF14-related disease were recruited at the Center for Rare Movement Disorders of the Medical University of Innsbruck. The diagnosis of CACNA1A disease was confirmed based on the detection of a variant that was classified as likely pathogenic or pathogenic according to the criteria of the American College of Medical Genetics and Genomics (ACMG) [23]. The diagnosis of SCA27B was confirmed based on the detection of a deep intronic GAA•TTC expansion in FGF14 of at least 250 uninterrupted repeats. GAA-FGF14-expansions testing was performed according to a previously described protocol [24]. The severity of the cerebellar syndrome was defined by means of the SARA (Scale for the Assessment and Rating of Ataxia) score [25].
Imaging Studies and Statistical Analysis
MRI acquisitions were performed on a 3.0 Tesla whole‐body Siemens MR scanner. 3-dimensional T1‐weighted images were processed with the FastSurfer pipeline [26] and the CerebNet module [16] to segment subcortical brain region and estimate different brain regions volumes. Normative data for subcortical regional volumes over the lifetime of the adult human brain were generated from 236 healthy participants from open access MR datasets from the Parkinson’s Progression Markers Initiative (PPMI; for up to date information see https://www.ppmi-info.org/) and National Institute of Mental Health (NIMH) Data Archive (https://nda.nih.gov/, dataset 10.18112/openneuro.ds005752.v2.1.0) in compliance with the respective data use agreements. Data used in the preparation of this article were also obtained from the Alzheimer’s Disease Neuroimaging Initiative (ADNI) database (adni.loni.usc.edu). The ADNI was launched in 2003 as a public–private partnership, led by Principal Investigator Michael W. Weiner, MD. The primary goal of ADNI has been to test whether serial magnetic resonance imaging (MRI), positron emission tomography (PET), other biological markers, and clinical and neuropsychological assessment can be combined to measure the progression of mild cognitive impairment (MCI) and early Alzheimer’s disease (AD).
We performed statistical analyses with the IBM software SPSS version 29 and R version 4.5.0. Generalized Additive Models were employed using the GAMLSS package in R to investigate the influence of age and sex on regional brain volumes in healthy adults. A separate model was fitted for each brain region of interest, with the respective volume measure as the dependent variable. The models included age (modelled non-linearly using penalized B-splines with three degrees of freedom) and sex as predictors. For patients, individual deviations from the normative distribution were reported as z-scores. To this end, the parameters of the GAMLSS models previously fitted based on healthy controls were used to estimate the expected distribution (μ, σ, ν, and τ) for a given age and sex. The cumulative distribution function of the Box–Cox power exponential (BCPE) distribution was evaluated at the patient's observed volume and the resulting percentile was converted into a standard z-score. After z-transformation, a k-means clustering analysis with 3 centers was performed to group the data points into distinct clusters based on their similarity, aiming to identify underlying patterns of infratentorial brain atrophy. Subsequently, a principal components analysis (PCA) of the cluster dimensions was conducted to study what dimensions primarily drive cluster separation. Comparisons among clusters were conducted using one-way ANOVA or the Kruskal–Wallis test, with Bonferroni correction applied for multiple comparisons as appropriate. Spearman’s rank correlation coefficient was used to assess correlations.
Results
Clinical Characteristics
The patient cohort addressed in this study consisted of 28 adults with cerebellar ataxia, including 16 diagnosed with CACNA1A-related disease and 12 with GAA-FGF14-disease. Demographic and clinical characteristics are reported in Table 1. Patients with CACNA1A disease were younger and had an earlier age at onset of disease. The severity of chronic ataxia was mostly mild and comparable in patients with CACNA1A disease and GAA-FGF14-ataxia. Clinical history revealed spells of episodic ataxia in 7/16 (44%) patients with CACNA1A disease and 11/12 (92%) patients with GAA-FGF14-disease. (p = 0.01 in the comparison). Migraine with aura was reported exclusively by patients with CACNA1A disease (in 11/16, 44% of cases, p < 0.001 in the comparison with GAA-FGF14-disease). At the time of the MRI, 14/16 patients with CACNA1A disease and 3/12 patients with GAA-FGF14-disease assumed an interval prophylaxis. Involvement of the superior cerebellar peduncle, as observed on T2-weighted MRI sequences [27] was detected in 4 of 12 patients with GAA-FGF14-disease (33%), appearing prominently in two patients and faintly in the remaining two. This sign was not observed in any patients with CACNA1A disease (p = 0.024 in the comparison).Table 1. Demographics and clinical characteristics of the study cohortCACNA1A(n = 16)GAA-FGF14 (n = 12)p valueGendern. of females, %4 (25%)5 (42%)0.299Age at MRIyears, median (IQR)56 (38–64)70 (63–73)0.002SARA score at MRImedian (IQR)9 (6–12)11 (8–17)0.698SCP signn., %04 (33%)0.024Phenotype Migraine with auran., %11 (69%)0 (0%) < 0.001 Episodic Ataxian., %7 (44%)11 (92%)0.011 Age at onset of episodic symptomsyears, median (IQR)12 (5–24)58 (50–70) < 0.001 Age at onset of chronic ataxiayears, median (IQR)38 (19–54)61 (54–70)** < 0.001Interval therapy Acetazolamiden., %7 (44%)3 (25%) 4-aminopyridinen., %3 (19%)1 (8%) Topiramaten., %2 (13%)0 Flunarizinen., %2 (13%)0 No interval therapyn., %2 (13%)10 (83%)IQR interquartile range; SARA Scale for the Assessment and Rating of Ataxia; SCP superior cerebellar peduncle. P values were calculated using the *Fisher's exact test or the **Mann–Whitney U test
Cluster analysis of Cerebellar Lobules Volumetry
The k-means clustering analysis defined three clusters based on the pattern of infratentorial brain atrophy, as shown in Fig. 1. The PCA revealed that the first principal component explained 58.5% of the variance indicating that it captured the most significant patterns. Vermis atrophy as well as the cerebellar lobules IV – VII had the highest relative contribution to this principal component. Cluster A (blue labelled in Fig. 1) comprised subjects with the highest degree of atrophy of the cerebellar vermis (z score > 4 in the comparison with controls). Cluster B and C (red and green labelled respectively in Fig. 1) could not be distinguished from controls based solely on the degree of vermian atrophy. Cluster A comprised six subjects, who all carried missense variants in CACNA1A. Cluster B comprised 16 patients of whom eight with GAA-FGF14-expansions and eight with CACNA1A variants (six missense, two loss-of-function). Cluster C comprised six patients, also with a mixed genotype (four GAA-FGF14-expansions and two CACNA1A variant of which one missense and one loss-of-function). Detailed patients’ clinical data are available in the supplementary material. Regarding the phenotype, all patients from cluster 1 presented migraine with aura as main paroxysmal manifestation (p = 0.004 in the groups comparison, see also Table 2). Conversely, the frequency of episodic ataxia showed an opposite trend with increasing frequency from cluster A to cluster C (p = 0.028). Comparison across the three groups did not show statistically significant differences concerning the age at the time of MRI. Instead, cluster A patients displayed a significantly lower age at onset of both episodic symptom and chronic ataxia in comparison to the other two clusters (p = 0.010 and p = 0.023, respectively). In the whole cohort, the age at onset of chronic ataxia displayed a significant, moderate correlation with the degree of vermian atrophy (as expressed by the z scores, rs(26) = 0.47, p = 0.01). The severity of chronic cerebellar syndrome (as expressed by the SARA score) at the time of the MRI was comparable across the three groups and did not display a correlation with the degree of vermian atrophy.Fig. 1. Clustering by principal component analysis of cerebellar lobules volumetryTable 2Volumetry-based group stratification: demographics and clinical characteristicsCluster A (n = 6)Cluster B(n = 16)Cluster C(n = 6)p valueAge at MRIyears, 95%(CI)49 (36–62)63 (55–70)58 (39–76)0.119SARA score at MRImedian (IQR)10 (7–12)11 (9–15)7 (4–10)0.125**CACNA1A genotypen.,%6 (100%)8 (50%)2 (33%)0.035Phenotype Migraine with Auran., %6 (100%)4 (25%)1 (17%)0.004 Episodic Ataxian., %1 (17%)12 (75%)5 (83%)0.028** Age at onset of episodic symptomsyears, median (IQR)6 (2–12)55 (14–63)49 (11–66)0.010* Age at onset of chronic ataxiayears, median (IQR)23 (15–44)58 (46–65)56 (42–70)0.023**IQR* interquartile range; SARA Scale for the Assessment and Rating of Ataxia. P values were calculated using the *one-way ANOVA or the ** Kruskal–Wallis test, with Bonferroni correction applied for multiple comparisons
Based on cerebellar lobules volumetry patients were stratified in three clusters with increasing infratentorial atrophy (A > B > C). Detailed clinical data on each subject are provided in the supplement.
Discussion
In many ataxic disorders, cerebellar atrophy represents a relevant non-invasive neuroanatomical marker [17–19] whose evolution can be accurately captured via volume estimation from structural MRI, already in a pre-symptomatic disease stage [19, 28]. Cerebellar atrophy is a proxy of disease severity in this setting [17, 18, 29, 30].
CACNA1A- and GAA-FGF14-related disorders are among the most frequent genetic causes of cerebellar ataxia. CACNA1A- and GAA-FGF14-related disorders are the main differential diagnoses to consider when chronic cerebellar signs go along with episodic neurological manifestations. In contrast to other cerebellar disorders, they are usually accompanied by a rather mild cerebellar atrophy at MRI which, if present, is mostly limited to the vermis [13, 14]. In the clinical experience, visual inspection of brain MRI has limited sensitivity in detecting atrophy changes related to CACNA1A disease and GAA-FGF14-related ataxia as well as in quantifying their evolution over time. As a result, the application of cerebellar volumetry is of utmost interest and an unmet need in the quest for biomarkers in these disorders [15, 31]. Bearing this in mind, we applied a recently described deep learning method [16] to assess cerebellar volumetry in a cohort of patients with CACNA1A disease and GAA-FGF14-related ataxia. We made a few key observations. First, automated cerebellar volumetry clearly separated patients based on the degree of vermian atrophy. Secondly, this neuroanatomical marker neither did correlate with the age at the examination nor, more interestingly, with the severity of the chronic cerebellar syndrome. Instead, migraine with aura and the age at disease onset were the clinical features which showed the strongest association with the volumetric findings. Notably, the cluster exhibiting the most pronounced vermian atrophy consisted of patients with homogeneous characteristics, including early-onset ataxia, migraine with aura, and the presence of missense CACNA1A variants. Progressing from clusters with more to less severe vermian atrophy, there was a corresponding increase in the frequency of episodic ataxia as phenotype and both loss-of-function CACNA1A variants and GAA-FGF14-expansions as genotypes. Taken together these observations reflect a correlation of atrophy-based clustering with the underlying form of channel dysfunction. In fact, a gain-of-function mechanism underlies the phenotype of missense CACNA1A variants resulting in migraine with aura [32], whereas a loss-of-function mechanism is predicted to underlie episodic ataxia, both in the context of frameshift/truncating CACNA1A variants and in GAA-FGF14 expansions [6]. In murine models, both loss-of-function variants in CACNA1A and FGF14 disrupt the pacemaking function of the Purkinje cell and trigger paroxysmal motor symptoms [33, 34].
A tight correlation between the age at onset and the clinical course of CACNA1A disorders has been already observed and a phenotypic “spectrum” can be delineated based on the age at onset [35]. At the one extreme of this spectrum are early onset, most severe phenotypes such as “developmental encephalopathies”, which are associated with missense gain-of-function variants arising de novo [36]. The present MRI findings reinforce the concept of an age dependency of the CACNA1A phenotype [35], whose underlying pathophysiological mechanisms await to be unveiled. At central synapses, including the inhibitory synapses between Purkinje cells and deep cerebellar nuclei neurons, there is a developmental shift in the Ca^2^⁺ currents that mediate synaptic transmission [37]. This shift results in an increased reliance on P/Q-type calcium channels as postnatal development progresses [37]. Additionally, the expression of specific splicing variants of P/Q-type channels varies with age [38]. In this context, specific disease-causing variants in CACNA1A may have a particularly detrimental impact on the developing brain, leading to an enhanced susceptibility to neurodegeneration, as detected by automated cerebellar volumetry. Longitudinal studies would be crucial in determining whether these findings evolve across the lifespan and whether they correlate with the progression of clinical symptoms.
The discrepancy between the clinical severity of ataxia in some patients and the mild neuroanatomical alterations at MRI suggest that neurodegeneration is not a main or the sole- driver of cerebellar dysfunction in these disorders. This gives rise to hope for the definition of therapeutic strategies which might revert part of the neurological symptoms. To this concern, cerebellar volumetry may be helpful in stratifying patients for clinical studies by identifying those with a less prominent neurodegeneration who thus may benefit from early neuroprotective trials.
The present study bears several limitations. Cerebellar volumetry is currently used only in research settings and has not yet been integrated as a clinical tool in the diagnostic work-up of ataxias. The small sample size limits the generalizability of our conclusions. To address this limitation, future studies with larger cohorts are needed to corroborate our findings and to further investigate potential correlations between clinical milestones and imaging markers. If applied to a larger cohort, automated cerebellar volumetry could further validate the selective pattern of atrophy highlighted in this study and support its use as an additional diagnostic clue in the clinical work-up.
Conclusion
In conclusion, the pattern of cerebellar vermis atrophy as determined via automated cerebellar volumetry in CACNA1A- and GAA-FGF14-related disorders do not correlate with the severity of ataxia. Instead, the age at onset and the molecular mechanism of channel dysfunction were the most important determinants of vermian volume loss in our study. Replication and complementation with further experimental studies are advocated to unveil the pathophysiology of cerebellar dysfunction in these disorders.
In the future, early application of automated cerebellar volumetry to routine MRI scans may help detect visually unremarkable, region-specific patterns of cerebellar atrophy that are consistent with CACNA1A- and GAA-FGF14-related disorders.
Supplementary Information
Below is the link to the electronic supplementary material.Supplementary file1 (DOCX 19 KB)