Associations between blood glucose-lipid levels and post-intravenous thrombolysis outcomes in stroke patients: a retrospective study utilizing logistic regression analysis
Liu He, Rong Li, Yan Liu, Xin Tan, Lei Wang, Xi Zhu, Qiang Zhou, Zhiyong Yang, Hua Liu

TL;DR
This study finds that blood glucose and lipid levels are linked to outcomes in stroke patients treated with intravenous thrombolysis.
Contribution
The study introduces a predictive model using blood glucose and lipid levels to assess post-thrombolysis stroke outcomes.
Findings
Higher glucose and lipid levels are independent risk factors for poor stroke outcomes.
The model showed strong predictive accuracy at 30 and 90 days post-treatment.
Modifiable parameters like glucose and lipids may help improve risk-stratified stroke management.
Abstract
This study investigates the relationship between blood glucose and lipid profiles and the functional outcomes of acute ischemic stroke (AIS) patients treated with intravenous thrombolysis. We retrospectively analyzed data from AIS patients admitted to a tertiary hospital in Chengdu between September 2023 and March 2025. Patients were grouped according to post-thrombolysis modified Rankin scale (mRS) scores into good outcome (0–2) and poor outcome (3–6) categories. Multivariable logistic regression and nomogram modeling were used to identify predictors of 30- and 90-day outcomes. The final predictive model included 11 variables, and the results showed higher age, smoking, diabetes, higher systolic blood pressure (SBP), higher diastolic blood pressure (DBP), higher total cholesterol (TC), lower high-density lipoprotein cholesterol (HDL), higher low-density lipoprotein cholesterol (LDL),…
Genes, proteins, chemicals, diseases, species, mutations and cell lines named across the full text — each resolved to its canonical identifier and authoritative record.
Click any figure to enlarge with its caption.
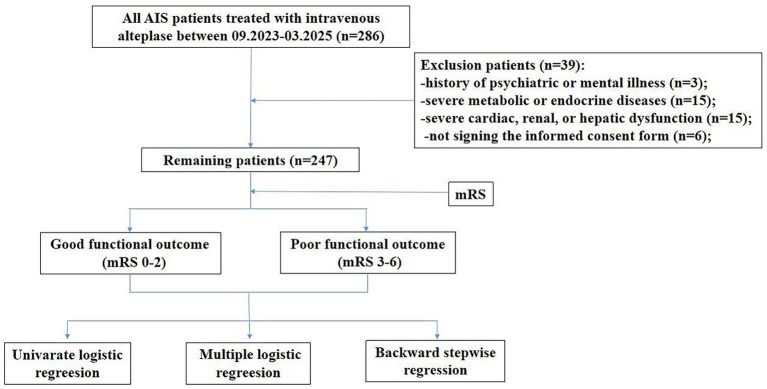 Figure 1
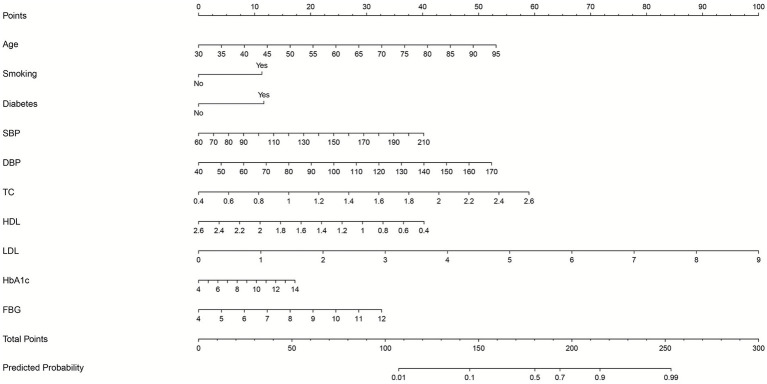 Figure 2
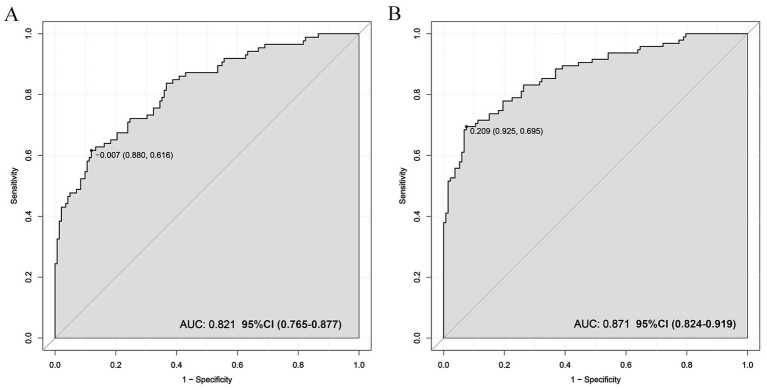 Figure 3
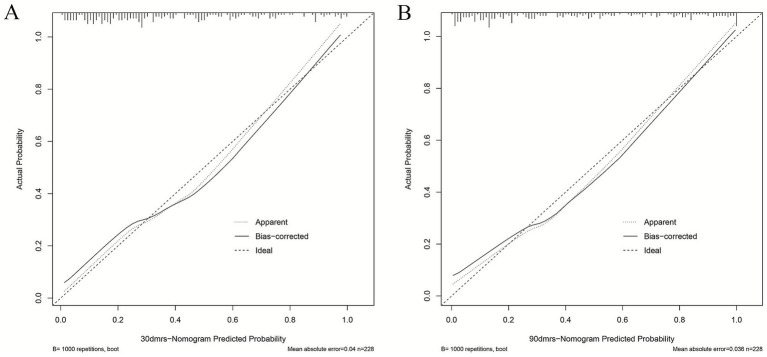 Figure 4
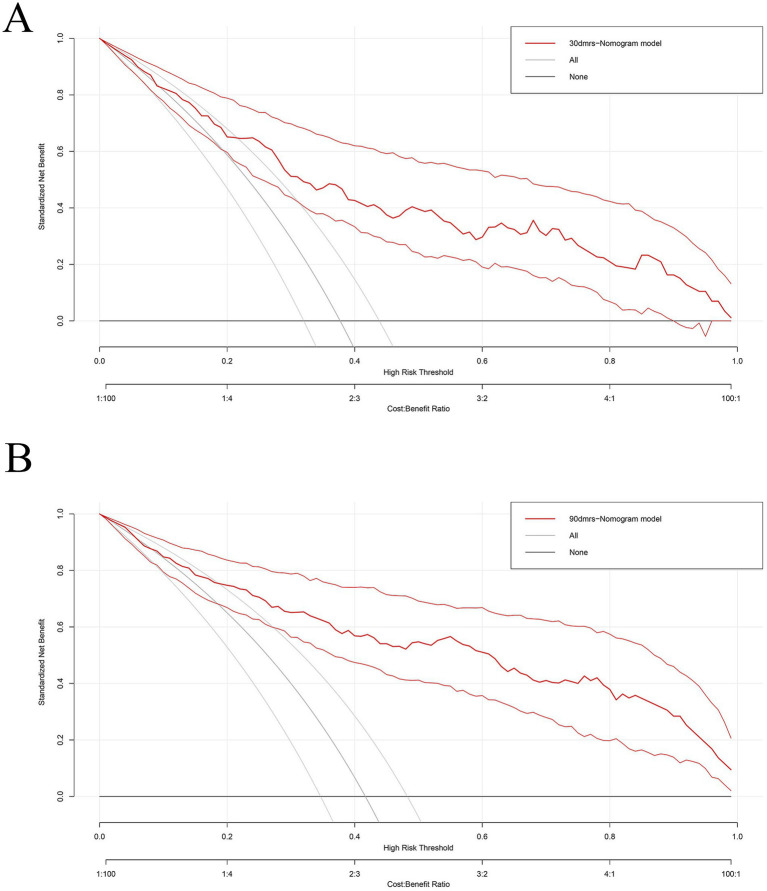 Figure 5
| Variable | Number of cases ( |
|---|---|
| Sex | |
| Male | 151 (61.13%) |
| Female | 96 (38.87%) |
| Age (years) | 70.98 ± 11.53 |
| Smoking | |
| No | 107 (43.32%) |
| Yes | 73 (44.24%) |
| Drinking | |
| No | 137 (55.47%) |
| Yes | 110 (44.53%) |
| Hypertension | |
| No | 76 (30.77%) |
| Yes | 171 (69.23%) |
| Diabetes | |
| No | 164 (66.40%) |
| Yes | 83 (33.60%) |
| Dyslipidemia | |
| No | 183 (74.09%) |
| Yes | 64 (25.91%) |
| Cerebral infarction | |
| No | 205 (83.00%) |
| Yes | 42 (17.00%) |
| Coronary heart disease | |
| No | 204 (82.59%) |
| Yes | 43 (17.41%) |
| Atrial fibrillation | |
| No | 186 (75.30%) |
| Yes | 61 (24.70%) |
| History of antiplatelet drugs | |
| No | 175 (70.85%) |
| Yes | 72 (29.15%) |
| History of anticoagulant drugs | |
| No | 226 (91.50%) |
| Yes | 21 (8.50%) |
| History of antihypertensive drugs | |
| No | 97 (39.27%) |
| Yes | 150 (60.73%) |
| History of statin drugs | |
| No | 169 (68.42%) |
| Yes | 78 (31.58%) |
| History of hypoglycemic drugs | |
| No | 185 (74.90%) |
| Yes | 62 (25.10%) |
| mRS score before thrombolysis | |
| 0 | 0 (0.00%) |
| 1 | 19 (7.69%) |
| 2 | 47 (19.03%) |
| 3 | 60 (24.29%) |
| 4 | 100 (40.49%) |
| 5 | 21 (8.50%) |
| 6 | 0 (0.00%) |
| 30dmRS | |
| 0 | 61 (24.70%) |
| 1 | 62 (25.10%) |
| 2 | 26 (10.53%) |
| 3 | 20 (8.10%) |
| 4 | 32 (12.96%) |
| 5 | 25 (10.12%) |
| 6 | 21 (8.50%) |
| 90dmRS | |
| 0 | 70 (28.34%) |
| 1 | 59 (23.89%) |
| 2 | 11 (4.45%) |
| 3 | 38 (15.38%) |
| 4 | 23 (9.31%) |
| 5 | 17 (6.88%) |
| 6 | 29 (11.74%) |
| First hospitalization SBP (mmHg) | 141.62 ± 21.24 |
| First hospitalization DBP (mmHg) | 86.50 ± 18.47 |
| DNT (min) | 67.08 ± 19.71 |
| PLT (109/L) | 176.78 ± 61.58 |
| INR | 1.20 ± 0.32 |
| Fg (g/L) | 2.63 ± 0.90 |
| TC (mmol/L) | 3.60 ± 0.92 |
| TG (mmol/L) | 1.10 ± 0.33 |
| HDL (mmol/L) | 1.37 ± 0.37 |
| LDL (mmol/L) | 2.23 ± 1.39 |
| HbA1c (%) | 7.81 ± 1.56 |
| FPG (mmol/L) | 7.29 ± 1.72 |
| 30 days | 90 days | |||||
|---|---|---|---|---|---|---|
| Variable | Good functional | Poor functional |
| Good functional | Poor functional |
|
| (mRS 0–2, | (mRS 3–6, | (mRS 0–2, | (mRS 3–6, | |||
| Age (years) | 69.56 ± 11.30 | 73.13 ± 11.61 | 0.018 | 69.47 ± 11.35 | 72.94 ± 11.53 | 0.019 |
| Sex | 0.239 | 0.614 | ||||
| Male | 96 (64.43%) | 55 (56.12%) | 88 (62.86%) | 63 (58.88%) | ||
| Female | 53 (35.57%) | 43 (43.88%) | 52 (37.14%) | 44 (41.12%) | ||
| Smoking | 0.009 | 0.001 | ||||
| No | 75 (50.34%) | 32 (32.65%) | 74 (52.86%) | 33 (30.84%) | ||
| Yes | 74 (49.66%) | 66 (67.35%) | 66 (47.14%) | 74 (69.16%) | ||
| Drinking | 0.073 | 0.005 | ||||
| No | 90 (60.40%) | 47 (47.96%) | 89 (63.57%) | 48 (44.86%) | ||
| Yes | 59 (39.60%) | 51 (52.04%) | 51 (36.43%) | 59 (55.14%) | ||
| Hypertension | 0.111 | 0.019 | ||||
| No | 52 (34.90%) | 24 (24.49%) | 52 (37.14%) | 24 (22.43%) | ||
| Yes | 97 (65.10%) | 74 (75.51%) | 88 (62.86%) | 83 (77.57%) | ||
| Diabetes | 0.018 | 0.009 | ||||
| No | 108 (72.48%) | 56 (57.14%) | 103 (73.57%) | 61 (57.01%) | ||
| Yes | 41 (27.52%) | 42 (42.86%) | 37 (26.43%) | 46 (42.99%) | ||
| Dyslipidemia | 0.975 | 0.603 | ||||
| No | 111 (74.50%) | 72 (73.47%) | 106 (75.71%) | 77 (71.96%) | ||
| Yes | 38 (25.50%) | 26 (26.53%) | 34 (24.29%) | 30 (28.04%) | ||
| Cerebral infarction | 0.772 | 0.655 | ||||
| No | 125 (83.89%) | 80 (81.63%) | 118 (84.29%) | 87 (81.31%) | ||
| Yes | 24 (16.11%) | 18 (18.37%) | 22 (15.71%) | 20 (18.69%) | ||
| Coronary heart disease | 0.403 | 0.099 | ||||
| No | 126 (84.56%) | 78 (79.59%) | 121 (86.43%) | 83 (77.57%) | ||
| Yes | 23 (15.44%) | 20 (20.41%) | 19 (13.57%) | 24 (22.43%) | ||
| Atrial fibrillation | 0.320 | 0.537 | ||||
| No | 116 (77.85%) | 70 (71.43%) | 108 (77.14%) | 78 (72.90%) | ||
| Yes | 33 (22.15%) | 28 (28.57%) | 32 (22.86%) | 29 (27.10%) | ||
| History of antiplatelet drugs | 0.260 | 0.350 | ||||
| No | 110 (73.83%) | 65 (66.33%) | 103 (73.57%) | 72 (67.29%) | ||
| Yes | 39 (26.17%) | 33 (33.67%) | 37 (26.43%) | 35 (32.71%) | ||
| History of anticoagulant drugs | 1.000 | 0.269 | ||||
| No | 136 (91.28%) | 90 (91.84%) | 131 (93.57%) | 95 (88.79%) | ||
| Yes | 13 (8.72%) | 8 (8.16%) | 9 (6.43%) | 12 (11.21%) | ||
| History of antihypertensive drugs | 0.184 | 0.235 | ||||
| No | 64 (42.95%) | 33 (33.67%) | 60 (42.86%) | 37 (34.58%) | ||
| Yes | 85 (57.05%) | 65 (66.33%) | 80 (57.14%) | 70 (65.42%) | ||
| History of statin drugs | 0.320 | 0.454 | ||||
| No | 106 (71.14%) | 63 (64.29%) | 99 (70.71%) | 70 (65.42%) | ||
| Yes | 43 (28.86%) | 35 (35.71%) | 41 (29.29%) | 37 (34.58%) | ||
| History of hypoglycemic drugs | 0.384 | 0.281 | ||||
| No | 115 (77.18%) | 70 (71.43%) | 109 (77.86%) | 76 (71.03%) | ||
| Yes | 34 (22.82%) | 28 (28.57%) | 31 (22.14%) | 31 (28.97%) | ||
| First hospitalization SBP (mmHg) | 137.61 ± 19.52 | 147.70 ± 22.37 | <0.001 | 137.99 ± 18.69 | 146.36 ± 23.42 | 0.003 |
| First hospitalization DBP (mmHg) | 84.45 ± 17.65 | 89.87 ± 19.38 | 0.036 | 83.56 ± 15.53 | 90.60 ± 21.35 | 0.007 |
| DNT (min) | 64.34 ± 16.91 | 71.24 ± 22.81 | 0.011 | 64.31 ± 16.81 | 70.70 ± 22.53 | 0.011 |
| PLT (109/L) | 174.35 ± 56.39 | 179.29 ± 66.74 | 0.585 | 174.16 ± 57.70 | 179.26 ± 65.26 | 0.585 |
| INR | 1.24 ± 0.39 | 1.13 ± 0.17 | 0.003 | 1.24 ± 0.40 | 1.13 ± 0.17 | 0.003 |
| Fg (g/L) | 2.42 ± 0.71 | 2.96 ± 1.05 | <0.001 | 2.37 ± 0.70 | 2.98 ± 1.01 | <0.001 |
| TC (mmol/L) | 3.40 ± 0.93 | 3.89 ± 0.82 | <0.001 | 3.36 ± 0.89 | 3.90 ± 0.87 | <0.001 |
| TG (mmol/L) | 1.05 ± 0.27 | 1.18 ± 0.40 | 0.004 | 1.02 ± 0.26 | 1.20 ± 0.38 | 0.004 |
| HDL (mmol/L) | 1.42 ± 0.41 | 1.28 ± 0.30 | 0.002 | 1.44 ± 0.41 | 1.27 ± 0.29 | 0.002 |
| LDL (mmol/L) | 1.85 ± 0.63 | 2.81 ± 1.93 | <0.001 | 1.81 ± 0.56 | 2.78 ± 1.88 | <0.001 |
| HbA1c (%) | 7.63 ± 1.42 | 8.09 ± 1.72 | 0.029 | 7.53 ± 1.36 | 8.18 ± 1.72 | 0.029 |
| FPG (mmol/L) | 7.00 ± 1.80 | 7.73 ± 1.48 | 0.001 | 6.97 ± 1.79 | 7.71 ± 1.53 | 0.001 |
| Unadjusted | Adjusted to Model 1 | Adjusted to Model 2 | ||||
|---|---|---|---|---|---|---|
| Variable | OR (95% CI) |
| OR (95% CI) |
| OR (95% CI) |
|
| Age (years) | 1.03 (1.00, 1.05) | 0.018 | 1.05 (1.01,1.08) | 0.005 | 1.05 (1.02, 1.09) | 0.001 |
| Sex | ||||||
| Male | Reference | |||||
| Female | 1.41 (0.84, 2.39) | 0.194 | ||||
| Smoking | ||||||
| No | Reference | Reference | ||||
| Yes | 2.08 (1.23, 3.57) | 0.006 | 2.08 (1.23, 3.57) | 0.048 | 2.06 (1.02, 4.17) | 0.044 |
| Drinking | ||||||
| No | Reference | |||||
| Yes | 1.65 (0.99, 2.77) | 0.056 | ||||
| Hypertension | ||||||
| No | Reference | |||||
| Yes | 1.65 (0.94, 2.95) | 0.084 | ||||
| Diabetes | ||||||
| No | Reference | Reference | ||||
| Yes | 1.97 (1.15, 3.39) | 0.014 | 1.98 (0.94, 4.17) | 0.073 | 2.10 (1.01, 4.34) | 0.046 |
| Dyslipidemia | ||||||
| No | Reference | |||||
| Yes | 1.06 (0.59, 1.89) | 0.855 | ||||
| Cerebral infarction | ||||||
| No | Reference | |||||
| Yes | 1.17 (0.59, 2.30) | 0.645 | ||||
| Coronary heart disease | ||||||
| No | Reference | |||||
| Yes | 1.40 (0.72, 2.73) | 0.320 | ||||
| Atrial fibrillation | ||||||
| No | Reference | |||||
| Yes | 1.40 (0.78, 2.53) | 0.258 | ||||
| History of antiplatelet drugs | ||||||
| No | Reference | |||||
| Yes | 1.43 (0.82, 2.50) | 0.210 | ||||
| History of anticoagulant drugs | ||||||
| No | Reference | |||||
| Yes | 0.94 (0.35, 2.34) | 0.890 | ||||
| History of antihypertensive drug | ||||||
| No | Reference | |||||
| Yes | 1.48 (0.87, 2.53) | 0.147 | ||||
| History of statin drugs | ||||||
| No | Reference | |||||
| Yes | 1.37 (0.79, 2.36) | 0.262 | ||||
| History of hypoglycemic drugs | ||||||
| No | Reference | |||||
| Yes | 1.35 (0.75, 2.42) | 0.313 | ||||
| SBP | 1.02 (1.01, 1.04) | <0.001 | 1.02 (1.00, 1.03) | 0.053 | 1.02 (1.00, 1.03) | 0.028 |
| DBP | 1.02 (1.00, 1.03) | 0.035 | 1.02 (1.00, 1.04) | 0.020 | 1.03 (1.01, 1.04) | 0.007 |
| DNT (min) | 1.02 (1.00, 1.03) | 0.008 | 1.01 (0.99, 1.03) | 0.252 | ||
| PLT (109/L) | 1.00 (1.00, 1.01) | 0.583 | ||||
| INR | 0.18 (0.05, 0.68) | 0.011 | 0.34 (0.06, 1.80) | 0.203 | ||
| Fg (g/L) | 2.05 (1.48, 2.85) | <0.001 | 1.15 (0.76, 1.76) | 0.510 | ||
| TC (mmol/L) | 1.87 (1.37, 2.55) | <0.001 | 1.36 (0.87, 2.13) | 0.185 | ||
| TG (mmol/L) | 3.54 (1.55, 8.05) | 0.003 | 4.57 (1.44, 14.44) | 0.010 | 5.70 (1.89, 17.20) | 0.002 |
| HDL (mmol/L) | 0.33 (0.16, 0.71) | 0.004 | 0.36 (0.13, 1.00) | 0.049 | 0.31 (0.12, 0.82) | 0.018 |
| LDL (mmol/L) | 2.07 (1.47, 2.91) | <0.001 | 1.70 (1.15, 2.52) | 0.008 | 2.00 (1.33, 3.02) | 0.001 |
| HbA1c (%) | 1.21 (1.02, 1.43) | 0.025 | 1.11 (0.90, 1.37) | 0.323 | ||
| FPG (mmol/L) | 1.30 (1.11, 1.52) | 0.001 | 1.22 (0.98, 1.51) | 0.072 | 1.31 (1.08, 1.60) | 0.007 |
| Unadjusted | Adjusted to Model 1 | Adjusted to Model 2 | ||||
|---|---|---|---|---|---|---|
| Variable | OR (95% CI) |
| OR (95% CI) |
| OR (95% CI) |
|
| Age (years) | 1.03 (1.00, 1.05) | 0.020 | 1.05 (1.01, 1.09) | 0.008 | 1.06 (1.02, 1.09) | 0.002 |
| Sex | ||||||
| Male | Reference | |||||
| Female | 1.18 (0.70, 1.98) | 0.528 | ||||
| Smoking | ||||||
| No | Reference | Reference | ||||
| Yes | 2.50 (1.48, 4.28) | 0.001 | 2.86 (0.97, 8.44) | 0.057 | 2.96 (1.40, 6.26) | 0.004 |
| Drinking | ||||||
| No | Reference | Reference | ||||
| Yes | 2.14 (1.28, 3.59) | 0.004 | 1.00 (0.35, 2.90) | 0.997 | ||
| Hypertension | ||||||
| No | Reference | Reference | ||||
| Yes | 2.03 (1.16, 3.64) | 0.013 | 1.11 (0.43, 2.87) | 0.826 | ||
| Diabetes | ||||||
| No | Reference | Reference | ||||
| Yes | 2.09 (1.22, 3.60) | 0.007 | 3.01 (1.23, 7.36) | 0.016 | 3.04 (1.37, 6.78) | 0.006 |
| Dyslipidemia | ||||||
| No | Reference | |||||
| Yes | 1.21 (0.68, 2.16) | 0.508 | ||||
| Cerebral infarction | ||||||
| No | Reference | |||||
| Yes | 1.23 (0.63, 2.41) | 0.541 | ||||
| Coronary heart disease | ||||||
| No | Reference | |||||
| Yes | 1.83 (0.94, 3.61) | 0.074 | ||||
| Atrial fibrillation | ||||||
| No | Reference | |||||
| Yes | 1.25 (0.70, 2.25) | 0.448 | ||||
| History of antiplatelet drugs | ||||||
| No | Reference | |||||
| Yes | 1.35 (0.78, 2.35) | 0.287 | ||||
| History of anticoagulant drugs | ||||||
| No | Reference | |||||
| Yes | 1.83 (0.74, 4.70) | 0.194 | ||||
| History of antihypertensive drug | ||||||
| No | Reference | |||||
| Yes | 1.42 (0.84, 2.40) | 0.190 | ||||
| History of statin drugs | ||||||
| No | Reference | |||||
| Yes | 1.28 (0.74, 2.19) | 0.379 | ||||
| History of hypoglycemic drugs | ||||||
| No | Reference | |||||
| Yes | 1.43 (0.80, 2.56) | 0.225 | ||||
| SBP | 1.02 (1.01, 1.03) | 0.003 | 1.01 (0.99, 1.03) | 0.262 | ||
| DBP | 1.02 (1.01, 1.04) | 0.006 | 1.03 (1.01, 1.06) | 0.003 | 1.03 (1.01, 1.05) | 0.001 |
| DNT (min) | 1.02 (1.00, 1.03) | 0.013 | 1.01 (0.98, 1.03) | 0.651 | ||
| PLT (109/L) | 1.00 (1.00, 1.01) | 0.571 | ||||
| INR | 0.18 (0.05, 0.66) | 0.009 | 0.38 (0.08, 1.90) | 0.241 | ||
| Fg (g/L) | 2.43 (1.71, 3.47) | <0.001 | 1.47 (0.91, 2.40) | 0.119 | ||
| TC (mmol/L) | 2.04 (1.48, 2.80) | <0.001 | 1.62 (0.97, 2.71) | 0.065 | ||
| TG (mmol/L) | 6.27 (2.58, 15.22) | <0.001 | 16.16 (4.01, 65.17) | <0.001 | 15.91 (4.24, 59.66) | <0.001 |
| HDL (mmol/L) | 0.28 (0.13, 0.59) | <0.001 | 0.27 (0.09, 0.85) | 0.025 | 0.24 (0.08, 0.68) | 0.007 |
| LDL (mmol/L) | 2.30 (1.58, 3.35) | <0.001 | 1.85 (1.14, 3.01) | 0.013 | 2.70 (1.58, 4.61) | <0.001 |
| HbA1c (%) | 1.32 (1.11, 1.57) | 0.001 | 1.32 (1.03, 1.68) | 0.027 | 1.32 (1.05, 1.66) | 0.018 |
| FPG (mmol/L) | 1.30 (1.11, 1.52) | 0.001 | 1.26 (1.00, 1.60) | 0.051 | 1.34 (1.08, 1.66) | 0.007 |
- —The Third People’s Hospital of Chengdu Scientific Research Project
Peer Reviews
No public reviews on file for this paper yet. If you reviewed it on a platform where reviews are public (OpenReview, ICLR, NeurIPS, ICML), you can paste yours below so the community can read it here.
Videos
No videos yet. Explain this paper in a talk, walkthrough, or lecture? Add one.
Taxonomy
TopicsAcute Ischemic Stroke Management · Nutrition and Health in Aging · Blood properties and coagulation
Introduction
1
Ischemic stroke (IS), one of the leading global causes of disability and mortality, has consistently been a major research focus in neuroscience and public health concerning its epidemiological characteristics and risk factor management (1–3). Epidemiological data indicate that IS incidence is associated with demographic factors such as age, sex, ethnicity, and socioeconomic status, with men affected more often than women and over 60% of cases occurring in Asian populations (2, 4).
Dyslipidemia is a critical contributor to IS risk, primarily through the promotion of atherosclerosis (5–7). Conversely, HDL exerts protective effects by facilitating reverse cholesterol transport and reducing inflammation, with each 1 mmol/L increase associated with a 15–20% reduction in risk (6, 7). Furthermore, elevated triglycerides (TG) are associated with an increase in remnant lipoprotein particles and may contribute to a higher risk of IS through prothrombotic effects (8).
Despite the well-established role of statins in reducing LDL levels and preventing recurrent IS, lipid management faces significant challenges globally (9–11). Intravenous alteplase (rt-PA) is the standard therapy for AIS within 4.5 h of symptom onset, working by activating plasminogen and dissolving fibrin clots (12, 13). Clinical trials have shown that thrombolysis significantly improves the chance of achieving mRS ≤2 at 90 days compared to non-thrombolyzed patients (OR = 2.5–3.5) (14, 15). However, the rate of vascular re-occlusion post-thrombolysis is notably high, ranging from 14 to 34%, primarily associated with persistent in-situ thrombosis and local hypercoagulability (16). The efficacy and safety of thrombolytic therapy are highly dependent on the treatment time window (within 4.5 h of onset) and individual patient characteristics, including lipid levels, thrombus burden, comorbidities and the type and dosage of the thrombolytic agent used (17, 18). In recent years, clinical studies have focused on optimizing the efficacy and predicting outcomes of intravenous alteplase thrombolysis. However, the impact of glycemic and lipid abnormalities on post-thrombolysis neurological recovery remains controversial. This study aimed to evaluate whether admission glucose and lipid profiles independently predict functional outcomes following intravenous thrombolysis in AIS patients.
Methods
2
Study population
2.1
This retrospective cohort included 286 AIS patients treated with intravenous alteplase at a tertiary hospital in Chengdu from September 2023 to March 2025. All participants underwent comprehensive lipid and glucose profiling along with mRS assessment. Inclusion criteria: (1) AIS diagnosis per 2014 Chinese Guidelines with CT/MRI confirmation; (2) first-ever stroke; (3) thrombolysis within 4.5 h of onset; (4) age≥18 years. Exclusion criteria: (1) major psychiatric disorders; (2) severe metabolic/endocrine disease; (3) significant heart/kidney/liver dysfunction; (4) lack of informed consent. To ensure the reliability of the results, we removed all unclear or missing data. In strict accordance with the exclusion criteria, we excluded 39 patients. Patients selection methodology appeared in Figure 1. Ethics approval was obtained (Approval No. 2024-S-154) and all participants provided written consent.
Research flowchart of the study.
Data collection
2.2
Clinical baseline data
2.2.1
Clinical data: sex, age, SBP, DBP, smoking (≥1 cigarette/day for ≥1 year), alcohol use (≥100 mL/day, alcohol ≥50%, ≥1 year), history of hypertension, diabetes, dyslipidemia, stroke, coronary heart disease, atrial fibrillation, prior medications (antiplatelets, anticoagulants, antihypertensives, statins, hypoglycemics), pre-thrombolysis the modified Rankin scale (mRS), and door-to-needle time (DNT).
Laboratory data
2.2.2
Laboratory data: platelet count (PLT), international normalized ratio (INR), fibrinogen (Fg), TC: total cholesterol (TC), total triglycerides (TG), high-density lipoprotein cholesterol (HDL), low-density lipoprotein cholesterol (LDL), haemoglobin A1c (HbA1c) and fasting plasma glucose (FPG).
Definition of outcome variables
2.3
The mRS scores were assessed by two independent neurosurgeons. Functional outcomes were assessed using the mRS (range 0–6) at baseline, 30 days, and 90 days after thrombolysis. Good outcome was defined as mRS 0–2, poor outcome as mRS 3–6 (19). The definitions of the mRS grades are provided in Supplementary Table S1.
Measurements of exposure variable (TC, TG, LDL, HDL, HbA1c and FPG)
2.4
Fasting venous blood (3 mL) were collected on admission day, centrifuged at 3,000 rpm for 15 min, and analyzed using the Mindray BS-2800M automated biochemistry analyzers.
Statistical analysis
2.5
Data were processed using R software (version 4.4.3), and “dplyr,” “rms,” “pROC,” and “rmda” were employed. Continuous variables were expressed as mean ± SD or median (IQR) and compared via t-test or Mann–Whitney U test. Categorical variables are expressed as number and percentage (n, %) and compared using χ^2^ test. Significant variables (p < 0.05) from univariate analysis were entered into multivariable logistic regression using backward stepwise selection, retaining only variables with p < 0.05 in the final model. Model performance was evaluated using ROC (AUC), calibration (1,000 bootstrap resamples), and decision curve analysis (DCA). Odds ratios (OR) with 95% confidence intervals (CI) were calculated, and a p-value <0.05 was considered statistically significant.
Results
3
Baseline characteristics
3.1
A total of 247 AIS patients were analyzed (151 male, 96 female; mean age 70.98 ± 11.53 years). Histories of smoking (44.24%), drinking (44.53%), hypertension (69.23%), diabetes (33.60%), dyslipidemia (25.91%), prior stroke (17.00%), coronary heart disease (17.41%), and atrial fibrillation (24.70%) were recorded. Medication use and lab results were shown in Table 1.
Analysis of different functional outcome groups at 30 days and 90 days after intravenous thrombolysis
3.2
At 30 days post-thrombolysis, 149 patients had good outcomes and 98 had poor outcomes. At 90 days, 140 patients were classified as good outcome and 107 as poor outcome. Age, smoking, diabetes, SBP, DBP, DNT, INR, Fg, TC, TG, HDL, LDL, HbA1c and FPG were significantly different between two groups (all p < 0.05). Details were shown in Table 2.
Risk factors and multiple logistic regression models of 30 days after intravenous thrombolysis
3.3
As shown in Table 3, univariate logistic regression analysis showed age, smoking, diabetes, SBP, DBP, DNT, INR, Fg, TC, TG, HDL, LDL, HbA1c and FPG were significant influencing factors (all p < 0.05). The results of multivariate logistic regression model was showed in Model 1, and the model parameter table was shown in Supplementary Table S2A. To refine the predictive model, optimized model (Model 2) using backward stepwise regression also showed age (OR: 1.05, 95% CI: 1.02–1.09, p = 0.001), smoking (OR: 2.06, 95% CI: 1.02–4.17, p = 0.044), diabetes (OR: 2.10, 95% CI: 1.01–4.34, p = 0.046), SBP (OR: 1.02, 95% CI: 1.00–1.03, p = 0.028), DBP (OR: 1.03, 95% CI: 1.01–1.04, p = 0.007), TG (OR: 5.70, 95% CI: 1.89–17.20, p = 0.002), HDL (OR: 0.31, 95% CI: 0.12–0.82, p = 0.018), LDL (OR: 2.00, 95% CI: 1.33–3.02, p = 0.001) and FPG (OR: 1.31, 95% CI: 1.08–1.60, p = 0.007) were significant influencing factors of outcome of 30 days after intravenous thrombolysis. The model parameter table of Model 2 was shown in Supplementary Table S2B.
Risk factors and multiple logistic regression models of 90 days after intravenous thrombolysis
3.4
Multivariate logistic regression model of 90 days was shown in Table 4, and the model parameter table was shown in Supplementary Table S3A. The optimized model showed age (OR: 1.06, 95% CI: 1.02–1.09, p = 0.002), smoking (OR: 2.96, 95% CI: 1.40–6.26, p = 0.004), diabetes (OR: 3.04, 95% CI: 1.37–6.78, p = 0.006), SBP (OR: 1.03, 95% CI: 1.01–1.05, p = 0.001). TG (OR: 15.91, 95% CI: 4.24–59.66, p < 0.001), HDL (OR: 0.24, 95% CI: 0.08–0.68, p = 0.007), LDL (OR: 2.70, 95% CI: 1.58–4.61, p < 0.001), HbA1c (OR: 1.32, 95% CI: 1.05–1.66, p = 0.018) and FPG (OR: 1.34, 95% CI: 1.08–1.66, p = 0.007) were significant influencing factors of outcome of 90 days after intravenous thrombolysis. The model parameter table of Model 2 was shown in Supplementary Table S3B.
Nomogram for predicting prognosis after intravenous thrombolysis
3.5
This research developed a nomogram by integrating factors assessed at both 30 day and 90 day time points (Figure 2). A VIF value more than 10 or a TOL less than 0.1 indicate multicollinearity. The final model demonstrated no significant multicollinearity among the variables (Supplementary Table S4). The result showed higher age, smoking, diabetes, elevated SBP/DBP, increased TC, low HDL, elevated LDL, high HbA1c, and high FPG were risk factors of prognosis after intravenous thrombolysis. When using the nomogram to predict prognosis after intravenous thrombolysis in stroke patients, doctors can place on the corresponding axes based on the patient’s risk factors. The assigned scores from each factor were summed to obtain a total score. A higher total score indicated a greater risk of poor functional outcome. For management, it can aid in rapidly stratifying risk and prioritizing monitoring or intervention for high risk patients.
The nomogram for predicting prognosis after intravenous thrombolysis. (Scores were obtained from each scale according to patient-specific indicators, with total scores corresponding to predicted probabilities after summation. Higher total scores indicated greater poor functional outcome risk).
Evaluation of nomogram for predicting prognosis after intravenous thrombolysis
3.6
We evaluated this nomogram at two distinct time points, the nomogram achieved a strong discriminatory ability. Hosmer–Lemeshow goodness-of-fit test showed 30 days nomogram’s χ^2^ = 7.939, p = 0.439; 90 days nomogram’s χ^2^ = 6.554, p = 0.5851. At 30 days after intravenous thrombolysis, the AUC of 0.821 (95% CI: 0.765–0.877) (Figure 3A), the optimal cutoff value was −0.007, with the maximum Youden index of 0.496, yielding a sensitivity of 88.0% and a specificity of 61.6% for prediction; At 90 days after intravenous thrombolysis, the AUC of 0.871 (95% CI: 0.824–0.919) (Figure 3B), the optimal cutoff value was 0.209, with the maximum Youden index of 0.620, yielding a sensitivity of 92.5% and a specificity of 69.5% for prediction. This study employed bootstrap calibration curves (1,000 replicates) to quantify prediction-actuality deviations. The solid line indicates model outputs, contrasting with the ideal-fit diagonal dashed line. Closer convergence between these lines indicated enhanced predictive accuracy. As shown in Figure 4, the absolute error between the simulated and actual curves were all 0.04, indicating good agreement between predicted and observed outcomes. DCA demonstrated the nomogram’s outperformance of both “treat-all” and “treat-none” approaches throughout the threshold probability spectrum (5–100%), justifying its clinical utility (Figure 5).
ROC curve of the nomogram for predicting prognosis after intravenous thrombolysis. (A) 30 days; (B) 90 days. (30 days nomogram’s AUC was 0.821, 95% CI: 0.765–0.877; 90 days nomogram’s AUC was 0.871, 95% CI: 0.824–0.919. AUC over 0.7 indicating that the model possesses a relatively good discriminatory ability and accuracy).
The calibration curve of the nomogram for predicting prognosis after intravenous thrombolysis. (A) 30 days; (B) 90 days. (The calibration curve was constructed using 1,000 bootstrap repetitions. The diagonal dashed line represents the ideal case of perfect prediction, while the solid line indicates the actual performance of our model. Closer agreement between the two lines signifies better predictive accuracy).
The decision curve of the nomogram for predicting prognosis after intravenous thrombolysis. (A) 30 days; (B) 90 days. (Nomograms offered a greater net benefit compared to both the “treat-all” and “treat-none” approaches over a threshold probability range from 5 to 100%, confirming its clinical utility in routine practice).
Linear association between predictive factors and prognosis after intravenous thrombolysis
3.7
We used restricted cubic spline (RCS) analysis to better demonstrate the relationship between predictive factors (TC, HDL, LDL, HbA1c, FBG) and prognosis at 30 days (Supplementary Figures S1A–E) and at 90 days (Supplementary Figures S2A–E), and observed significant linear correlations between the predictors and poor functional outcome. We conducted threshold effect analysis and found inflection points (TC was 1.05, HDL was 1.29, LDL was 1.96, HbA1c was 7.70, FBG was 7.22). Observations indicated that when TC, LDL, HbA1c, FBG was below the inflection point, the risk of poor functional outcome was lower, when TC, LDL, HbA1c, FBG exceeded the inflection point, the risk increases rapidly. However, poor functional outcome risk remained high below this threshold but reduced significantly when HDL exceeded 1.29.
Discussion
4
Alteplase intravenous thrombolysis is the cornerstone of ultra-early treatment for AIS, significantly improving patient outcomes by rapidly restoring blood flow (20, 21). However, approximately 20–40% of patients still experience poor outcomes despite receiving thrombolytic therapy, including worsening neurological deficits or death, as their prognosis is influenced by multiple factors (22). This study identified glucose metabolism abnormalities, lipid levels, age, smoking, and blood pressure as independent risk factors affecting prognosis, a finding that closely aligns with conclusions from previous research.
Glucose metabolism (FPG, HbA1c, diabetes) affects the prognosis of thrombolytic therapy in stroke patients
4.1
Vakilipour et al. (23) found that the mean levels of FPG were higher than normal in stroke patients. Ding et al. (24) found that FPG level was significantly higher in the poor functional outcome group (mRS ≥2) compared to the favorable outcome group (6.33 vs. 5.10 mmol/L, p = 0.001). These result further confirmed that abnormal glucose metabolism was an independent risk factor. The relationship between glucose metabolism and IS involves several potential mechanisms: (1) Stress hyperglycemia: Abnormal neuroendocrine regulatory mechanisms trigger a stress response, leading to increased hepatic glucose production and/or insulin resistance. Furthermore, a history of chronic hyperglycemia/diabetes may reduce the body’s sensitivity to the neuroendocrine system, thereby exerting an additional influence on the relationship between blood glucose and stroke outcomes (25, 26). (2) Exacerbation of ischemic injury: Hyperglycemia activates the NLRP3 inflammasome, promoting the release of pro-inflammatory cytokines such as IL-1β and TNF-α, which aggravates oxidative stress and inflammation-related responses, thereby worsening neuronal death in the ischemic penumbra (27, 28). (3) Blood–brain barrier disruption: Hyperglycemia leads to disruption of the blood–brain barrier, further increasing the risk of cerebral edema (29).
Furthermore, previous studies have found HbA1c was associated with poor outcomes after thrombolytic therapy in stroke patients (30, 31). HbA1c is the product formed by the binding of haemoglobin in red blood cells to glucose in the blood. HbA1c modulates oxidative reactions in the body. Excessively high levels of HbA1c reduce the conversion rate of oxyhemoglobin, impair haemoglobin’s oxygen-carrying capacity, and lead to histotoxic hypoxia (32–34).
Dyslipidemia (LDL, HDL, TG) affects the prognosis of thrombolytic therapy in stroke patients
4.2
Amarenco et al. (35) and Xu et al. (36) also found LDL levels were associated with prognosis of stroke patients. Rajabpour et al. (37) also found an increase in LDL-c levels and a decrease in HDL-c levels in stroke patients. LDL exacerbates neurological deterioration after thrombolysis by promoting the rupture of atherosclerotic plaques and activating the inflammasome, such as interleukin-1β (IL-1β) and interleukin-6 (IL-6) (5). HDL influences outcomes after intravenous alteplase thrombolysis through multiple mechanisms. Studies indicate that HDL enhances blood–brain barrier (BBB) integrity via the SR-BI receptor-dependent pathway, reducing the risk of hemorrhagic transformation post-thrombolysis (38). Furthermore, HDL improves neurological recovery after thrombolysis by promoting cholesterol reverse transport and exerting anti-inflammatory effects. However, this protective effect is attenuated in patients with comorbid diabetes or chronic kidney disease (39). TG significantly increases the risk of poor outcomes in IS patients through multiple pathways (40, 41): it promotes atherosclerotic plaque formation, increases blood viscosity, triggers inflammatory responses, and induces endothelial cell apoptosis by activating the NLRP3 inflammasome; it also inhibits fibrinolytic system function, thereby predisposing to thrombosis (42).
Age affects the prognosis of thrombolytic therapy in stroke patients
4.3
A Chinese study demonstrated that patients over 80 years old who received thrombolysis had a 12.6% higher proportion achieving an mRS score of 0–2 at 90 days compared to the non-thrombolysis group, but also carried a 3.22-fold increased risk of symptomatic intracranial hemorrhage (sICH) (43). This aligns with European and American studies confirming higher sICH incidence after thrombolysis in elderly patients (22). This may be attributed to: (1) Reperfusion efficiency: Younger patients exhibit superior collateral circulation, resulting in significantly higher recanalization rates following thrombolysis (18% improvement vs. elderly patients; p = 0.003) (44). (2) Biological vulnerabilities: Advanced age is associated with microbleeds and leukoaraiosis, pathologies that compromise blood–brain barrier integrity and heighten susceptibility to hemorrhage.
Smoking affects the prognosis of thrombolytic therapy in stroke patients
4.4
Smoking was associated with poor functional outcomes in ischemic stroke patients receiving alteplase thrombolysis (45). Liu et al. (46) found that smokers had an 80% higher risk of an mRS score >2 at 90 days compared to non-smokers. Smoking induces systemic inflammation by mobilizing neutrophils and monocytes, thereby exacerbating post-ischemic neuroinflammation and promoting infarct expansion (47). Moreover, animal experiments showed that: chronic nicotine exposure (simulated smoking) reduced hematoma expansion after spontaneous sICH through red blood cell-derived particles (RMPs) (26% reduction in males and 31% reduction in females), and the effect was sustained for 4.5 h after sICH (48).
Blood pressure affects the prognosis of thrombolytic therapy in stroke patients
4.5
Retrospective analyses have demonstrated a graded relationship between systolic blood pressure and the likelihood of hemorrhagic transformation, with SBP values exceeding 170 mmHg conferring an approximately fourfold increase in risk relative to the 141–150 mmHg reference range (49). A 2021 meta-analysis of 5,874 patients identified a mean 24-h SBP >160 mmHg following endovascular thrombectomy (EVT) as an independent risk predictor of poorer outcomes (50). Mechanistically, (1) acute increased blood pressure exacerbates cerebrovascular dysregulation, thereby promoting cerebral edema and hemorrhagic transformation (51); (2) acute blood pressure fluctuations compromise cerebral perfusion within the ischemic penumbra (52), while after stroke, vascular regulation ability is impaired, and systemic blood pressure further affects CBF within the penumbra (53).
However, this study had the following limitations: (1) Single-center retrospective design: The sample was derived from a single institution’s clinical database, which may introduce selection bias (e.g., regional, ethnic, or treatment protocol variations). Furthermore, the retrospective design limits comprehensive control of confounding factors (e.g., dynamic changes in patient lifestyles and comorbidities), potentially affecting the accuracy of prognostic factor analysis. These factors restricted the generalisability of the findings, and external validation in multi-centre prospective cohorts is essential before any clinical application. (2) Limited sample size: The inclusion of 284 patients represents a relatively small cohort, which may reduce statistical power. (3) Limited factors: This study only incorporated routine clinical indicators (e.g., glucose metabolism, lipid profiles, age) while omitting inflammatory markers (e.g., IL-6, TNF-α), genetic variants (e.g., NINJ2 gene), and neuroimaging features (e.g., infarct core volume); (4) No stratified analysis was performed: the original data did not included TOAST criteria or details on vascular occlusion, making it impossible to investigate whether differences exist based on etiology. To address these limitations, future studies should focus on the following: (1) Prospective multicenter investigations: Expand sample sizes and establish multicenter cohorts to validate the reliability of current findings. (2) Stratified analysis: Based on the TOAST criteria or the occluded vessel, to investigate whether glucose-lipid effects differ across etiologies. (3) Mechanistic exploration: Conduct basic science experiments to elucidate the molecular mechanisms through which dysregulated glucose/lipid metabolism affects reperfusion efficacy, and identify potential therapeutic targets. (4) Personalized intervention strategies: Develop tiered thrombolysis protocols (e.g., combined antiplatelet therapy or endovascular interventions) based on risk stratification models, and establish precision treatment pathways for high-risk populations.
Conclusion
5
This study developed and validated a predictive model based on glucose and lipid profiles using clinical data from 247 stroke patients who underwent intravenous thrombolysis. The model demonstrated strong and consistent predictive performance at both 30 and 90 days, confirming its reliability and clinical utility. By identifying key metabolic and vascular risk factors, this tool enables clinicians to recognize patients at high risk of poor outcomes and supports risk-stratified management strategies. Future studies involving external validation are warranted to confirm its generalizability across diverse populations and clinical settings.
The reference list from the paper itself. Each links out to its DOI / PubMed record.
- 1GBD 2021 Stroke Risk Factor Collaborators. Global, regional, and national burden of stroke and its risk factors, 1990–2021: a systematic analysis for the Global Burden of Disease Study 2021. Lancet Neurol. (2024) 23:973–1003. doi: 10.1016/S 1474-4422(24)00369-739304265 PMC 12254192 · doi ↗ · pubmed ↗
- 2Reina SA Llabre MM Allison MA Wilkins JT Mendez AJ Arnan MK . HDL cholesterol and stroke risk: the multi-ethnic study of atherosclerosis. Atherosclerosis. (2015) 243:314–9. doi: 10.1016/j.atherosclerosis.2015.09.031, 26425994 PMC 4609625 · doi ↗ · pubmed ↗
- 3Oliveira LC Ponciano A Tuozzo C Viswanathan A Rost NS Etherton MR. Poststroke disability: association between sex and patient-reported outcomes. Stroke. (2023) 54:345–53. doi: 10.1161/STROKEAHA.122.041502, 36689580 · doi ↗ · pubmed ↗
- 4Dai L Xu J Zhang Y Wang A Chen Z Mo J . Cumulative burden of lipid profiles predict future incidence of ischaemic stroke and residual risk. Stroke Vasc Neurol. (2021) 6:581–8. doi: 10.1136/svn-2020-000726, 33827914 PMC 8717800 · doi ↗ · pubmed ↗
- 5Verma S Mazer CD Connelly KA. Inflammation and cholesterol at the crossroads of vascular risk. Cell Metab. (2023) 35:1095–8. doi: 10.1016/j.cmet.2023.06.011, 37437543 · doi ↗ · pubmed ↗
- 6Freiberg JJ Tybjaerg-Hansen A Jensen JS Nordestgaard BG. Nonfasting triglycerides and risk of ischemic stroke in the general population. JAMA. (2008) 300:2142–52. doi: 10.1001/jama.2008.621, 19001625 · doi ↗ · pubmed ↗
- 7Wang Y Jing J Meng X Pan Y Wang Y Zhao X . The Third China National Stroke Registry (CNSR-III) for patients with acute ischaemic stroke or transient ischaemic attack: design, rationale and baseline patient characteristics. Stroke Vasc Neurol. (2019) 4:158–64. doi: 10.1136/svn-2019-000242, 31709123 PMC 6812638 · doi ↗ · pubmed ↗
- 8Niu H Wang Y Yang N Chu M Mao X Wang D . Elevated remnant cholesterol improves the prognosis of patients with ischemic stroke and malnutrition: a cohort-based study. Stroke. (2025) 56:2057–67. doi: 10.1161/STROKEAHA.124.048785, 40326332 · doi ↗ · pubmed ↗