Characteristics and Prognosis of Early‐Onset vs. Late‐Onset Colon Cancer: A Propensity Score Matching Analysis Based on Histology
Xiaobin Cheng, Tao Xiang, Saisai Wang, Jinhai Wang

TL;DR
This study compares the prognosis of early-onset and late-onset colon cancer, showing that age and histology together influence survival outcomes.
Contribution
The study introduces a novel approach combining age at diagnosis and histology to assess colon cancer prognosis.
Findings
Early-onset adenocarcinoma had the best cancer-specific and surgery-specific survival.
Late-onset mucinous adenocarcinoma showed the worst survival outcomes.
Nonmetastatic early-onset adenocarcinoma had poorer surgery-specific survival than late-onset adenocarcinoma.
Abstract
The prognostic value of age at diagnosis in colon cancer is poorly understood. This study evaluated the influence of age at diagnosis and histologic subtype on colon cancer prognosis using data from 180,804 patients in the SEER database. Patients were stratified into early‐onset and late‐onset groups and by histology—adenocarcinoma or mucinous adenocarcinoma. Early‐onset colon cancer was associated with more advanced tumor stages. Propensity score matching balanced cohorts for Kaplan–Meier and Cox regression analyses of cancer‐specific survival (CSS) and surgery‐specific survival (SSS). Survival analyses revealed that patients with early‐onset adenocarcinoma had the most favorable CSS and SSS, whereas those with late‐onset mucinous adenocarcinoma experienced the worst outcomes; no significant age‐related differences emerged histology‐stratified. Importantly, among nonmetastatic…
Genes, proteins, chemicals, diseases, species, mutations and cell lines named across the full text — each resolved to its canonical identifier and authoritative record.
Click any figure to enlarge with its caption.
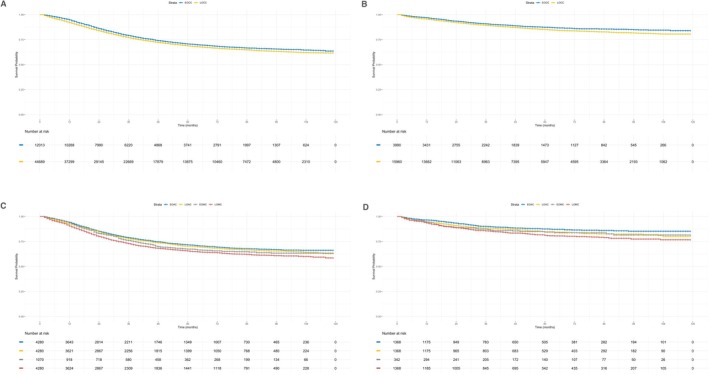 FIGURE 1
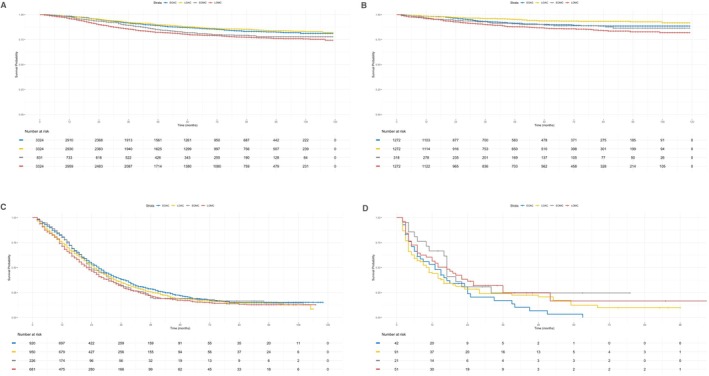 FIGURE 2
| Characteristics | EOAC | LOAC | EOMC | LOMC | Overall |
|
|---|---|---|---|---|---|---|
| ( | ( | ( | ( | ( | ||
| Sex | ||||||
| Female | 7,783 (49.0%) | 73,909 (49.5%) | 616 (40.6%) | 7,518 (52.9%) | 89,826 (49.7%) | < 0.001 |
| Male | 8,101 (51.0%) | 75,292 (50.5%) | 902 (59.4%) | 6,683 (47.1%) | 90,978 (50.3%) | |
| Race | ||||||
| Black | 2,472 (15.6%) | 17,920 (12.0%) | 235 (15.5%) | 1,459 (10.3%) | 22,086 (12.2%) | < 0.001 |
| Others | 1,939 (12.2%) | 14,257 (9.6%) | 155 (10.2%) | 992 (7.0%) | 17,343 (9.6%) | |
| White | 11,278 (71.0%) | 115,870 (77.7%) | 1,111 (73.2%) | 11,694 (82.3%) | 139,953 (77.4%) | |
| Missing | 195 (1.2%) | 1,154 (0.8%) | 17 (1.1%) | 56 (0.4%) | 1,422 (0.8%) | |
| Marital status | ||||||
| Married | 8,553 (53.8%) | 73,848 (49.5%) | 776 (51.1%) | 6,924 (48.8%) | 90,101 (49.8%) | < 0.001 |
| Unmarried | 6,489 (40.9%) | 65,978 (44.2%) | 659 (43.4%) | 6,542 (46.1%) | 79,668 (44.1%) | |
| Missing | 842 (5.3%) | 9,375 (6.3%) | 83 (5.5%) | 735 (5.2%) | 11,035 (6.1%) | |
| Primary location | ||||||
| Left | 8,912 (56.1%) | 54,966 (36.8%) | 524 (34.5%) | 3,334 (23.5%) | 67,736 (37.5%) | < 0.001 |
| Right | 6,309 (39.7%) | 87,209 (58.5%) | 907 (59.7%) | 10,104 (71.2%) | 104,529 (57.8%) | |
| Missing | 663 (4.2%) | 7,026 (4.7%) | 87 (5.7%) | 763 (5.4%) | 8,539 (4.7%) | |
| Differentiation | ||||||
| Poor differentiation | 2,530 (15.9%) | 24,086 (16.1%) | 302 (19.9%) | 2,689 (18.9%) | 29,607 (16.4%) | < 0.001 |
| Well differentiation | 10,949 (68.9%) | 103,106 (69.1%) | 1,033 (68.1%) | 10,050 (70.8%) | 125,138 (69.2%) | |
| Missing | 2,405 (15.1%) | 22,009 (14.8%) | 183 (12.1%) | 1,462 (10.3%) | 26,059 (14.4%) | |
| Stage | ||||||
| I | 1,624 (10.2%) | 26,967 (18.1%) | 92 (6.1%) | 1,761 (12.4%) | 30,444 (16.8%) | < 0.001 |
| II | 3,625 (22.8%) | 41,204 (27.6%) | 435 (28.7%) | 5,132 (36.1%) | 50,396 (27.9%) | |
| III | 4,996 (31.5%) | 38,936 (26.1%) | 526 (34.7%) | 4,289 (30.2%) | 48,747 (27.0%) | |
| IV | 5,000 (31.5%) | 32,474 (21.8%) | 440 (29.0%) | 2,718 (19.1%) | 40,632 (22.5%) | |
| Missing | 639 (4.0%) | 9,620 (6.4%) | 25 (1.6%) | 301 (2.1%) | 10,585 (5.9%) | |
| T | ||||||
| T1 | 1,276 (8.0%) | 17,061 (11.4%) | 40 (2.6%) | 676 (4.8%) | 19,053 (10.5%) | < 0.001 |
| T2 | 1,270 (8.0%) | 17,181 (11.5%) | 102 (6.7%) | 1,585 (11.2%) | 20,138 (11.1%) | |
| T3 | 7,697 (48.5%) | 67,960 (45.5%) | 731 (48.2%) | 7,376 (51.9%) | 83,764 (46.3%) | |
| T4 | 3,483 (21.9%) | 25,762 (17.3%) | 531 (35.0%) | 3,630 (25.6%) | 33,406 (18.5%) | |
| Missing | 2,158 (13.6%) | 21,237 (14.2%) | 114 (7.5%) | 934 (6.6%) | 24,443 (13.5%) | |
| N | ||||||
| N0 | 6,811 (42.9%) | 83,065 (55.7%) | 652 (43.0%) | 7,702 (54.2%) | 98,230 (54.3%) | < 0.001 |
| N1 | 4,544 (28.6%) | 35,127 (23.5%) | 451 (29.7%) | 3,433 (24.2%) | 43,555 (24.1%) | |
| N2 | 3,260 (20.5%) | 19,306 (12.9%) | 350 (23.1%) | 2,523 (17.8%) | 25,439 (14.1%) | |
| Missing | 1,269 (8.0%) | 11,703 (7.8%) | 65 (4.3%) | 543 (3.8%) | 13,580 (7.5%) | |
| M | ||||||
| M0 | 10,807 (68.0%) | 115,993 (77.7%) | 1,068 (70.4%) | 11,442 (80.6%) | 139,310 (77.1%) | < 0.001 |
| M1 | 5,016 (31.6%) | 32,568 (21.8%) | 441 (29.1%) | 2,718 (19.1%) | 40,743 (22.5%) | |
| Missing | 61 (0.4%) | 640 (0.4%) | 9 (0.6%) | 41 (0.3%) | 751 (0.4%) | |
| Surgery | ||||||
| No surgery | 2,419 (15.2%) | 24,290 (16.3%) | 134 (8.8%) | 1,118 (7.9%) | 27,961 (15.5%) | < 0.001 |
| Surgery | 13,391 (84.3%) | 124,129 (83.2%) | 1,380 (90.9%) | 13,054 (91.9%) | 151,954 (84.0%) | |
| Missing | 74 (0.5%) | 782 (0.5%) | 4 (0.3%) | 29 (0.2%) | 889 (0.5%) | |
| Surgery/Radiation | ||||||
| No radiation and/or cancer‐directed surgery | 15,481 (97.5%) | 147,379 (98.8%) | 1,489 (98.1%) | 14,017 (98.7%) | 178,366 (98.7%) | < 0.001 |
| Radiation | 403 (2.5%) | 1,822 (1.2%) | 29 (1.9%) | 184 (1.3%) | 2,438 (1.3%) | |
| Surgery/Systemic Therapy | ||||||
| Surgery | 7,458 (47.0%) | 108,121 (72.5%) | 619 (40.8%) | 9,780 (68.9%) | 125,978 (69.7%) | < 0.001 |
| Systemic Therapy | 8,419 (53.0%) | 41,024 (27.5%) | 896 (59.0%) | 4,414 (31.1%) | 54,753 (30.3%) | |
| Missing | 7 (0.0%) | 56 (0.0%) | 3 (0.2%) | 7 (0.0%) | 73 (0.0%) | |
| Median household income | ||||||
| <$55,000 | 2,590 (16.3%) | 27,526 (18.4%) | 248 (16.3%) | 2,424 (17.1%) | 32,788 (18.1%) | < 0.001 |
| <$65,000 | 2,763 (17.4%) | 27,332 (18.3%) | 290 (19.1%) | 2,784 (19.6%) | 33,169 (18.3%) | |
| <$75,000 | 3,769 (23.7%) | 34,347 (23.0%) | 405 (26.7%) | 3,561 (25.1%) | 42,082 (23.3%) | |
| >$75,000 | 6,762 (42.6%) | 59,991 (40.2%) | 575 (37.9%) | 5,432 (38.3%) | 72,760 (40.2%) | |
| Missing | 0 (0%) | 5 (0.0%) | 0 (0%) | 0 (0%) | 5 (0.0%) | |
| Rural–urban distribution | ||||||
| Metropolitan areas | 9,476 (59.7%) | 85,346 (57.2%) | 945 (62.3%) | 8,525 (60.0%) | 104,292 (57.7%) | < 0.001 |
| Intermediate areas | 4,650 (29.3%) | 43,017 (28.8%) | 405 (26.7%) | 3,844 (27.1%) | 51,916 (28.7%) | |
| Nonmetropolitan areas | 1,708 (10.8%) | 20,510 (13.7%) | 165 (10.9%) | 1,816 (12.8%) | 24,199 (13.4%) | |
| Missing | 50 (0.3%) | 328 (0.2%) | 3 (0.2%) | 16 (0.1%) | 397 (0.2%) |
| Characteristics | Before PSM for CSS | After PSM for CSS | Before PSM for SSS | After PSM for SSS | ||||||||
|---|---|---|---|---|---|---|---|---|---|---|---|---|
| EOCC | LOCC |
| EOCC | LOCC |
| EOCC | LOCC |
| EOCC | LOCC |
| |
| ( | ( | ( | ( | ( | ( | ( | ( | |||||
| Sex | ||||||||||||
| Female | 5,839 (48.6%) | 30,265 (47.5%) | 0.067 | 5,839 (48.6%) | 20,682 (46.3%) | < 0.001 | 1,900 (47.6%) | 15,816 (47.3%) | 0.943 | 1,900 (47.6%) | 7,516 (47.1%) | 0.837 |
| Male | 6,174 (51.4%) | 33,517 (52.5%) | 6,174 (51.4%) | 24,007 (53.7%) | 2,090 (52.4%) | 17,599 (52.7%) | 2,090 (52.4%) | 8,444 (52.9%) | ||||
| Race | ||||||||||||
| Black | 1,784 (14.9%) | 8,348 (13.1%) | < 0.001 | 1,784 (14.9%) | 6,647 (14.9%) | 0.993 | 601 (15.1%) | 4,201 (12.6%) | < 0.001 | 601 (15.1%) | 2,339 (14.7%) | 0.928 |
| Others | 1,428 (11.9%) | 6,376 (10.0%) | 1,428 (11.9%) | 5,239 (11.7%) | 494 (12.4%) | 3,346 (10.0%) | 494 (12.4%) | 1,924 (12.1%) | ||||
| White | 8,801 (73.3%) | 49,058 (76.9%) | 8,801 (73.3%) | 32,803 (73.4%) | 2,895 (72.6%) | 25,868 (77.4%) | 2,895 (72.6%) | 11,697 (73.3%) | ||||
| Marital status | ||||||||||||
| Married | 6,966 (58.0%) | 38,312 (60.1%) | < 0.001 | 6,966 (58.0%) | 25,997 (58.2%) | 0.935 | 2,312 (57.9%) | 19,928 (59.6%) | 0.12 | 2,312 (57.9%) | 9,237 (57.9%) | 0.997 |
| Umarried | 5,047 (42.0%) | 25,470 (39.9%) | 5,047 (42.0%) | 18,692 (41.8%) | 1,678 (42.1%) | 13,487 (40.4%) | 1,678 (42.1%) | 6,723 (42.1%) | ||||
| Primary location | ||||||||||||
| Left | 6,699 (55.8%) | 26,668 (41.8%) | < 0.001 | 6,699 (55.8%) | 23,519 (52.6%) | < 0.001 | 2,063 (51.7%) | 13,154 (39.4%) | < 0.001 | 2,063 (51.7%) | 8,290 (51.9%) | 0.964 |
| Right | 5,314 (44.2%) | 37,114 (58.2%) | 5,314 (44.2%) | 21,170 (47.4%) | 1,927 (48.3%) | 20,261 (60.6%) | 1,927 (48.3%) | 7,670 (48.1%) | ||||
| Differentiation | ||||||||||||
| Well differentiation | 9,710 (80.8%) | 52,844 (82.9%) | < 0.001 | 9,710 (80.8%) | 36,605 (81.9%) | 0.0247 | 483 (12.1%) | 4,029 (12.1%) | 0.996 | 483 (12.1%) | 1,821 (11.4%) | 0.47 |
| Poor differentiation | 2,303 (19.2%) | 10,938 (17.1%) | 2,303 (19.2%) | 8,084 (18.1%) | 3,507 (87.9%) | 29,386 (87.9%) | 3,507 (87.9%) | 14,139 (88.6%) | ||||
| Stage | ||||||||||||
| I | 1,243 (10.3%) | 12,377 (19.4%) | < 0.001 | 1,243 (10.3%) | 4,980 (11.1%) | < 0.001 | 1,191 (29.8%) | 12,144 (36.3%) | < 0.001 | 1,191 (29.8%) | 4,794 (30.0%) | 0.999 |
| II | 3,317 (27.6%) | 19,599 (30.7%) | 3,317 (27.6%) | 13,520 (30.3%) | 1,995 (50.0%) | 15,132 (45.3%) | 1,995 (50.0%) | 8,019 (50.2%) | ||||
| III | 4,605 (38.3%) | 21,035 (33.0%) | 4,605 (38.3%) | 16,602 (37.2%) | 604 (15.1%) | 4,440 (13.3%) | 604 (15.1%) | 2,374 (14.9%) | ||||
| IV | 2,848 (23.7%) | 10,771 (16.9%) | 2,848 (23.7%) | 9,587 (21.5%) | 200 (5.0%) | 1,699 (5.1%) | 200 (5.0%) | 773 (4.8%) | ||||
| Median household income | ||||||||||||
| <$55,000 | 2,008 (16.7%) | 12,436 (19.5%) | < 0.001 | 2,008 (16.7%) | 7,749 (17.3%) | 0.649 | 654 (16.4%) | 6,214 (18.6%) | 0.00679 | 654 (16.4%) | 2,574 (16.1%) | 0.986 |
| <$65,000 | 2,141 (17.8%) | 11,872 (18.6%) | 2,141 (17.8%) | 7,926 (17.7%) | 719 (18.0%) | 6,297 (18.8%) | 719 (18.0%) | 2,822 (17.7%) | ||||
| <$75,000 | 2,891 (24.1%) | 14,420 (22.6%) | 2,891 (24.1%) | 10,891 (24.4%) | 1,008 (25.3%) | 7,772 (23.3%) | 1,008 (25.3%) | 4,146 (26.0%) | ||||
| >$75,000 | 4,973 (41.4%) | 25,054 (39.3%) | 4,973 (41.4%) | 18,123 (40.6%) | 1,609 (40.3%) | 13,132 (39.3%) | 1,609 (40.3%) | 6,418 (40.2%) | ||||
| Rural–urban distribution | ||||||||||||
| Metropolitan areas | 7,160 (59.6%) | 36,270 (56.9%) | < 0.001 | 7,160 (59.6%) | 26,572 (59.5%) | 0.581 | 2,454 (61.5%) | 19,214 (57.5%) | < 0.001 | 2,454 (61.5%) | 9,833 (61.6%) | 0.998 |
| Intermediate areas | 3,576 (29.8%) | 18,625 (29.2%) | 3,576 (29.8%) | 13,132 (29.4%) | 1,108 (27.8%) | 9,620 (28.8%) | 1,108 (27.8%) | 4,445 (27.9%) | ||||
| Nonmetropolitan areas | 1,277 (10.6%) | 8,887 (13.9%) | 1,277 (10.6%) | 4,985 (11.2%) | 428 (10.7%) | 4,581 (13.7%) | 428 (10.7%) | 1,682 (10.5%) | ||||
| Characteristics | Before PSM | After PSM | |||||||||
|---|---|---|---|---|---|---|---|---|---|---|---|
| EOAC | LOAC | EOMC | LOMC |
| EOAC | LOAC | EOMC | LOMC |
| ||
| ( | ( | ( | ( | ( | ( | ( | ( | ||||
| Sex | |||||||||||
| Female | 5,420 (49.5%) | 27,639 (47.4%) | 419 (39.2%) | 2,626 (48.5%) | < 0.001 | 1,708 (39.9%) | 1,664 (38.9%) | 419 (39.2%) | 1,758 (41.1%) | 0.334 | |
| Male | 5,523 (50.5%) | 30,730 (52.6%) | 651 (60.8%) | 2,787 (51.5%) | 2,572 (60.1%) | 2,616 (61.1%) | 651 (60.8%) | 2,522 (58.9%) | |||
| Race | |||||||||||
| Black | 1,627 (14.9%) | 7,709 (13.2%) | 157 (14.7%) | 639 (11.8%) | < 0.001 | 616 (14.4%) | 632 (14.8%) | 157 (14.7%) | 553 (12.9%) | 0.047 | |
| Others | 1,314 (12.0%) | 5,957 (10.2%) | 114 (10.7%) | 419 (7.7%) | 404 (9.4%) | 444 (10.4%) | 114 (10.7%) | 381 (8.9%) | |||
| White | 8,002 (73.1%) | 44,703 (76.6%) | 799 (74.7%) | 4,355 (80.5%) | 3,260 (76.2%) | 3,204 (74.9%) | 799 (74.7%) | 3,346 (78.2%) | |||
| Marital status | |||||||||||
| Married | 6,375 (58.3%) | 35,104 (60.1%) | 591 (55.2%) | 3,208 (59.3%) | < 0.001 | 2,385 (55.7%) | 2,383 (55.7%) | 591 (55.2%) | 2,469 (57.7%) | 0.278 | |
| Unmarried | 4,568 (41.7%) | 23,265 (39.9%) | 479 (44.8%) | 2,205 (40.7%) | 1,895 (44.3%) | 1,897 (44.3%) | 479 (44.8%) | 1,811 (42.3%) | |||
| Primary location | |||||||||||
| Left | 6,321 (57.8%) | 25,134 (43.1%) | 378 (35.3%) | 1,534 (28.3%) | < 0.001 | 1,487 (34.7%) | 1,524 (35.6%) | 378 (35.3%) | 1,375 (32.1%) | 0.011 | |
| Right | 4,622 (42.2%) | 33,235 (56.9%) | 692 (64.7%) | 3,879 (71.7%) | 2,793 (65.3%) | 2,756 (64.4%) | 692 (64.7%) | 2,905 (67.9%) | |||
| Differentiation | |||||||||||
| Well differentiation | 8,874 (81.1%) | 48,504 (83.1%) | 836 (78.1%) | 4,340 (80.2%) | < 0.001 | 3,389 (79.2%) | 3,374 (78.8%) | 836 (78.1%) | 3,398 (79.4%) | 0.907 | |
| Poor differentiation | 2,069 (18.9%) | 9,865 (16.9%) | 234 (21.9%) | 1,073 (19.8%) | 891 (20.8%) | 906 (21.2%) | 234 (21.9%) | 882 (20.6%) | |||
| Stage | |||||||||||
| I | 1,172 (10.7%) | 11,687 (20.0%) | 71 (6.6%) | 690 (12.7%) | < 0.001 | 294 (6.9%) | 284 (6.6%) | 71 (6.6%) | 272 (6.4%) | 0.582 | |
| II | 2,972 (27.2%) | 17,688 (30.3%) | 345 (32.2%) | 1,911 (35.3%) | 1,416 (33.1%) | 1,384 (32.3%) | 345 (32.2%) | 1,486 (34.7%) | |||
| III | 4,190 (38.3%) | 19,135 (32.8%) | 415 (38.8%) | 1,900 (35.1%) | 1,604 (37.5%) | 1,667 (38.9%) | 415 (38.8%) | 1,638 (38.3%) | |||
| IV | 2,609 (23.8%) | 9,859 (16.9%) | 239 (22.3%) | 912 (16.8%) | 966 (22.6%) | 945 (22.1%) | 239 (22.3%) | 884 (20.7%) | |||
| Median household income | |||||||||||
| <$55,000 | 1,840 (16.8%) | 11,448 (19.6%) | 168 (15.7%) | 988 (18.3%) | < 0.001 | 687 (16.1%) | 655 (15.3%) | 168 (15.7%) | 702 (16.4%) | 0.817 | |
| <$65,000 | 1,933 (17.7%) | 10,777 (18.5%) | 208 (19.4%) | 1095 (20.2%) | 780 (18.2%) | 815 (19.0%) | 208 (19.4%) | 847 (19.8%) | |||
| <$75,000 | 2,613 (23.9%) | 13,097 (22.4%) | 278 (26.0%) | 1,323 (24.4%) | 1,130 (26.4%) | 1,123 (26.2%) | 278 (26.0%) | 1,131 (26.4%) | |||
| >$75,000 | 4,557 (41.6%) | 23,047 (39.5%) | 416 (38.9%) | 2,007 (37.1%) | 1,683 (39.3%) | 1,687 (39.4%) | 416 (38.9%) | 1,600 (37.4%) | |||
| Rural–urban distribution | |||||||||||
| Metropolitan areas | 6,494 (59.3%) | 33,091 (56.7%) | 666 (62.2%) | 3,179 (58.7%) | < 0.001 | 2,652 (62.0%) | 2,701 (63.1%) | 666 (62.2%) | 2,620 (61.2%) | 0.664 | |
| Intermediate areas | 3,287 (30.0%) | 17,118 (29.3%) | 289 (27.0%) | 1,507 (27.8%) | 1,187 (27.7%) | 1,149 (26.8%) | 289 (27.0%) | 1,174 (27.4%) | |||
| Nonmetropolitan areas | 1,162 (10.6%) | 8,160 (14.0%) | 115 (10.7%) | 727 (13.4%) | 441 (10.3%) | 430 (10.0%) | 115 (10.7%) | 486 (11.4%) | |||
| Characteristics | Before PSM | After PSM | |||||||||
|---|---|---|---|---|---|---|---|---|---|---|---|
| EOAC | LOAC | EOMC | LOMC |
| EOAC | LOAC | EOMC | LOMC |
| ||
| ( | ( | ( | ( | ( | ( | ( | ( | ||||
| Sex | |||||||||||
| Female | 1,770 (48.5%) | 14,494 (47.2%) | 130 (38.0%) | 1,322 (48.4%) | 0.00428 | 525 (38.4%) | 514 (37.6%) | 130 (38.0%) | 527 (38.5%) | 0.989 | |
| Male | 1,878 (51.5%) | 16,187 (52.8%) | 212 (62.0%) | 1,412 (51.6%) | 843 (61.6%) | 854 (62.4%) | 212 (62.0%) | 841 (61.5%) | |||
| Race | |||||||||||
| Black | 545 (14.9%) | 3,891 (12.7%) | 56 (16.4%) | 310 (11.3%) | < 0.001 | 199 (14.5%) | 221 (16.2%) | 56 (16.4%) | 219 (16.0%) | 0.946 | |
| Others | 460 (12.6%) | 3,129 (10.2%) | 34 (9.9%) | 217 (7.9%) | 122 (8.9%) | 125 (9.1%) | 34 (9.9%) | 133 (9.7%) | |||
| White | 2,643 (72.5%) | 23,661 (77.1%) | 252 (73.7%) | 2,207 (80.7%) | 1,047 (76.5%) | 1,022 (74.7%) | 252 (73.7%) | 1,016 (74.3%) | |||
| Marital status | |||||||||||
| Married | 2,138 (58.6%) | 18,361 (59.8%) | 174 (50.9%) | 1,567 (57.3%) | < 0.001 | 677 (49.5%) | 715 (52.3%) | 174 (50.9%) | 720 (52.6%) | 0.512 | |
| Unmarried | 1,510 (41.4%) | 12,320 (40.2%) | 168 (49.1%) | 1,167 (42.7%) | 691 (50.5%) | 653 (47.7%) | 168 (49.1%) | 648 (47.4%) | |||
| Primary location | |||||||||||
| Left | 1,963 (53.8%) | 12,414 (40.5%) | 100 (29.2%) | 740 (27.1%) | < 0.001 | 388 (28.4%) | 384 (28.1%) | 100 (29.2%) | 395 (28.9%) | 0.988 | |
| Right | 1,685 (46.2%) | 18,267 (59.5%) | 242 (70.8%) | 1,994 (72.9%) | 980 (71.6%) | 984 (71.9%) | 242 (70.8%) | 973 (71.1%) | |||
| Differentiation | |||||||||||
| Well differentiation | 3,214 (88.1%) | 27,044 (88.1%) | 293 (85.7%) | 2,342 (85.7%) | 0.00259 | 1,202 (87.9%) | 1,197 (87.5%) | 293 (85.7%) | 1,188 (86.8%) | 0.824 | |
| Poor differentiation | 434 (11.9%) | 3,637 (11.9%) | 49 (14.3%) | 392 (14.3%) | 166 (12.1%) | 171 (12.5%) | 49 (14.3%) | 180 (13.2%) | |||
| Stage | |||||||||||
| I | 1,123 (30.8%) | 11,464 (37.4%) | 68 (19.9%) | 680 (24.9%) | < 0.001 | 288 (21.1%) | 278 (20.3%) | 68 (19.9%) | 267 (19.5%) | 0.873 | |
| II | 1,797 (49.3%) | 13,663 (44.5%) | 198 (57.9%) | 1,469 (53.7%) | 820 (59.9%) | 793 (58.0%) | 198 (57.9%) | 817 (59.7%) | |||
| III | 552 (15.1%) | 4,040 (13.2%) | 52 (15.2%) | 400 (14.6%) | 192 (14.0%) | 208 (15.2%) | 52 (15.2%) | 193 (14.1%) | |||
| IV | 176 (4.8%) | 1,514 (4.9%) | 24 (7.0%) | 185 (6.8%) | 68 (5.0%) | 89 (6.5%) | 24 (7.0%) | 91 (6.7%) | |||
| Median household income | |||||||||||
| <$55,000 | 598 (16.4%) | 5,739 (18.7%) | 56 (16.4%) | 475 (17.4%) | < 0.001 | 241 (17.6%) | 229 (16.7%) | 56 (16.4%) | 222 (16.2%) | 0.99 | |
| <$65,000 | 659 (18.1%) | 5,741 (18.7%) | 60 (17.5%) | 556 (20.3%) | 252 (18.4%) | 237 (17.3%) | 60 (17.5%) | 228 (16.7%) | |||
| <$75,000 | 912 (25.0%) | 7,067 (23.0%) | 96 (28.1%) | 705 (25.8%) | 369 (27.0%) | 392 (28.7%) | 96 (28.1%) | 387 (28.3%) | |||
| >$75,000 | 1,479 (40.5%) | 12,134 (39.5%) | 130 (38.0%) | 998 (36.5%) | 506 (37.0%) | 510 (37.3%) | 130 (38.0%) | 531 (38.8%) | |||
| Rural–urban distribution | |||||||||||
| Metropolitan areas | 2,234 (61.2%) | 17,562 (57.2%) | 220 (64.3%) | 1,652 (60.4%) | < 0.001 | 840 (61.4%) | 893 (65.3%) | 220 (64.3%) | 902 (65.9%) | 0.503 | |
| Intermediate areas | 1,028 (28.2%) | 8,879 (28.9%) | 80 (23.4%) | 741 (27.1%) | 355 (26.0%) | 317 (23.2%) | 80 (23.4%) | 314 (23.0%) | |||
| Nonmetropolitan areas | 386 (10.6%) | 4,240 (13.8%) | 42 (12.3%) | 341 (12.5%) | 173 (12.6%) | 158 (11.5%) | 42 (12.3%) | 152 (11.1%) | |||
| Characteristics | Before PSM | After PSM | ||||||||
|---|---|---|---|---|---|---|---|---|---|---|
| EOAC | LOAC | EOMC | LOMC |
| EOAC | LOAC | EOMC | LOMC |
| |
| ( | ( | ( | ( | ( | ( | ( | ( | |||
| Sex | ||||||||||
| Female | 4,096 (49.1%) | 23,191 (47.8%) | 310 (37.3%) | 2,172 (48.3%) | < 0.001 | 1,210 (36.4%) | 1,240 (37.3%) | 310 (37.3%) | 1,231 (37.0%) | 0.956 |
| Male | 4,238 (50.9%) | 25,319 (52.2%) | 521 (62.7%) | 2,329 (51.7%) | 2,114 (63.6%) | 2,084 (62.7%) | 521 (62.7%) | 2,093 (63.0%) | ||
| Race | ||||||||||
| Black | 1,229 (14.7%) | 6,193 (12.8%) | 112 (13.5%) | 509 (11.3%) | < 0.001 | 467 (14.0%) | 463 (13.9%) | 112 (13.5%) | 420 (12.6%) | 0.335 |
| Others | 1,010 (12.1%) | 5,046 (10.4%) | 90 (10.8%) | 356 (7.9%) | 333 (10.0%) | 345 (10.4%) | 90 (10.8%) | 300 (9.0%) | ||
| White | 6,095 (73.1%) | 37,271 (76.8%) | 629 (75.7%) | 3,636 (80.8%) | 2,524 (75.9%) | 2,516 (75.7%) | 629 (75.7%) | 2,604 (78.3%) | ||
| Marital status | ||||||||||
| Married | 4,876 (58.5%) | 29,472 (60.8%) | 468 (56.3%) | 2,707 (60.1%) | < 0.001 | 1,894 (57.0%) | 1,891 (56.9%) | 468 (56.3%) | 1,959 (58.9%) | 0.386 |
| Unmarried | 3,458 (41.5%) | 19,038 (39.2%) | 363 (43.7%) | 1,794 (39.9%) | 1,430 (43.0%) | 1,433 (43.1%) | 363 (43.7%) | 1,365 (41.1%) | ||
| Primary location | ||||||||||
| Left | 4,742 (56.9%) | 20,675 (42.6%) | 288 (34.7%) | 1,235 (27.4%) | < 0.001 | 1,151 (34.6%) | 1,138 (34.2%) | 288 (34.7%) | 1,162 (35.0%) | 0.984 |
| Right | 3,592 (43.1%) | 27,835 (57.4%) | 543 (65.3%) | 3,266 (72.6%) | 2,173 (65.4%) | 2,186 (65.8%) | 543 (65.3%) | 2,162 (65.0%) | ||
| Differentiation | ||||||||||
| Well differentiation | 6,924 (83.1%) | 41,230 (85.0%) | 684 (82.3%) | 3,695 (82.1%) | < 0.001 | 2,760 (83.0%) | 2,758 (83.0%) | 684 (82.3%) | 2,774 (83.5%) | 0.95 |
| Poor differentiation | 1,410 (16.9%) | 7,280 (15.0%) | 147 (17.7%) | 806 (17.9%) | 564 (17.0%) | 566 (17.0%) | 147 (17.7%) | 550 (16.5%) | ||
| Median household income | ||||||||||
| <$55,000 | 1,397 (16.8%) | 9,323 (19.2%) | 128 (15.4%) | 814 (18.1%) | < 0.001 | 525 (15.8%) | 502 (15.1%) | 128 (15.4%) | 508 (15.3%) | 0.702 |
| <$65,000 | 1,443 (17.3%) | 8,865 (18.3%) | 159 (19.1%) | 922 (20.5%) | 593 (17.8%) | 653 (19.6%) | 159 (19.1%) | 676 (20.3%) | ||
| <$75,000 | 1,966 (23.6%) | 10,862 (22.4%) | 220 (26.5%) | 1,063 (23.6%) | 858 (25.8%) | 882 (26.5%) | 220 (26.5%) | 864 (26.0%) | ||
| >$75,000 | 3,528 (42.3%) | 19,460 (40.1%) | 324 (39.0%) | 1,702 (37.8%) | 1,348 (40.6%) | 1,287 (38.7%) | 324 (39.0%) | 1,276 (38.4%) | ||
| Rural–urban distribution | ||||||||||
| Metropolitan areas | 4,966 (59.6%) | 27,603 (56.9%) | 515 (62.0%) | 2,658 (59.1%) | < 0.001 | 2,065 (62.1%) | 2,061 (62.0%) | 515 (62.0%) | 2,037 (61.3%) | 0.987 |
| Intermediate areas | 2,465 (29.6%) | 14,169 (29.2%) | 222 (26.7%) | 1,245 (27.7%) | 889 (26.7%) | 908 (27.3%) | 222 (26.7%) | 901 (27.1%) | ||
| Nonmetropolitan areas | 903 (10.8%) | 6,738 (13.9%) | 94 (11.3%) | 598 (13.3%) | 370 (11.1%) | 355 (10.7%) | 94 (11.3%) | 386 (11.6%) | ||
| Characteristics | Before PSM | After PSM | ||||||||
|---|---|---|---|---|---|---|---|---|---|---|
| EOAC | LOAC | EOMC | LOMC |
| EOAC | LOAC | EOMC | LOMC |
| |
| ( | ( | ( | ( | ( | ( | ( | ( | |||
| Sex | ||||||||||
| Female | 1,684 (48.5%) | 13,835 (47.4%) | 120 (37.7%) | 1,219 (47.8%) | 0.00829 | 477 (37.5%) | 482 (37.9%) | 120 (37.7%) | 481 (37.8%) | 1 |
| Male | 1,788 (51.5%) | 15,332 (52.6%) | 198 (62.3%) | 1,330 (52.2%) | 795 (62.5%) | 790 (62.1%) | 198 (62.3%) | 791 (62.2%) | ||
| Race | ||||||||||
| Black | 509 (14.7%) | 3,643 (12.5%) | 48 (15.1%) | 281 (11.0%) | < 0.001 | 176 (13.8%) | 189 (14.9%) | 48 (15.1%) | 200 (15.7%) | 0.613 |
| Others | 441 (12.7%) | 2,974 (10.2%) | 32 (10.1%) | 203 (8.0%) | 96 (7.5%) | 121 (9.5%) | 32 (10.1%) | 107 (8.4%) | ||
| White | 2,522 (72.6%) | 22,550 (77.3%) | 238 (74.8%) | 2,065 (81.0%) | 1,000 (78.6%) | 962 (75.6%) | 238 (74.8%) | 965 (75.9%) | ||
| Marital status | ||||||||||
| Married | 2,068 (59.6%) | 17,644 (60.5%) | 167 (52.5%) | 1,500 (58.8%) | 0.0222 | 680 (53.5%) | 670 (52.7%) | 167 (52.5%) | 674 (53.0%) | 0.996 |
| Unmarried | 1,404 (40.4%) | 11,523 (39.5%) | 151 (47.5%) | 1,049 (41.2%) | 592 (46.5%) | 602 (47.3%) | 151 (47.5%) | 598 (47.0%) | ||
| Primary location | ||||||||||
| Left | 1,861 (53.6%) | 11,788 (40.4%) | 95 (29.9%) | 681 (26.7%) | < 0.001 | 379 (29.8%) | 374 (29.4%) | 95 (29.9%) | 403 (31.7%) | 0.77 |
| Right | 1,611 (46.4%) | 17,379 (59.6%) | 223 (70.1%) | 1,868 (73.3%) | 893 (70.2%) | 898 (70.6%) | 223 (70.1%) | 869 (68.3%) | ||
| Differentiation | ||||||||||
| Well differentiation | 3,085 (88.9%) | 25,960 (89.0%) | 273 (85.8%) | 2,214 (86.9%) | 0.00832 | 1,103 (86.7%) | 1,096 (86.2%) | 273 (85.8%) | 1,117 (87.8%) | 0.763 |
| Poor differentiation | 387 (11.1%) | 3,207 (11.0%) | 45 (14.2%) | 335 (13.1%) | 169 (13.3%) | 176 (13.8%) | 45 (14.2%) | 155 (12.2%) | ||
| Median household income | ||||||||||
| <$55,000 | 568 (16.4%) | 5,413 (18.6%) | 52 (16.4%) | 440 (17.3%) | < 0.001 | 204 (16.0%) | 204 (16.0%) | 52 (16.4%) | 202 (15.9%) | 1 |
| <$65,000 | 616 (17.7%) | 5,408 (18.5%) | 56 (17.6%) | 526 (20.6%) | 221 (17.4%) | 224 (17.6%) | 56 (17.6%) | 223 (17.5%) | ||
| <$75,000 | 864 (24.9%) | 6,684 (22.9%) | 86 (27.0%) | 637 (25.0%) | 331 (26.0%) | 342 (26.9%) | 86 (27.0%) | 346 (27.2%) | ||
| >$75,000 | 1,424 (41.0%) | 11,662 (40.0%) | 124 (39.0%) | 946 (37.1%) | 516 (40.6%) | 502 (39.5%) | 124 (39.0%) | 501 (39.4%) | ||
| Rural–urban distribution | ||||||||||
| Metropolitan areas | 2,135 (61.5%) | 16,728 (57.4%) | 202 (63.5%) | 1,538 (60.3%) | < 0.001 | 785 (61.7%) | 812 (63.8%) | 202 (63.5%) | 807 (63.4%) | 0.951 |
| Intermediate areas | 969 (27.9%) | 8,421 (28.9%) | 76 (23.9%) | 686 (26.9%) | 330 (25.9%) | 300 (23.6%) | 76 (23.9%) | 318 (25.0%) | ||
| Nonmetropolitan areas | 368 (10.6%) | 4,018 (13.8%) | 40 (12.6%) | 325 (12.8%) | 157 (12.3%) | 160 (12.6%) | 40 (12.6%) | 147 (11.6%) | ||
| Characteristics | Before PSM | After PSM | ||||||||
|---|---|---|---|---|---|---|---|---|---|---|
| EOAC | LOAC | EOMC | LOMC |
| EOAC | LOAC | EOMC | LOMC |
| |
| ( | ( | ( | ( | ( | ( | ( | ( | |||
| Sex | ||||||||||
| Female | 1,324 (50.7%) | 4,448 (45.1%) | 109 (45.6%) | 454 (49.8%) | < 0.001 | 422 (44.1%) | 424 (44.4%) | 109 (45.6%) | 454 (49.8%) | 0.106 |
| Male | 1,285 (49.3%) | 5,411 (54.9%) | 130 (54.4%) | 458 (50.2%) | 534 (55.9%) | 532 (55.6%) | 130 (54.4%) | 458 (50.2%) | ||
| Race | ||||||||||
| Black | 398 (15.3%) | 1,516 (15.4%) | 45 (18.8%) | 130 (14.3%) | 0.00102 | 179 (18.7%) | 181 (18.9%) | 45 (18.8%) | 130 (14.3%) | 0.048 |
| Others | 304 (11.7%) | 911 (9.2%) | 24 (10.0%) | 63 (6.9%) | 66 (6.9%) | 84 (8.8%) | 24 (10.0%) | 63 (6.9%) | ||
| White | 1,907 (73.1%) | 7,432 (75.4%) | 170 (71.1%) | 719 (78.8%) | 711 (74.4%) | 691 (72.3%) | 170 (71.1%) | 719 (78.8%) | ||
| Marital status | ||||||||||
| Married | 1,499 (57.5%) | 5,632 (57.1%) | 123 (51.5%) | 501 (54.9%) | 0.304 | 509 (53.2%) | 504 (52.7%) | 123 (51.5%) | 501 (54.9%) | 0.843 |
| Unmarried | 1,110 (42.5%) | 4,227 (42.9%) | 116 (48.5%) | 411 (45.1%) | 447 (46.8%) | 452 (47.3%) | 116 (48.5%) | 411 (45.1%) | ||
| Primary location | ||||||||||
| Left | 1,579 (60.5%) | 4,459 (45.2%) | 90 (37.7%) | 299 (32.8%) | < 0.001 | 350 (36.6%) | 354 (37.0%) | 90 (37.7%) | 299 (32.8%) | 0.302 |
| Right | 1,030 (39.5%) | 5,400 (54.8%) | 149 (62.3%) | 613 (67.2%) | 606 (63.4%) | 602 (63.0%) | 149 (62.3%) | 613 (67.2%) | ||
| Differentiation | ||||||||||
| Well differentiation | 1,950 (74.7%) | 7,274 (73.8%) | 152 (63.6%) | 645 (70.7%) | 0.00118 | 625 (65.4%) | 609 (63.7%) | 152 (63.6%) | 645 (70.7%) | 0.017 |
| Poor differentiation | 659 (25.3%) | 2,585 (26.2%) | 87 (36.4%) | 267 (29.3%) | 331 (34.6%) | 347 (36.3%) | 87 (36.4%) | 267 (29.3%) | ||
| Median household income | ||||||||||
| <$55,000 | 443 (17.0%) | 2,125 (21.6%) | 40 (16.7%) | 174 (19.1%) | < 0.001 | 164 (17.2%) | 153 (16.0%) | 40 (16.7%) | 174 (19.1%) | 0.493 |
| <$65,000 | 490 (18.8%) | 1,912 (19.4%) | 49 (20.5%) | 173 (19.0%) | 187 (19.6%) | 198 (20.7%) | 49 (20.5%) | 173 (19.0%) | ||
| <$75,000 | 647 (24.8%) | 2,235 (22.7%) | 58 (24.3%) | 260 (28.5%) | 234 (24.5%) | 241 (25.2%) | 58 (24.3%) | 260 (28.5%) | ||
| >$75,000 | 1,029 (39.4%) | 3,587 (36.4%) | 92 (38.5%) | 305 (33.4%) | 371 (38.8%) | 364 (38.1%) | 92 (38.5%) | 305 (33.4%) | ||
| Rural–urban distribution | ||||||||||
| Metropolitan areas | 1,528 (58.6%) | 5,488 (55.7%) | 151 (63.2%) | 521 (57.1%) | < 0.001 | 596 (62.3%) | 605 (63.3%) | 151 (63.2%) | 521 (57.1%) | 0.006 |
| Intermediate areas | 822 (31.5%) | 2,949 (29.9%) | 67 (28.0%) | 262 (28.7%) | 272 (28.5%) | 271 (28.3%) | 67 (28.0%) | 262 (28.7%) | ||
| Nonmetropolitan areas | 259 (9.9%) | 1,422 (14.4%) | 21 (8.8%) | 129 (14.1%) | 88 (9.2%) | 80 (8.4%) | 21 (8.8%) | 129 (14.1%) | ||
| Characteristics | Before PSM | After PSM | ||||||||
|---|---|---|---|---|---|---|---|---|---|---|
| EOAC | LOAC | EOMC | LOMC |
| EOAC | LOAC | EOMC | LOMC |
| |
| ( | ( | ( | ( | ( | ( | ( | ( | |||
| Sex | ||||||||||
| Female | 86 (48.9%) | 659 (43.5%) | 10 (41.7%) | 103 (55.7%) | 0.0268 | 50 (52.1%) | 42 (43.8%) | 10 (41.7%) | 46 (47.9%) | 0.794 |
| Male | 90 (51.1%) | 855 (56.5%) | 14 (58.3%) | 82 (44.3%) | 46 (47.9%) | 54 (56.3%) | 14 (58.3%) | 50 (52.1%) | ||
| Race | ||||||||||
| Black | 36 (20.5%) | 248 (16.4%) | 8 (33.3%) | 29 (15.7%) | 0.392 | 29 (30.2%) | 32 (33.3%) | 8 (33.3%) | 25 (26.0%) | 0.986 |
| Others | 19 (10.8%) | 155 (10.2%) | 2 (8.3%) | 14 (7.6%) | 9 (9.4%) | 7 (7.3%) | 2 (8.3%) | 7 (7.3%) | ||
| White | 121 (68.8%) | 1,111 (73.4%) | 14 (58.3%) | 142 (76.8%) | 58 (60.4%) | 57 (59.4%) | 14 (58.3%) | 64 (66.7%) | ||
| Marital status | ||||||||||
| Married | 70 (39.8%) | 717 (47.4%) | 7 (29.2%) | 67 (36.2%) | 0.00933 | 27 (28.1%) | 39 (40.6%) | 7 (29.2%) | 26 (27.1%) | 0.276 |
| Unmarried | 106 (60.2%) | 797 (52.6%) | 17 (70.8%) | 118 (63.8%) | 69 (71.9%) | 57 (59.4%) | 17 (70.8%) | 70 (72.9%) | ||
| Primary location | ||||||||||
| Left | 102 (58.0%) | 626 (41.3%) | 5 (20.8%) | 59 (31.9%) | < 0.001 | 32 (33.3%) | 14 (14.6%) | 5 (20.8%) | 22 (22.9%) | 0.049 |
| Right | 74 (42.0%) | 888 (58.7%) | 19 (79.2%) | 126 (68.1%) | 64 (66.7%) | 82 (85.4%) | 19 (79.2%) | 74 (77.1%) | ||
| Differentiation | ||||||||||
| Well differentiation | 129 (73.3%) | 1,084 (71.6%) | 20 (83.3%) | 128 (69.2%) | 0.662 | 74 (77.1%) | 77 (80.2%) | 20 (83.3%) | 73 (76.0%) | 0.920 |
| Poor differentiation | 47 (26.7%) | 430 (28.4%) | 4 (16.7%) | 57 (30.8%) | 22 (22.9%) | 19 (19.8%) | 4 (16.7%) | 23 (24.0%) | ||
| Median household income | ||||||||||
| <$55,000 | 30 (17.0%) | 326 (21.5%) | 4 (16.7%) | 35 (18.9%) | 0.169 | 18 (18.8%) | 14 (14.6%) | 4 (16.7%) | 18 (18.8%) | 0.982 |
| <$65,000 | 43 (24.4%) | 333 (22.0%) | 4 (16.7%) | 30 (16.2%) | 18 (18.8%) | 18 (18.8%) | 4 (16.7%) | 12 (12.5%) | ||
| <$75,000 | 48 (27.3%) | 383 (25.3%) | 10 (41.7%) | 68 (36.8%) | 33 (34.4%) | 42 (43.8%) | 10 (41.7%) | 38 (39.6%) | ||
| >$75,000 | 55 (31.3%) | 472 (31.2%) | 6 (25.0%) | 52 (28.1%) | 27 (28.1%) | 22 (22.9%) | 6 (25.0%) | 28 (29.2%) | ||
| Rural–urban distribution | ||||||||||
| Metropolitan areas | 99 (56.3%) | 834 (55.1%) | 18 (75.0%) | 114 (61.6%) | 0.177 | 64 (66.7%) | 74 (77.1%) | 18 (75.0%) | 72 (75.0%) | 0.655 |
| Intermediate areas | 59 (33.5%) | 458 (30.3%) | 4 (16.7%) | 55 (29.7%) | 22 (22.9%) | 16 (16.7%) | 4 (16.7%) | 12 (12.5%) | ||
| Nonmetropolitan areas | 18 (10.2%) | 222 (14.7%) | 2 (8.3%) | 16 (8.6%) | 10 (10.4%) | 6 (6.3%) | 2 (8.3%) | 12 (12.5%) | ||
- —Natural Science Foundation of Zhejiang Province10.13039/501100004731
Peer Reviews
No public reviews on file for this paper yet. If you reviewed it on a platform where reviews are public (OpenReview, ICLR, NeurIPS, ICML), you can paste yours below so the community can read it here.
Videos
No videos yet. Explain this paper in a talk, walkthrough, or lecture? Add one.
Taxonomy
TopicsColorectal Cancer Screening and Detection · Colorectal Cancer Surgical Treatments · Genetic factors in colorectal cancer
Introduction
1
Colorectal cancer is among the most common and lethal malignancies, and its incidence is increasing among younger individuals. Early‐onset colorectal cancer (EOCRC) is projected to account for 11% of all colon cancers and 23% of all rectal cancers by 2030 [1, 2]. Based on age at diagnosis, colorectal cancer can be categorized into two groups: Early‐onset (i.e., diagnosed before the age of 50) and late‐onset (i.e., diagnosed at age 50 or older) [3]. Colorectal cancer research has undergone a paradigm shift that has increased the focus on the clinical presentation, pathological features, molecular profiles, and survival outcomes of younger patients and shifted it away from their older counterparts [4]. Studies comparing early‐onset and late‐onset colorectal (LOCRC) cancer have indicated that early‐onset cases typically present with an advanced tumor stage and unfavorable features, such as poor differentiation and mucinous or signet‐ring subtypes [5]. Despite the aggressive behavior of early‐onset colorectal cancer, both cohorts have comparable survival outcomes [5, 6]. The better tolerance of younger patients to treatment‐related toxicity may mitigate the negative impact of aggressive tumor biology [4]. However, certain studies suggest that disease‐free survival (DFS) can differ between young patients and older patients [7, 8]. Tumor heterogeneity and differences in covariates may explain the differences in diagnosis between these cohorts.
Rectal cancer and colon cancer exhibit significant differences in tumor biology. Unlike previous studies, the present study focused exclusively on colon cancer. To better clarify the effects of age at onset on tumor biology and prognosis, data on adenocarcinoma and mucinous carcinoma (which are the two main subtypes of colon cancer) were extracted from the Surveillance, Epidemiology, and End Results (SEER) database. The clinicopathological characteristics of patients with adenocarcinoma and those with mucinous carcinoma were compared between patients with early‐ and late‐onset disease. Propensity score matching (PSM) was employed to eliminate confounding bias from observational cohorts before outcome analyses among early‐ and late‐onset patients.
Methods
2
Data Source
2.1
Data for this study were obtained from the SEER database, which is publicly available and reliable [9]. The SEER registries include comprehensive information on patient demographics, tumor pathology, treatment, and follow‐up details regarding vital status and causes of death. The researchers obtained permission to download the research data files from the SEER database, and no further informed consent was needed.
Patient Selection
2.2
Patients diagnosed with colon cancer between 2000 and 2022 (17 registries, November 2022) were identified and selected via SEER*Stat software (version 8.4.3) based on the following inclusion criteria:
- The International Classification of Diseases for Oncology, Third Edition (ICD‐O‐3) biology codes indicated malignant tumors.
- ICD‐O‐3 histology codes: 8140/3, 8480/3, 8481/3.
- ICD‐O‐3 site codes: Colon excluding rectum.
Patients diagnosed during autopsy or on the death certificate were excluded from this study.
The independent variables for this study included demographic characteristics (age, sex, race, marital status, median household income, and rural–urban continuum code residence districts), tumor features (location, histology, grade, and stage), treatment approach (surgery, radiation, and chemotherapy), and survival information (vital status, survival months, survival months flag, and causes of death classification).
Parameters
2.3
The cutoff for age at onset was defined as 50 years. ICD‐O‐3 histology code 8140/3 referred to adenocarcinoma, whereas codes 8480/3 and 8481/3 referred to mucinous adenocarcinoma. Patients were categorized based on histology and age at onset into an early‐onset colon cancer (EOCC) group, which included early‐onset adenocarcinoma (EOAC) and early‐onset mucinous adenocarcinoma (EOMC), and a late‐onset colon cancer (LOCC) group, which included late‐onset adenocarcinoma (LOAC) and late‐onset mucinous adenocarcinoma (LOMC). Furthermore, some variables were recategorized and redefined as follows:
- Race was categorized as White, Black, and Other (including American Indian/Alaskan Native and Asian or Pacific Islander).
- Marital status was categorized as married or unmarried (including divorced, separated, single, unmarried or domestic partner, and widowed).
- Location was categorized as left (including the splenic flexure, descending colon, and sigmoid colon) or right (including the cecum, ascending colon, hepatic flexure, and transverse colon).
- Median household income was categorized into four groups: < 55,000, < 75,000.
- Tumor differentiation was categorized as well differentiated (Grade I/II) or poorly differentiated (Grade III/IV).
- Rural–urban distribution was categorized as metropolitan (counties in metropolitan areas with populations ≥ 1 million), intermediate (counties in metropolitan areas of 250,000 to 1 million and counties in metropolitan areas with populations < 250,000), or nonmetropolitan (counties not adjacent to a metropolitan area).
- Cancer‐specific survival (CSS) and surgery‐specific survival (SSS) were classified as follows: CSS was defined as the time from diagnosis to death attributable to colon cancer, with censoring for living patients or deaths from other causes, based on SEER cause‐specific death classification (“alive or dead of other cause” for censoring; “dead (attributable to this cancer)” for events) and COD (cause of death) to site rec KM (“alive” for censoring; “colon excluding rectum” for events). SSS was defined as CSS restricted to patients who underwent surgery but never received adjuvant therapy.
To minimize the impact of aging and treatment delays on survival outcomes, patients had to meet the following criteria before prognostic analysis [1]: age at onset was no more than 75 years; and [2] the time from diagnosis to treatment was no longer than 2 months. The follow‐up data had to meet the following criteria [1]: vital status was either alive or dead because of colon cancer [2]; the survival months flag was limited to “complete dates are available and there are more than 0 days of survival” or “incomplete dates are available and there cannot be zero days of follow‐up”’; and [3] complete data on tumor grade and stage were available.
Statistical Analysis
2.4
Categorical variables were compared using the chi‐square test to assess baseline differences. To minimize confounding and balance cohorts, propensity score matching (PSM) was performed via logistic regression, incorporating sex, race, marital status, primary location, tumor differentiation, tumor stage, median household income, and rural–urban distribution. The nearest‐neighbor algorithm was applied with a 1:4 matching ratio and a caliper of 0.1; standardized mean differences (SMDs) below 0.1 confirmed adequate balance per the PSM guidelines. Kaplan–Meier curves illustrate CSS and SSS, with log‐rank tests for group comparisons. Univariate Cox proportional hazards regression was used to identify prognostic factors associated with CSS and SSS. Significant variables were included in multivariate Cox models, where hazard ratios (HRs) and 95% confidence intervals (CIs) were calculated. Schoenfeld residuals were used to test the proportional hazards assumption (PHA); for violations, we used piecewise Cox models (to capture time‐varying effects via data‐driven cutoff points) and stratified Cox models (to allow separate baseline hazards for nonproportional variables), ensuring PHA compliance and robust inference. All analyses were conducted in R version 4.2.1 (R Foundation for Statistical Computing, Vienna, Austria), with p < 0.05 indicating statistical significance.
Results
3
Patient Characteristics
3.1
A total of 180,804 colon cancer patients were ultimately selected from the SEER database, including 165,085 (91.3%) with adenocarcinoma and 15,719 (8.7%) with mucinous adenocarcinoma. Among these patients, 49.7% were female, and 50.3% were male. Across all histologic types, mucinous adenocarcinoma was predominant in females (51.7%), whereas adenocarcinoma was predominant in males (50.5%) (Supplementary Table S1). Patients were classified into four custom groups on the basis of histology and age at onset: EOAC (n = 15,884, 8.8%), LOAC (n = 149,201, 82.5%), EOMC (n = 1,518, 0.8%), and LOMC (n = 14,201, 7.9%). Patients in both the EOCC and LOCC groups were predominantly male. Specifically, the male predominance in EOCC was due mainly to the EOMC subgroup (59.4%). Unlike the other cohorts, the LOMC group exhibited a female predominance (52.9%). The distribution of age at onset varied among different races. EOCC was more common among black patients and patients of other races, whereas LOCC was more common among white patients (p < 0.001). Although the distribution of marital status varied to some extent, being married remained the most common marital status across all patient cohorts. The distributions of median household income and rural–urban distribution in the EOCC and LOCC groups were similar, although the P value indicated a significant difference (see Table 1 for details).
Pathological Characteristics
3.2
The primary location of colon cancer varied between the EOCC and LOCC groups. EOCC was located mainly on the left side of the colon (54.2%), whereas LOCC was observed primarily on the right side of the colon (59.6%). Specifically, EOAC was predominantly left‐sided (56.1%), whereas EOMC was mainly right‐sided (59.7%). Among late‐onset cases, the dominant right‐sided cohort was LOMC (71.2%). The distribution of tumor differentiation was similar between EOCC and LOCC (p = 0.999), although poor differentiation was notably associated with mucinous adenocarcinoma, independent of age at onset (Supplementary Table S1 and Table S2). Additionally, compared with LOCC patients, EOCC patients more commonly presented with advanced tumor stages, including more frequent T3/T4 staging, lymph node infiltration, and distant metastasis (see Table 1 for details).
Treatment
3.3
Overall, surgery was the main treatment for both EOCC and LOCC, but only a small proportion of patients received radiotherapy. More than half of the early‐onset patients underwent chemotherapy—53.0% of those with EOAC and 59.0% of those with EOMC. These rates were significantly greater than those of late‐onset patients: 27.5% of LOAC patients and 31.1% of LOMC patients underwent chemotherapy (see Table 1 for details).
Prognostic Analysis
3.4
Initial prognostic analyses compared EOCC and LOCC without accounting for histology to assess the baseline impact of age at onset. Following PSM (Table 2), Kaplan–Meier analyses revealed significantly inferior CSS and SSS in LOCC patients than in EOCC patients (both p < 0.001; Figure 1A,B). PHA violations in the initial Cox proportional hazards models were addressed using piecewise and stratified modeling for CSS and SSS (global p = 0.056 and 0.24, respectively). These refined models confirmed a worse prognosis for LOCC: For CSS ≤ 24 months (HR 1.34, 95% CI 1.27–1.42, p < 0.001) and > 24 months (HR 1.16, 95% CI 1.06–1.27; p < 0.001), and an SSS (HR 1.35, 95% CI 1.21–1.50; p < 0.001) (Supplementary Table S3).
Kaplan–Meier Survival Curves for CSS and SSS in Colon Cancer Patients Stratified by Age of Onset and Histology. (A) CSS curves comparing EOCC and LOCC patients (p < 0.001). (B) SSS curves comparing EOCC and LOCC patients (p < 0.001). (C) CSS curves comparing EOAC, LOAC, EOMC, and LOMC patients, with EOAC showing the best survival and LOMC the worst (p < 0.001). No significant differences emerged between EOAC vs. LOAC (p = 0.213) or EOMC vs. LOMC (p = 0.077). (D) SSS curves comparing EOAC, LOAC, EOMC, and LOMC patients, with EOAC showing the best survival and LOMC the worst (p < 0.001). No significant differences between EOAC vs. LOAC (p = 0.065) or EOMC vs. LOMC (p = 0.288).
Given the differences in biological behavior and chemotherapy response between adenocarcinoma and mucinous adenocarcinoma, subsequent analyses incorporated histology to evaluate age‐at‐onset effects across the EOMC, EOAC, LOMC, and LOAC cohorts. PSM was performed between EOMC and the other groups (EOAC, LOMC, and LOAC; Tables 3 and 4) prior to survival estimation. Kaplan–Meier analyses revealed that the CSS and SSS were best for EOAC and worst for LOMC (both p < 0.001; Figure 1C,D). No significant differences emerged between the early‐ and late‐onset groups for adenocarcinoma (CSS: p = 0.213; SSS: p = 0.065) or mucinous adenocarcinoma (CSS: p = 0.077; SSS: p = 0.288). PHA violations in these Cox models were mitigated via piecewise and stratified approaches for CSS and SSS (global p = 0.074 and 0.692, respectively). According to the refined CSS model, LOMC predicted a worse prognosis than EOAC (≤ 24 months: HR 1.55, 95% CI 1.39–1.72, p < 0.001; > 24 months: HR 1.29, 95% CI 1.09–1.53, p = 0.037). Unmarried status (vs. married: HR 1.32, 95% CI 1.24–1.41; p < 0.001) was associated with poorer outcomes, whereas a median household income >75,000 remained protective (HR 0.60, 95% CI 0.46–0.77; p < 0.001) (Supplementary Table S4).
Prognostic Analysis Stratified by Distant Metastasis
3.5
Colon cancer management differs by metastatic status: Patients with stage IV disease primarily receive systemic or targeted therapies, whereas those with stages I–III disease undergo surgery. Baseline characteristics revealed significant differences in distant metastasis distribution between the early‐onset (EOAC and EOMC) and late‐onset (LOAC and LOMC) groups (Table 1). Cox models revealed a significant interaction between histology‐age group and stage (concordance index 0.787, p < 0.001 for CSS; concordance index 0.781, p = 0.022 for SSS), prompting subgroup analyses stratified by distant metastasis. PSM was performed between EOMC and the other cohorts (EOAC, LOAC, and LOMC) prior to survival estimation (Tables 5, 6, 7, 8).
In the nonmetastatic subgroup (stages I–III), Kaplan–Meier analyses indicated that CSS and SSS were best for LOAC and worst for LOMC (both p < 0.001; Figure 2A,B). No significant differences were observed between EOMC and LOMC (CSS: p = 0.127; SSS: p = 0.204). Notably, LOAC and EOAC had a comparable CSS (p = 0.284), but LOAC had a superior SSS (p = 0.008). The CSS Cox model was refined by stratifying by differentiation to ensure PHA adherence (global p = 0.095). Compared with EOAC, LOMC predicted a worse prognosis (≤ 24 months: HR 2.14, 95% CI 1.75–2.61, p < 0.001; > 24 months: HR 1.23, 95% CI 1.11–1.62, p < 0.001), whereas LOAC and EOAC did not differ in prognosis (≤ 24 months: HR 0.96, 95% CI 0.76–1.21, p = 0.719; > 24 months: HR 0.88, 95% CI 0.65–1.19, p = 0.591). Additional predictors of worse CSS included male sex (HR 1.14, 95% CI 1.02–1.27; p = 0.026) and being unmarried (HR 1.35, 95% CI 1.21–1.50; p < 0.001); protective factors included being white (vs. Black: HR 0.85, 95% CI 0.73–0.99; p = 0.034) and having a median household income > 55,000: HR 0.76, 95% CI 0.65–0.89; p < 0.001). The SSS Cox model in which PHA was satisfied (global p = 0.52) confirmed that EOMC had the worst prognosis (HR 1.57, 95% CI 1.21–2.03; p < 0.001) and that LOAC had a better prognosis than EOAC did (HR 0.61, 95% CI 0.44–0.84; p = 0.003). Unmarried status (HR 1.38; 95% CI 1.11–1.72; p = 0.004) and poor differentiation (HR 2.74; 95% CI 2.15–3.49; p < 0.001) were associated with inferior outcomes, whereas a median household income > 55,000; HR 0.57; 95% CI 0.41–0.79; p < 0.001) (see Supplementary Table S5 for details).
Kaplan–Meier Survival Curves for CSS and SSS in Colon Cancer Patients Stratified by Metastatic Status. (A) CSS in the nonmetastatic subgroup, with the best survival for LOAC and the worst for LOMC (p < 0.001). No significant differences between EOAC vs. LOAC (p = 0.284) or EOMC vs. LOMC (p = 0.127). (B) SSS in the nonmetastatic subgroup, with the best survival for LOAC and the worst for LOMC (p < 0.001). No significant differences between EOMC vs. LOMC (p = 0.204). LOAC had superior SSS compared to EOAC (p = 0.008). (C) CSS in the metastatic subgroup, with the best survival for EOAC and the worst for LOMC (p = 0.003). No significant differences between EOAC vs. LOAC (p = 0.210) or EOMC vs. LOMC (p = 0.347). (D) SSS in the metastatic subgroup, showing no significant differences among groups (p = 0.39).
In the metastatic subgroup (stage IV), Kaplan–Meier analyses revealed that CSS was best among patients with EOAC and worst among those with LOMC (p = 0.003; Figure 2C). No significant differences emerged between the early‐ and late‐onset groups for adenocarcinoma (p = 0.210) or mucinous adenocarcinoma (p = 0.347). SSS did not significantly differ among the groups (p = 0.39; Figure 2D). The refined CSS Cox model, stratified by primary location and differentiation for PHA adherence (global p = 0.052), revealed LOMC (vs. EOAC: HR 1.23, 95% CI 1.09–1.39, p < 0.001) and unmarried status (vs. married: HR 1.30, 95% CI 1.19–1.43, p < 0.001) as predictors of worse outcomes. The SSS Cox model, which satisfied the PHA (global p = 0.59) and included only marital status and differentiation, identified poor differentiation as a predictor of worse SSS (HR 2.25, 95% CI 1.57–3.23; p < 0.001) (see Supplementary Table S6 for details).
Discussion
4
The incidence of EOCRC is increasing worldwide, drawing significant attention from clinicians and researchers who have investigated its clinicopathological characteristics, molecular features, and prognosis. Consensus has emerged on distinctive EOCRC traits, such as advanced stage, aggressive histopathology, and distal location [5]. In this study, colon cancer was analyzed independently rather than in combination with rectal cancer, which minimized the confounding effects of anatomical and therapeutic differences. Both EOCC and LOCC exhibited male predominance; for EOCC, this predominance was driven primarily by the EOMC subgroup (59.4%). In contrast, the LOMC group showed female predominance. EOCC also displayed racial disparities, occurring relatively more frequently in black patients and those of other races than in white patients (p < 0.001). These findings align with prior reports on EOCRC incidence patterns by sex and race [10, 11].
Previous studies have demonstrated that younger patients have a greater incidence of colorectal cancer in the rectum and distal colon than in the proximal colon [11, 12, 13]. Consistent with this fact, EOAC was predominantly left‐sided (56.1%) in this study, whereas EOMC was mainly right‐sided (59.7%). The relationship between primary tumor location and age at onset appears to be histology dependent. As reported in other EOCRC studies, EOCC was associated with more advanced stages than LOCC, including greater rates of stage T3/T4 disease, lymph node involvement, and distant metastasis. However, the tumor differentiation distributions did not significantly differ among the four groups (EOAC, EOMC, LOAC, and LOMC; p = 0.999).
Compared with LOCC, EOCC has distinct differences in demographic distribution and clinicopathological features. Prognosis remains a primary focus in comparisons between EOCC and LOCC. Although EOCRC is predicted to have a poor prognosis because of its unfavorable histopathological features, most studies report survival outcomes comparable to those of LOCRC [5, 6]. One potential explanation is that younger patients may possess greater physical resilience and tolerance to treatment‐related toxicity [4]. In this study, survival analyses indicated that compared with LOCC, EOCC had a better prognosis overall. Specifically, CSS and SSS were best for EOAC and worst for LOMC. However, the oncological outcomes were comparable between EOCC and LOCC when patients were stratified by histology (adenocarcinoma vs. mucinous adenocarcinoma). These results suggest that differences in prognosis between EOCC and LOCC are influenced by tumor biology, particularly the differences between adenocarcinoma and mucinous subtypes. Subset analyses in patients with nonmetastatic colon cancer revealed no significant differences in CSS or SSS between EOMC and LOMC. In contrast, although the CSS was comparable between EOAC and LOAC, SSS was better for LOAC than for EOAC. These results reaffirm the well‐established influence of histological type on prognosis, as mucinous histology is often associated with distinct biological behaviors and treatment responses.
The difference between the SSS and CSS in nonmetastatic colon adenocarcinoma is particularly noteworthy. SSS, which adjusts for the confounding effects of adjuvant therapies, suggests that EOAC may have inherently poorer prognoses, which is likely attributable to aggressive tumor biology, such as rapid local progression or elevated recurrence rates. In contrast, CSS, which incorporates systemic therapy effects, was not significantly different. This disparity could be attributed to better drug tolerability in younger patients, who often possess superior physiological reserve and fewer comorbidities, enabling more aggressive treatments that mitigate survival differences. In metastatic patients, who primarily receive comprehensive systemic therapy, CSS was prioritized as the primary endpoint. Here, CSS was better for EOAC than LOAC but did not differ between EOMC and LOMC. This pattern further supports the hypothesis that improved drug tolerability in younger patients improves outcomes, particularly in adenocarcinoma subtypes, for which targeted therapies and chemotherapy play a pivotal role [5, 14]. These results emphasize that prognostic differences between EOCC and LOCC are not solely attributable to intrinsic aggressive behaviors in EOCC but are heavily influenced by confounding factors such as stage at diagnosis and histological subtype. Instead, stratified and subset analyses suggest that age at onset exerts a limited and subtle influence on prognosis, which is readily modulated by factors such as histological type, disease stage, and systemic therapy.
The prognosis of EOCRC remains complex and often conflicting compared with that of LOCRC. For instance, a population‐based study of 34,434 patients with colorectal cancer using DFS as the endpoint revealed that for stages I–III, stage‐adjusted DFS was better among younger patients than among older patients [15]. Additionally, younger patients were also more likely to receive adjuvant chemotherapy [15]. Similarly, a nationwide survey across 19 hospitals involving 991 EOCRC patients and 3581 LOCRC patients revealed that despite more aggressive features and intensified treatment in EOCRC patients, health‐related quality of life was similar between groups [16]. In contrast, a retrospective analysis from six international tertiary cancer centers, which included 498 patients with colorectal adenocarcinoma, indicated that progression‐free survival was longer among LOCRC patients (aged > 44 years) [17]. Another study of 4468 patients demonstrated worse 3‐year DFS among EOCRC patients than among LOCRC patients, despite better 3‐year overall survival among EOCRC patients [8]. A systemic review of 37 articles on EOCRC prognosis further highlighted age‐specific variations, with worse survival in patients younger than 30 years but comparable or better outcomes in those aged 40–50 years than in those older than 50 years [14]. Overall, no consensus exists on whether EOCRC confers a more favorable or worse oncological outcome than LOCRC does because the results across studies remain highly inconsistent.
In addition to the pathological and prognostic differences between EOCC and LOCC, this study highlights that marital status and median household income significantly influence oncological outcomes in patients with colon cancer. Unmarried patients had worse prognoses than married patients did, which aligns with systematic reviews that underscore the importance of social support in cancer care [18]. Furthermore, patients with higher median household incomes had better outcomes than those with lower incomes did, potentially because of disparities in care quality [19]. A positive dose–response relationship between household income and health‐related quality of life (HRQoL) has been observed in patients with various malignancies, including colon cancer [20]. Notably, a significant positive correlation exists between the time elapsed from diagnosis or relapse and HRQoL among young adults with colorectal cancer [21].
To improve the understanding of EOCRC, genetic and immunological features have been explored. For example, defective mismatch repair is more prevalent in EOCRC, as are mutations in PIK3CA and KRAS, particularly in left‐sided colon cancers [12]. Studies have also shown that compared with older patients (≥ 50 years), younger patients (< 40 years) with colorectal cancer harbor more TP53 and CTNNB1 mutations but fewer APC, KRAS, BRAF, and FAM123B mutations [22]. These genetic alterations are relevant to tumor biology and therapeutic response in colorectal cancer, although findings concerning the molecular features of EOCRC remain inconclusive. In contrast, immunological profiles consistently indicated lower levels of tumor‐infiltrating lymphocytes and peritumoral lymphocytic reactions in EOCRC than in LOCRC [23, 24].
This study has several limitations that warrant consideration. First, prognostic factors known to potentially influence survival in patients with colon cancer—such as body mass index (BMI), performance status, and hereditary cancer syndromes—were unavailable in the SEER database, potentially introducing residual confounding. Second, the limited sample size of patient cohorts derived from PSM based on EOMC may limit statistical power and introduce selection bias in subset analyses. Third, the absence of recurrence data precluded the assessment of progression‐ or recurrence‐free survival, which are more sensitive indicators of tumor biology and treatment response than overall survival metrics alone. Despite these limitations, this study offers notable strengths that enhance its contributions to the field. By focusing exclusively on colon cancer and excluding rectal cancer, the analysis minimized anatomical and therapeutic confounding (e.g., differences in neoadjuvant approaches), enabling a more precise comparison between EOCC and LOCC. Furthermore, analyses stratified by histology and tumor stage provided refined insights into age‐related prognostic differences, revealing nuances often obscured in unadjusted studies. Finally, the dual use of CSS and SSS as endpoints allowed for a comprehensive evaluation of prognoses under varying treatment contexts, offering a clearer understanding of intrinsic vs. modifiable factors in nonmetastatic colon cancer.
In conclusion, this study demonstrated that the demographic distribution and clinicopathological features of EOCC differ from those of LOCC. Prognostic analyses comparing EOCC and LOCC are complex, and accounting for the influence of tumor stage and histology is essential. To more precisely evaluate the impact of age at onset on the malignant behavior of patients with colon cancer, future studies should incorporate additional covariates (e.g., BMI and HRQoL) and progression/relapse‐related prognostic indicators. Furthermore, determining whether EOCC represents a distinct population warrants a deeper exploration of tumor biology through genetic and molecular profiles.
Author Contributions
X.C. conducted data analysis. T.X. drafted the manuscript. S.W. downloaded and organized patient data. J.W. contributed to the conception and design of the study. All authors were responsible for and approved the final manuscript.
Funding
This work was supported by the Natural Science Foundation of Zhejiang Province, LZ23H030001.
Ethics Statement
Approval of the research protocol by an Institutional Review Board: N/A.
Consent
The authors have nothing to report.
Conflicts of Interest
All authors had full access to all of the data in the study and had final responsibility for the decision to submit for publication. The authors declare no conflicts of interest.
Supporting information
Table S1: Baseline Characteristics of Colon Cancer Patients Stratified by Age of Onset. Table S2: Baseline Characteristics of Colon Cancer Patients Stratified by Histology. Table S3: Multivariable Cox Regression Analysis Results for CSS and SSS in EOCC and LOCC Patients. Table S4: Multivariable Cox Regression Analysis Results for CSS and SSS in Colon Cancer Patients Stratified by Age and Histology (EOAC, LOAC, EOMC, LOMC). Table S5: Multivariable Cox Regression Analysis Results for CSS and SSS in Nonmetastatic Colon Cancer Patients. Table S6: Multivariable Cox Regression Analysis Results for CSS and SSS in Metastatic Colon Cancer Patients.
The reference list from the paper itself. Each links out to its DOI / PubMed record.
- 1R. L. Siegel , L. A. Torre , I. Soerjomataram , et al., “Global Patterns and Trends in Colorectal Cancer Incidence in Young Adults,” Gut 68 (2019): 2179–2185.31488504 10.1136/gutjnl-2019-319511 · doi ↗ · pubmed ↗
- 2E. M. Stoffel and C. C. Murphy , “Epidemiology and Mechanisms of the Increasing Incidence of Colon and Rectal Cancers in Young Adults,” Gastroenterology 158 (2020): 341–353.31394082 10.1053/j.gastro.2019.07.055PMC 6957715 · doi ↗ · pubmed ↗
- 3M. C. W. Spaander , A. G. Zauber , S. Syngal , et al., “Young‐Onset Colorectal Cancer,” Nature Reviews Disease Primers 9 (2023): 21.10.1038/s 41572-023-00432-7PMC 1058942037105987 · doi ↗ · pubmed ↗
- 4C. Garrett , D. Steffens , M. Solomon , and C. Koh , “Early‐Onset Colorectal Cancer: Why It Should Be High on Our List of Differentials,” ANZ Journal of Surgery 92 (2022): 1638–1643.35451218 10.1111/ans.17698 PMC 9546202 · doi ↗ · pubmed ↗
- 5X. H. Gao , J. Li , L. J. Liu , et al., “Trends, Clinicopathological Features, Surgical Treatment Patterns and Prognoses of Early‐Onset Versus Late‐Onset Colorectal Cancer: A Retrospective Cohort Study on 34067 Patients Managed From 2000 to 2021 in a Chinese Tertiary Center,” International Journal of Surgery 104 (2022): 106780.35850466 10.1016/j.ijsu.2022.106780 · doi ↗ · pubmed ↗
- 6S. Wong , D. Ling , R. Yeow , et al., “Clinicopathological Patterns and Survival Outcomes of Colorectal Cancer Among Young Adults in Malaysia: An Institutional Cohort Study,” Singapore Medical Journal 62 (2021): 636–641.34005846 10.11622/smedj.2021051 PMC 8804425 · doi ↗ · pubmed ↗
- 7R. Habib , N. G. Burgess , M. J. Bourke , et al., “Outcomes of Young Patients Diagnosed With Locally Advanced Rectal Cancer,” Journal of Gastrointestinal Oncology 12 (2021): 592–601.34012652 10.21037/jgo-20-300PMC 8107615 · doi ↗ · pubmed ↗
- 8Y. Chen , Z. Chen , J. Huang , et al., “Clinicopathological and Molecular Characteristics of Early‐Onset vs Late‐Onset Colorectal Cancer According to Tumor Location,” International Journal of Clinical Oncology 27 (2022): 749–755.35079898 10.1007/s 10147-021-02101-9 · doi ↗ · pubmed ↗