Effect of Dietary Taurine on the Innate Immune Responses, Digestive Function, and mTOR Signaling in Coho Salmon (Oncorhynchus kisutch)
Linxuan Bian, Ya Wang, Xinran Zhang, Miao Zhang, Dongwu Liu

TL;DR
This study shows that adding taurine to the diet of coho salmon improves their immune responses, digestion, and intestinal health through the mTOR signaling pathway.
Contribution
The study reveals a novel role of dietary taurine in modulating innate immunity and intestinal function via mTOR signaling in coho salmon.
Findings
Dietary taurine enhanced antioxidant enzyme activity and reduced ROS in the small intestine of coho salmon.
Taurine improved intestinal barrier function by upregulating tight junction proteins and inflammatory cytokines.
mTOR signaling appears to regulate immune and digestive processes, as shown by RAPA's suppression of gene expression.
Abstract
In this study, the effect of dietary taurine (Tau) on the innate immune responses, digestive function, and mammalian target of rapamycin (RAPA; mTOR) signaling was investigated in coho salmon (Oncorhynchus kisutch). Coho salmon were fed diets supplemented with 0, 0.2, 0.4, and 0.6 g/kg Tau for 8 weeks. The results demonstrated that the activity of antioxidant enzymes was enhanced, while reactive oxygen species (ROS) production was reduced by dietary Tau in the small intestine. Furthermore, Tau supplementation altered the homeostasis of essential nutrients, including Na, K, and Ca. Dietary Tau enhanced intestinal barrier function by upregulating tight junction proteins, including occludin, ZO‐1, and claudin‐18 gene expression. Dietary Tau also upregulated the gene expression of inflammatory cytokines such as IL‐1β, TNFα, and IL‐6, as well as the gene expression related to mTOR signaling…
Genes, proteins, chemicals, diseases, species, mutations and cell lines named across the full text — each resolved to its canonical identifier and authoritative record.
Click any figure to enlarge with its caption.
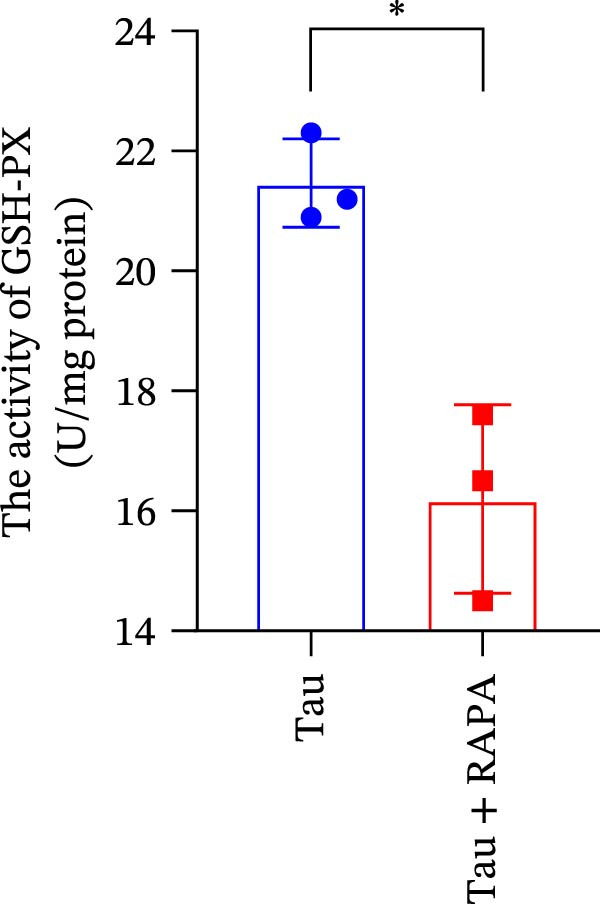 Figure 1
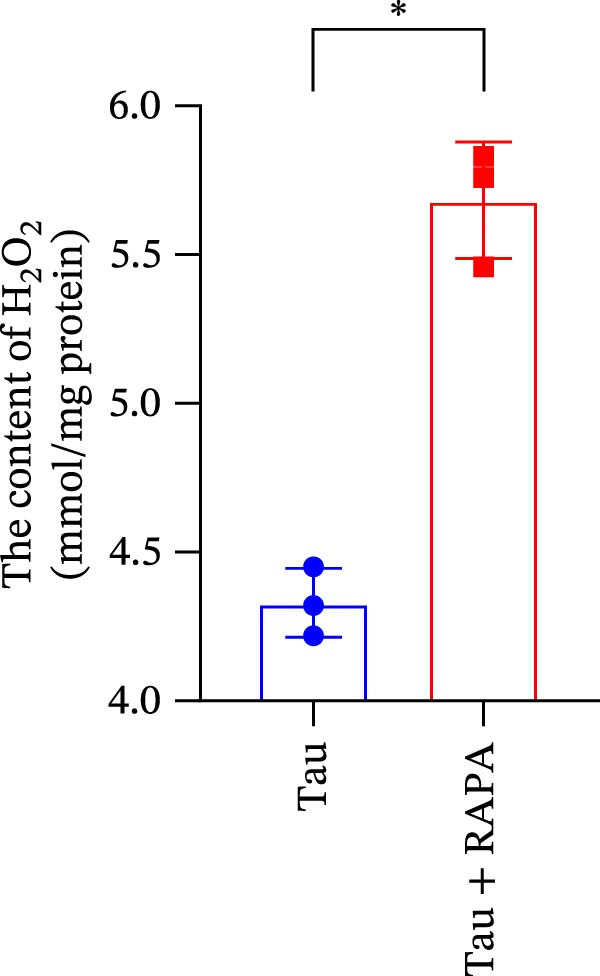 Figure 2
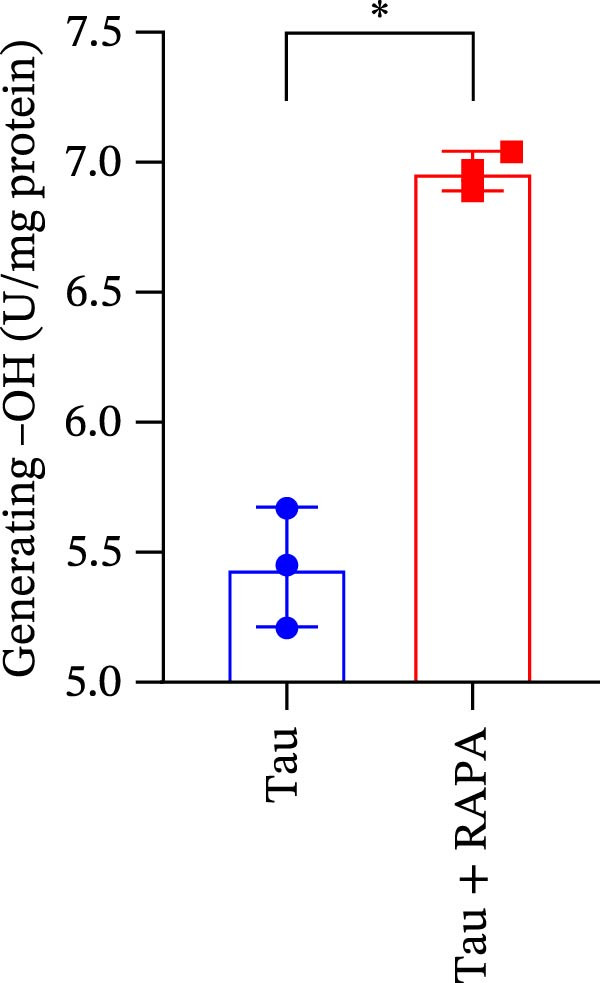 Figure 3
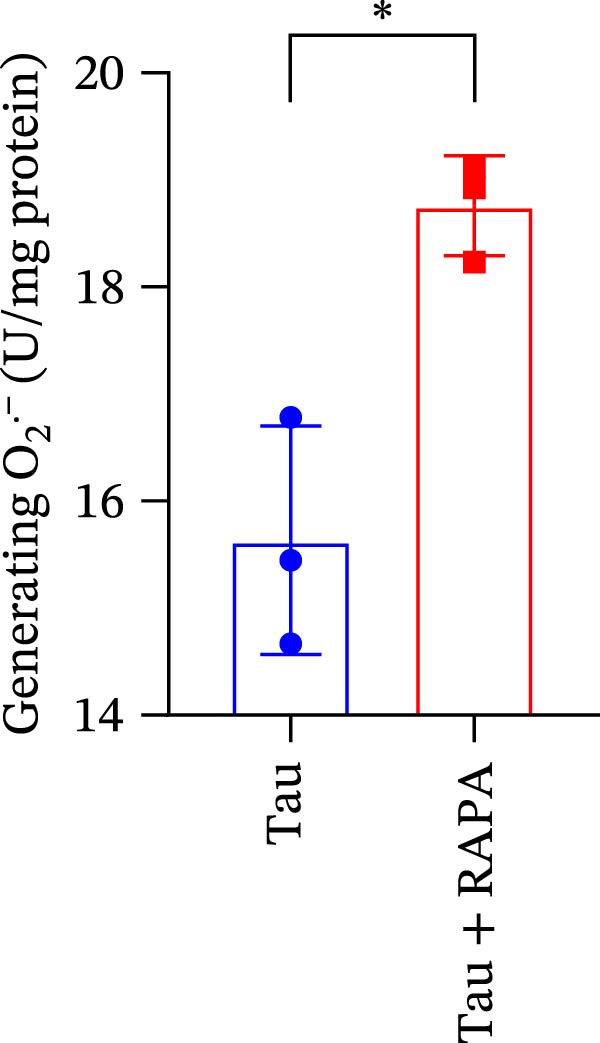 Figure 4
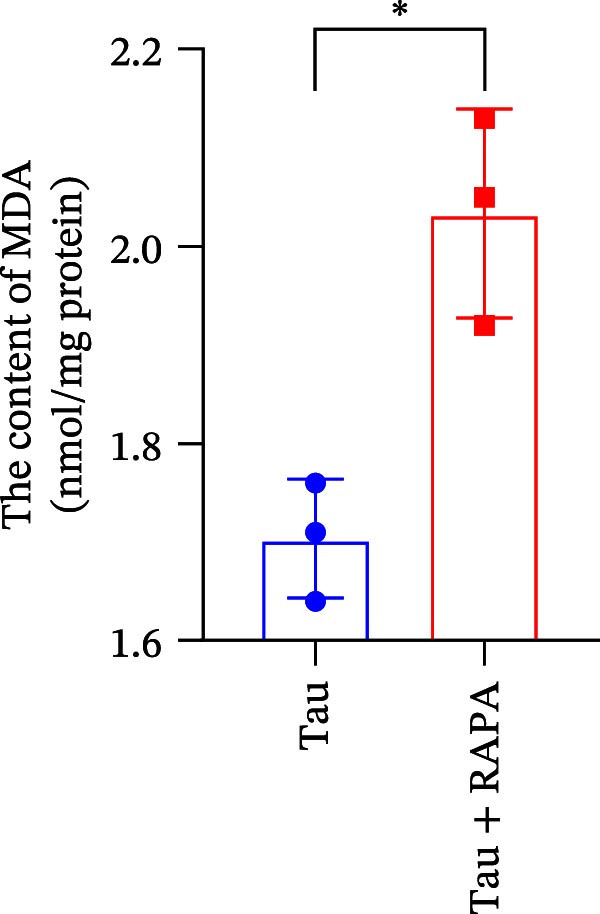 Figure 5
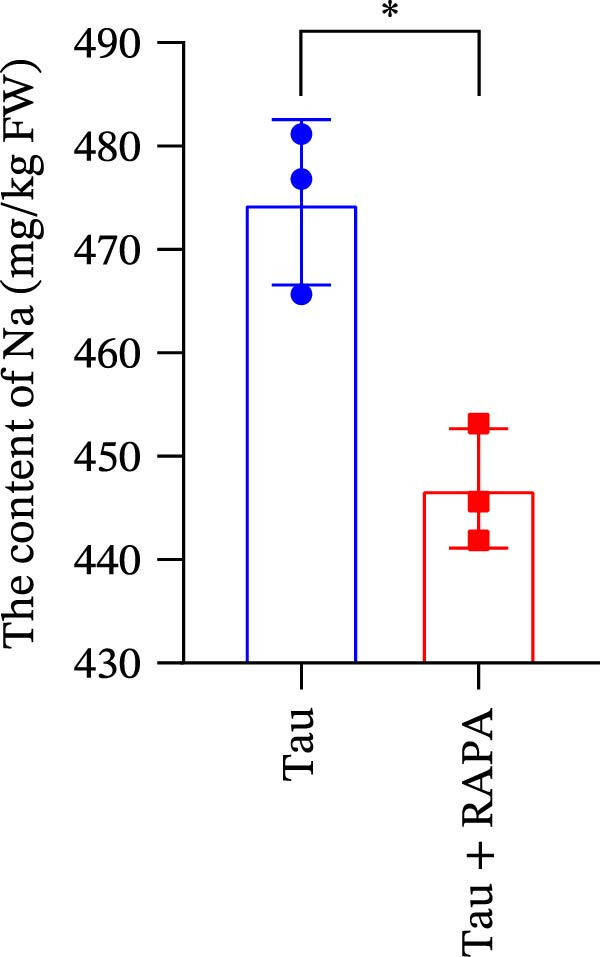 Figure 6
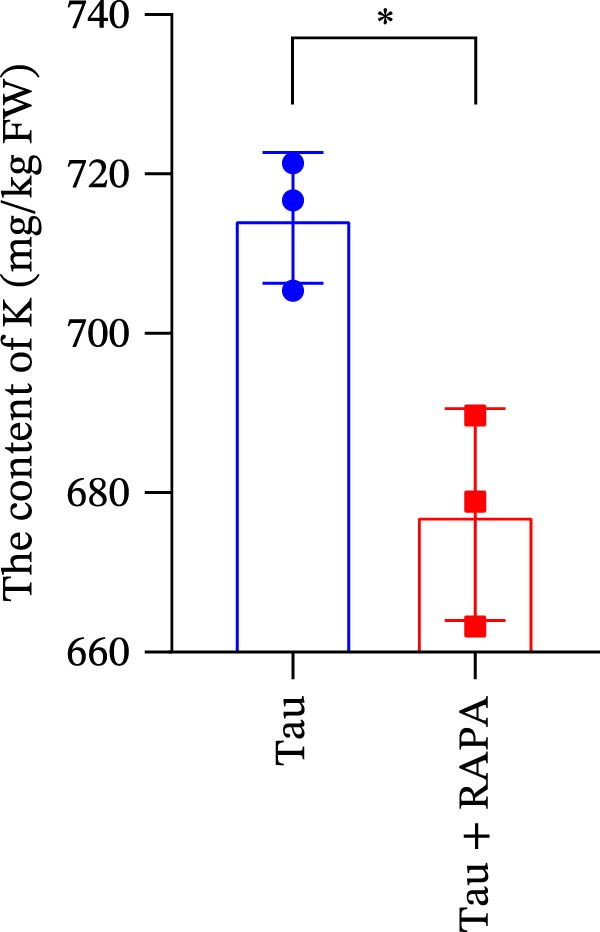 Figure 7
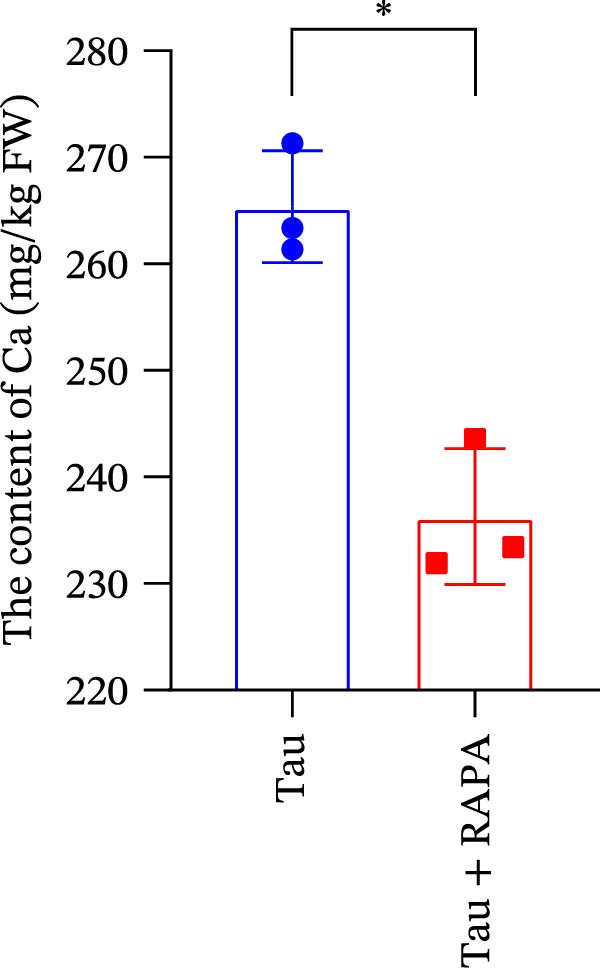 Figure 8
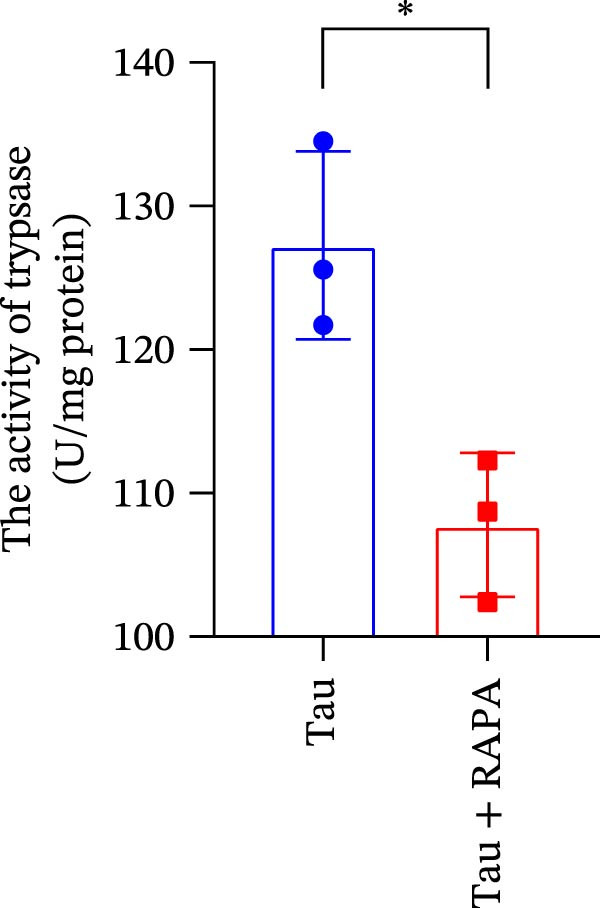 Figure 9
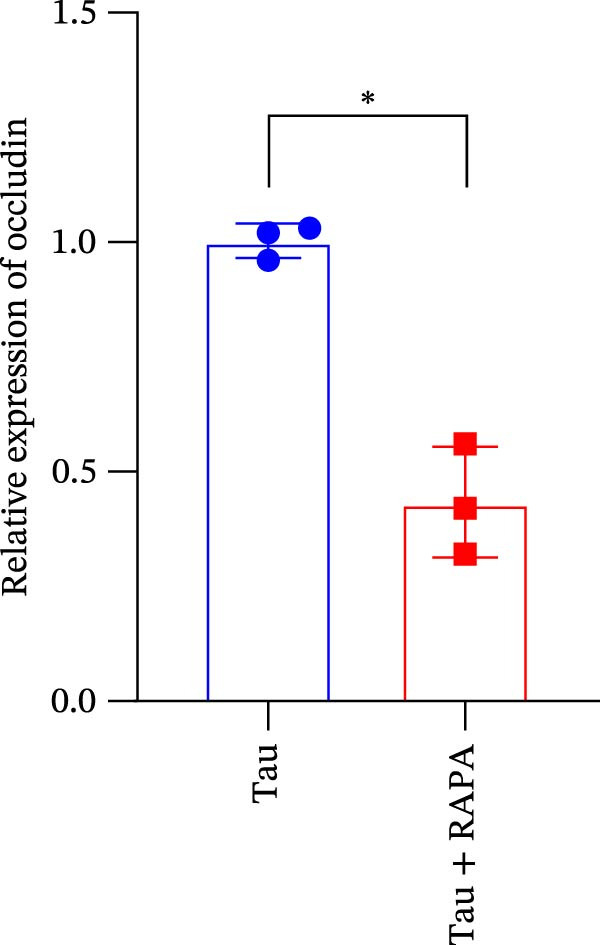 Figure 10
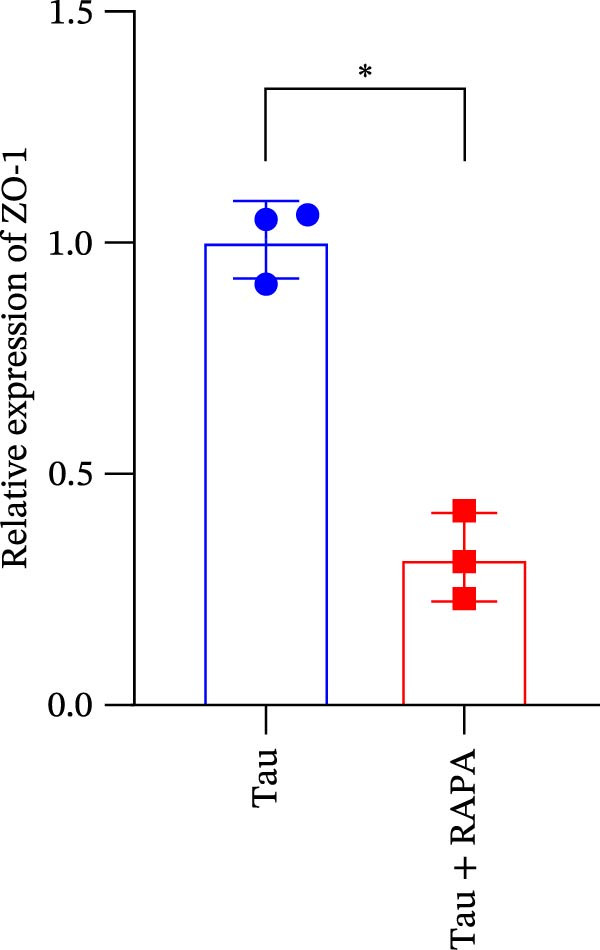 Figure 11
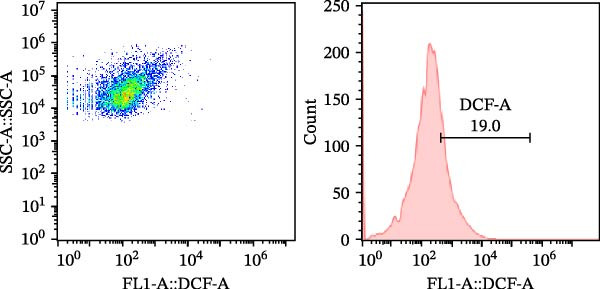 Figure 12
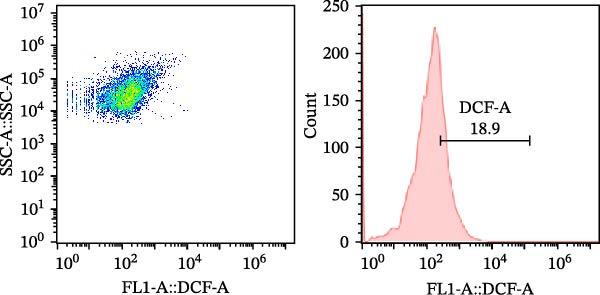 Figure 13
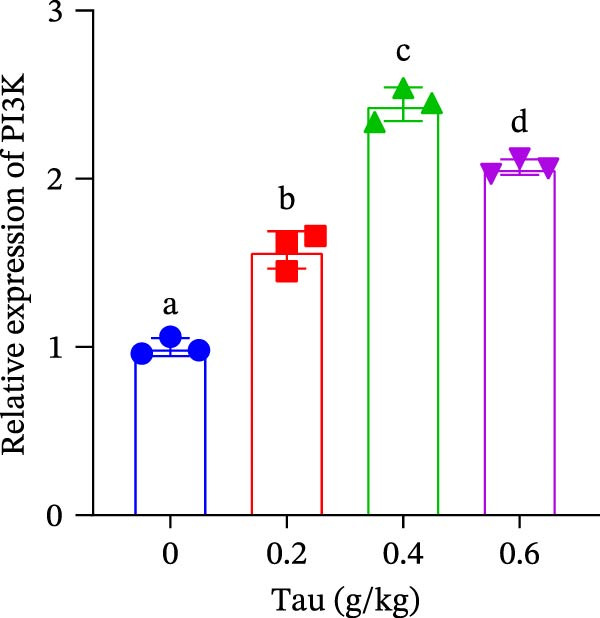 Figure 14
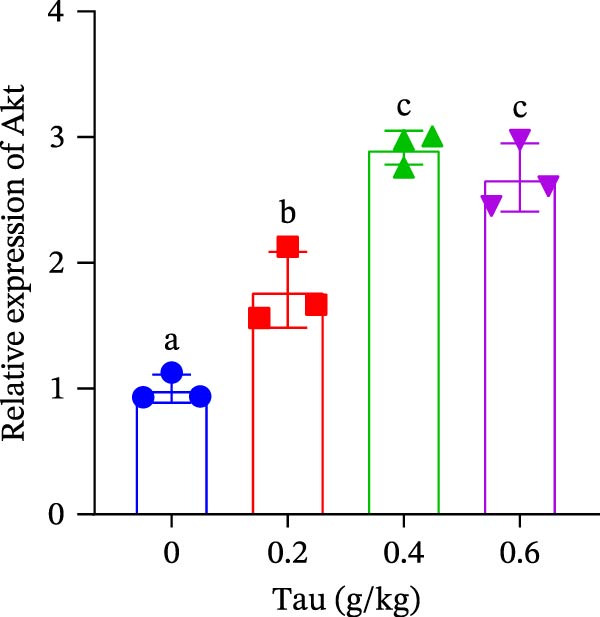 Figure 15
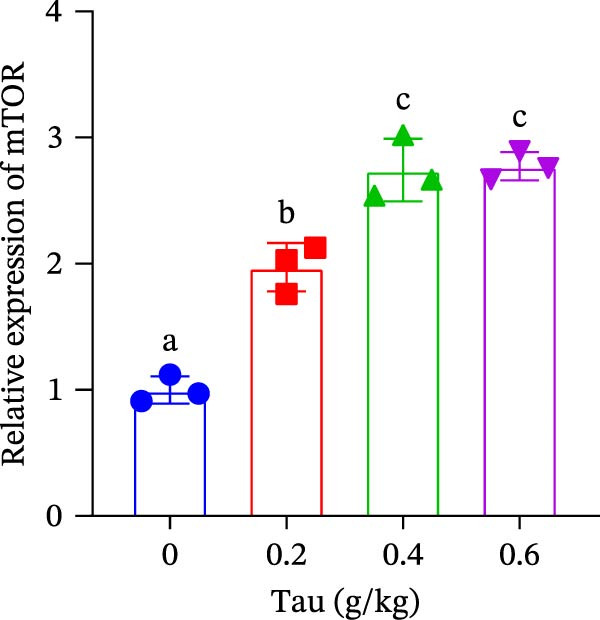 Figure 16
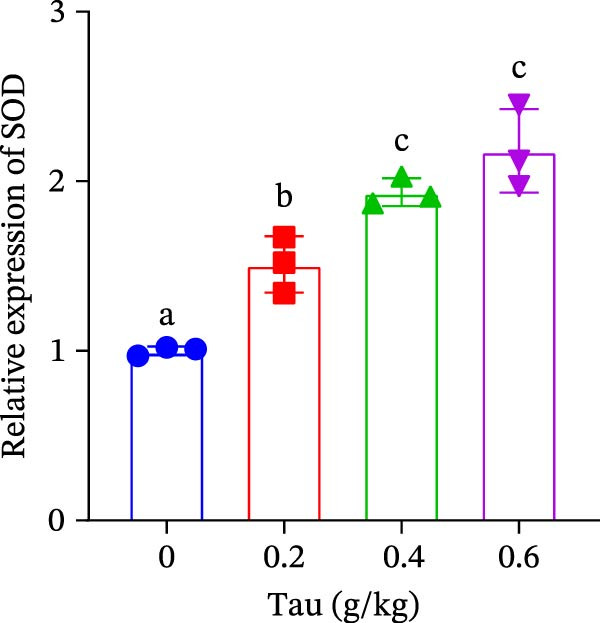 Figure 17
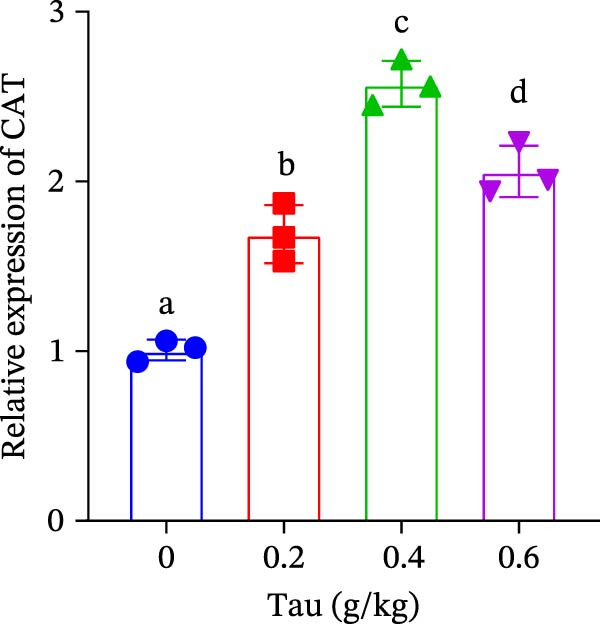 Figure 18
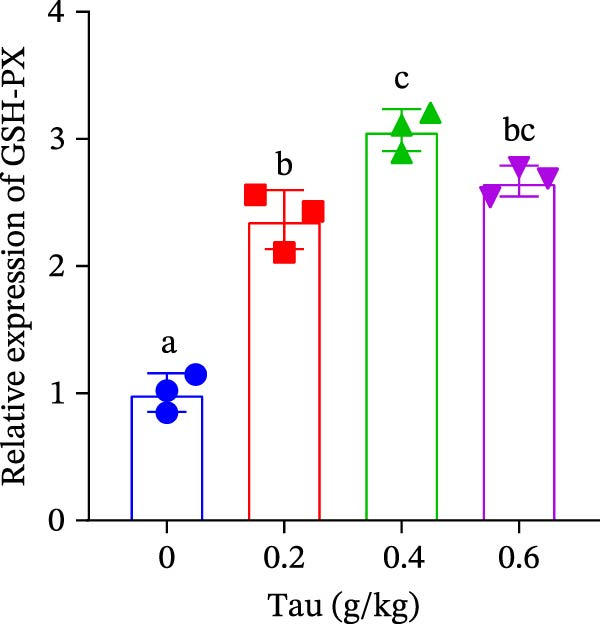 Figure 19
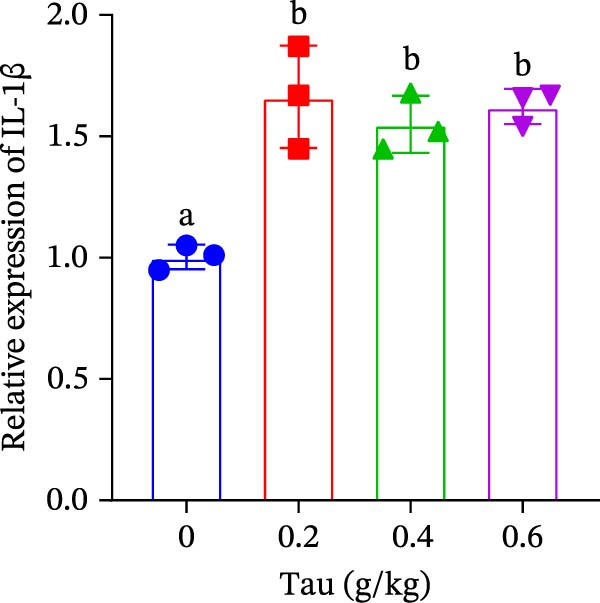 Figure 20
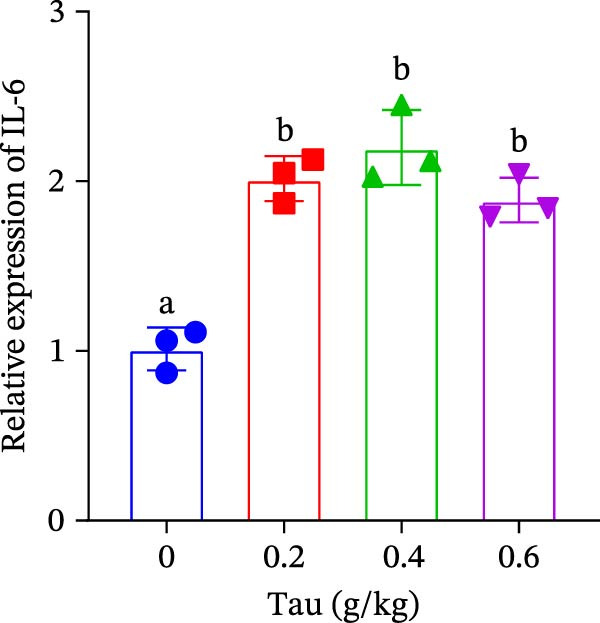 Figure 21
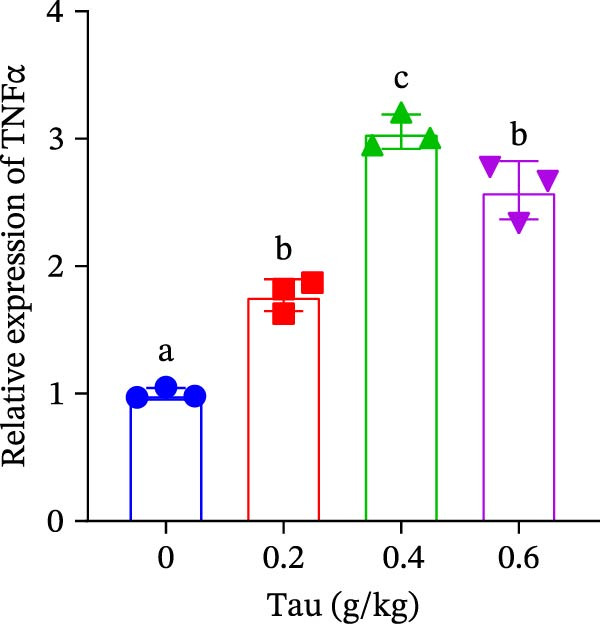 Figure 22
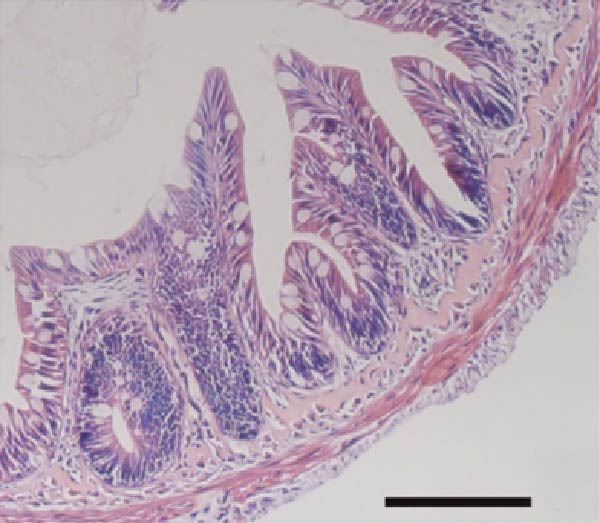 Figure 23
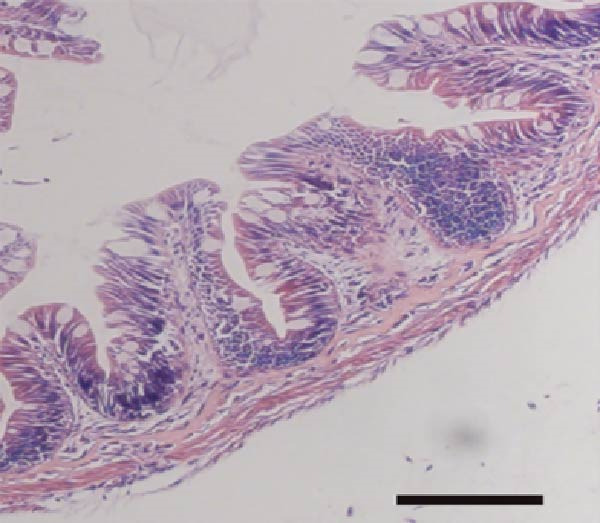 Figure 24
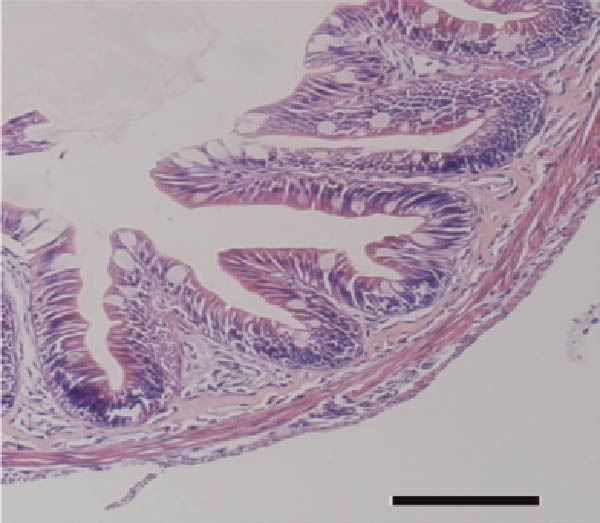 Figure 25
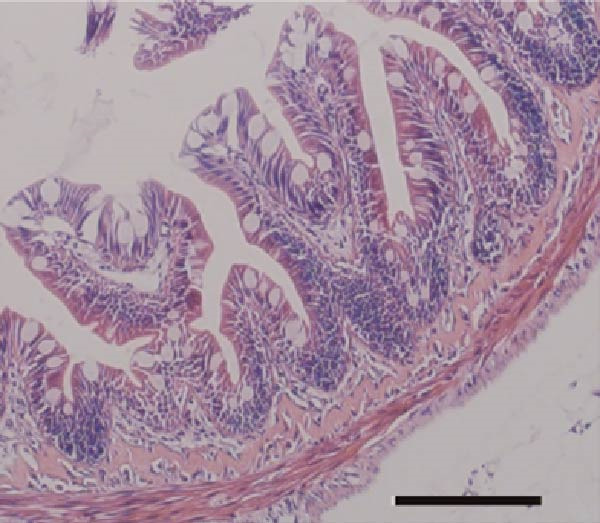 Figure 26
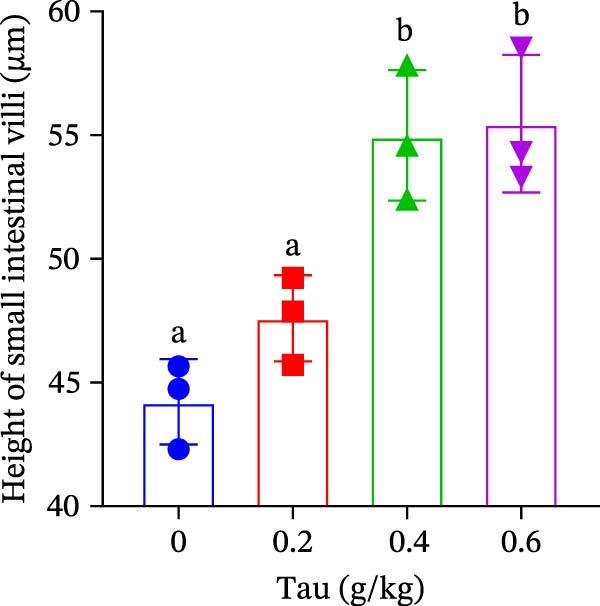 Figure 27
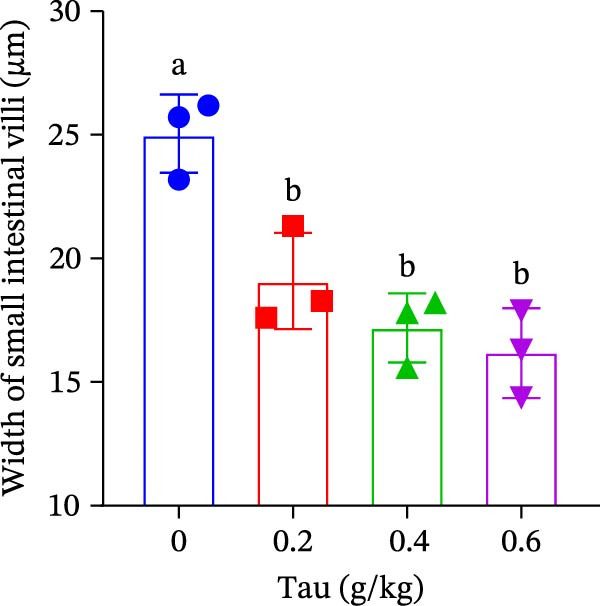 Figure 28
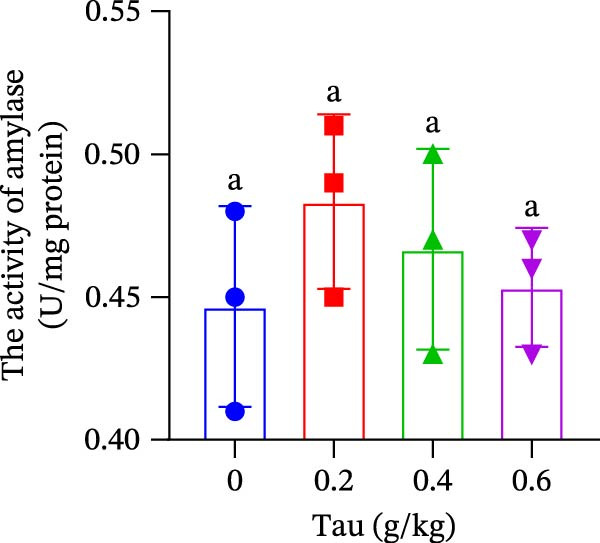 Figure 29
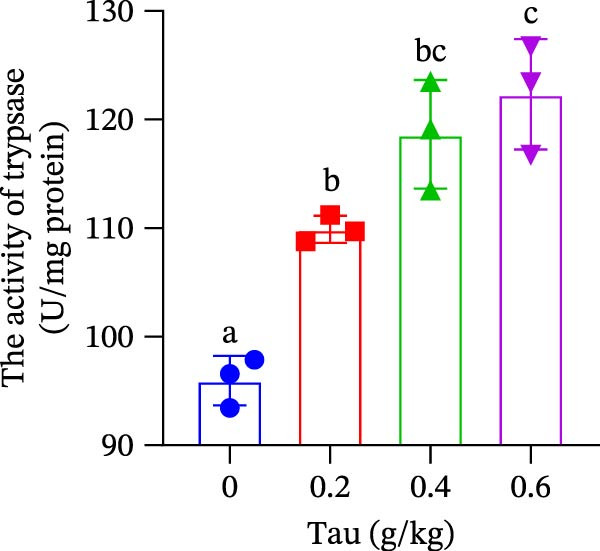 Figure 30
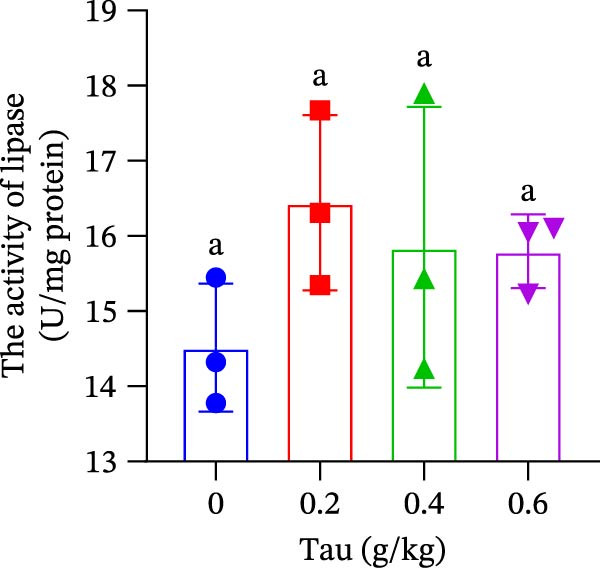 Figure 31
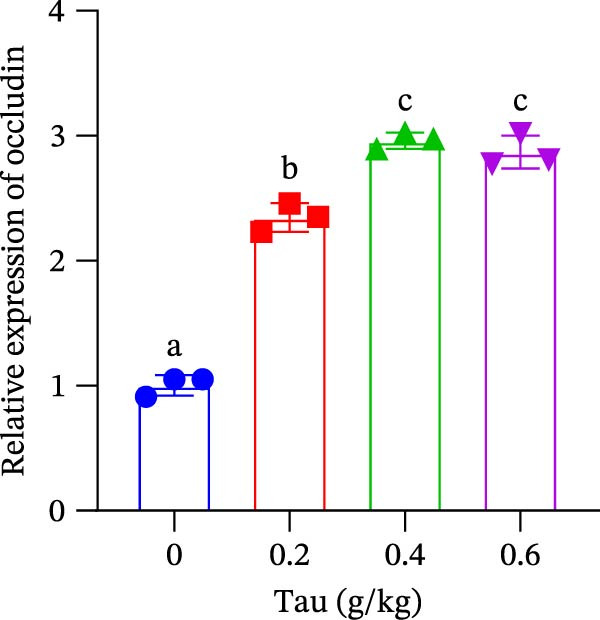 Figure 32
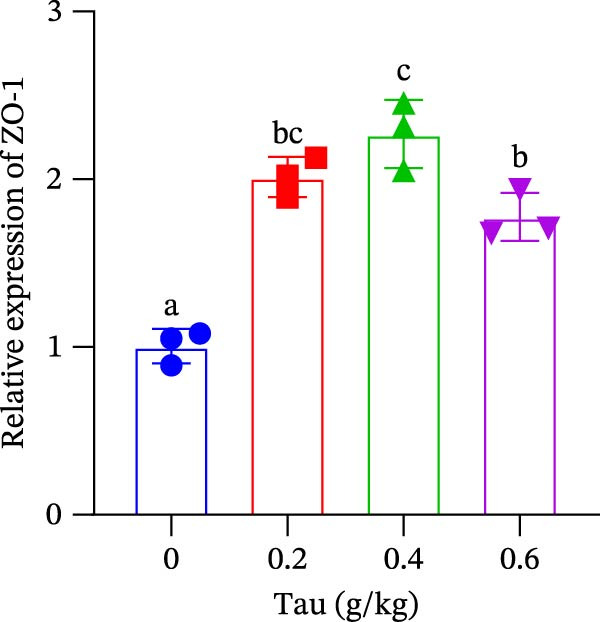 Figure 33
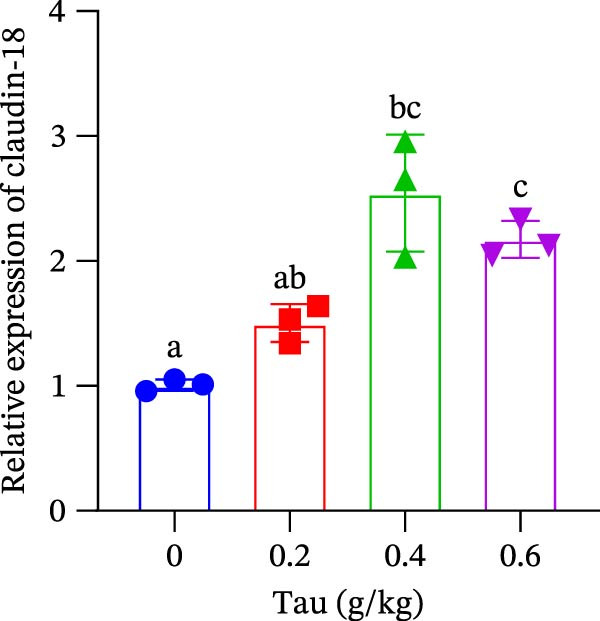 Figure 34
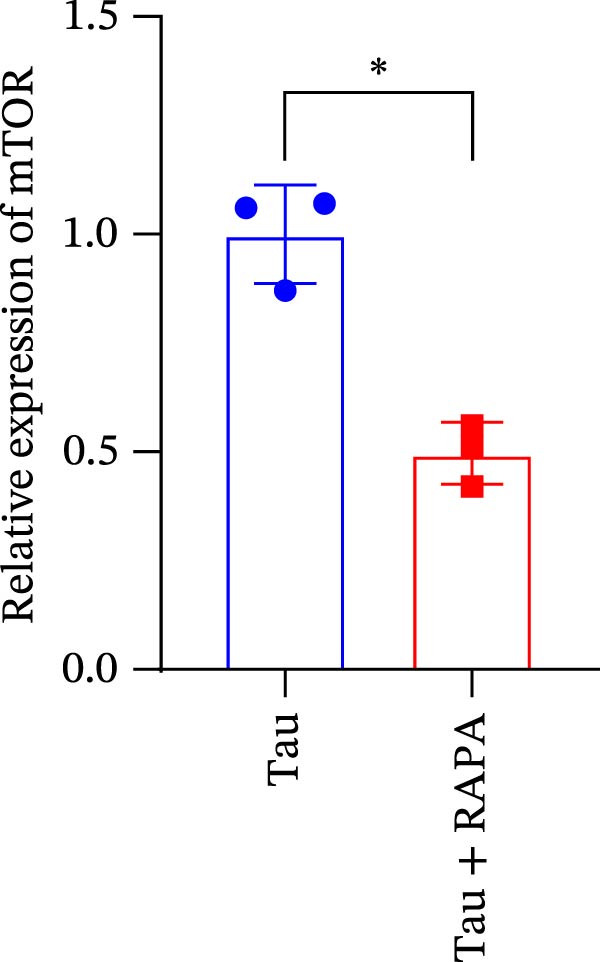 Figure 35
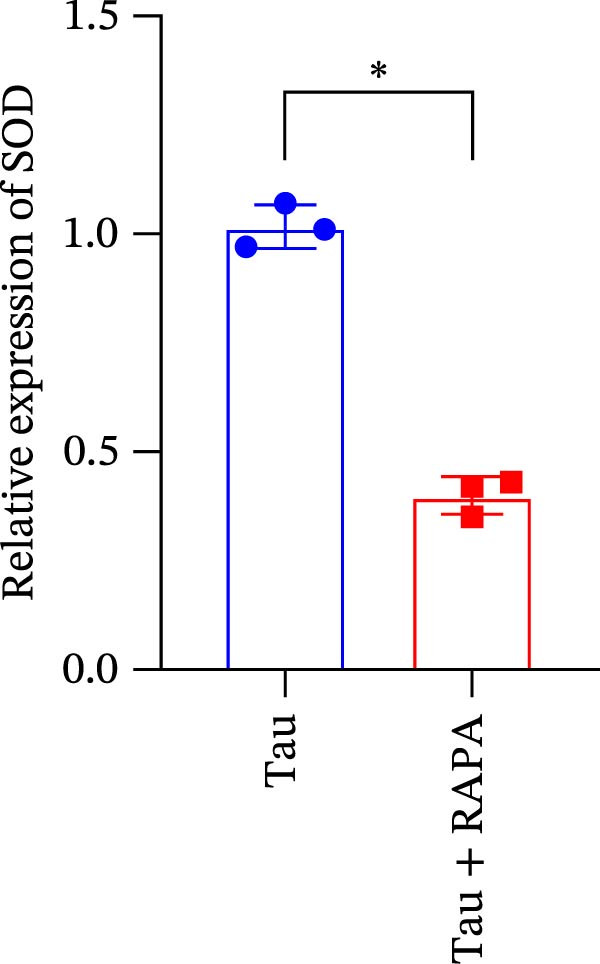 Figure 36
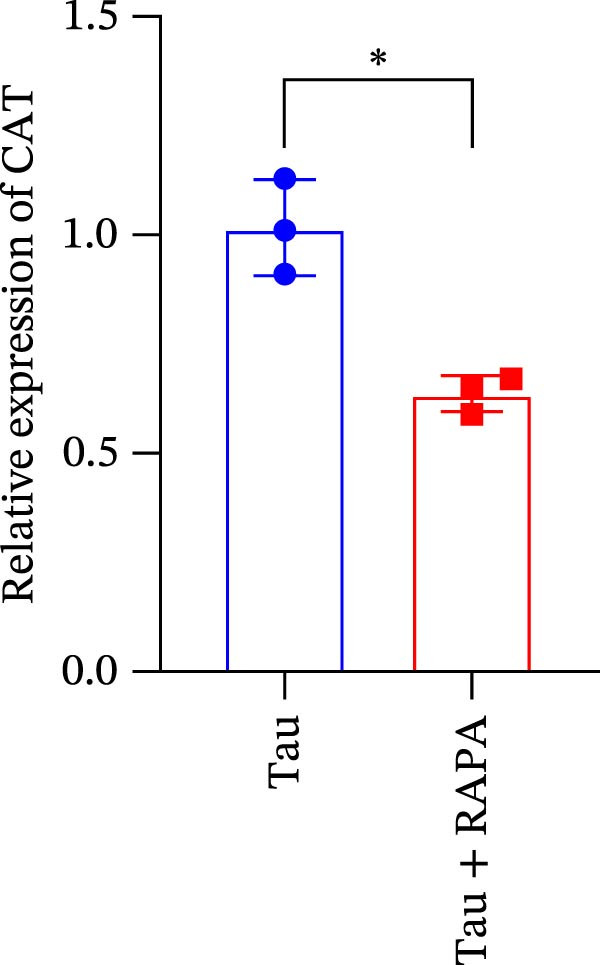 Figure 37
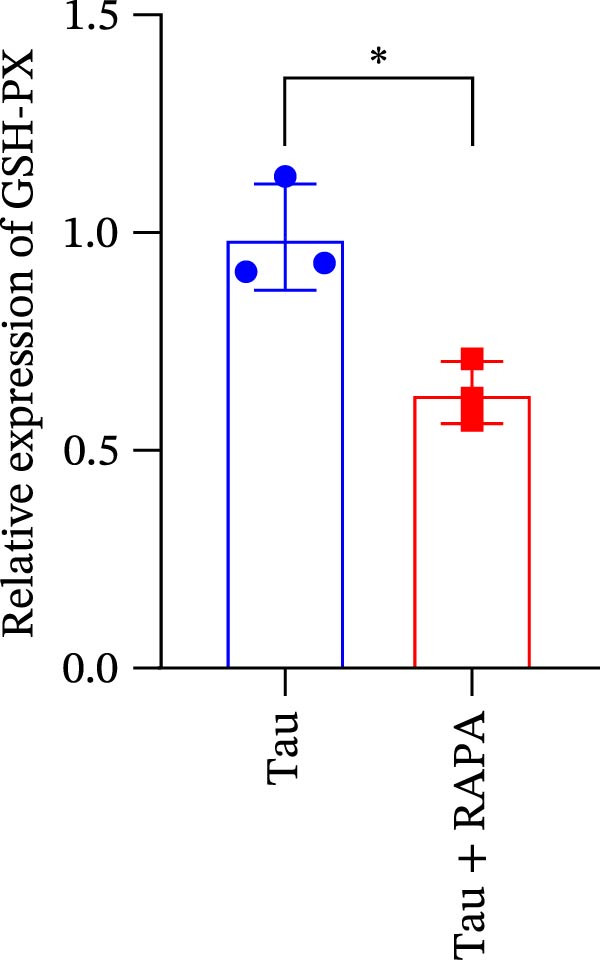 Figure 38
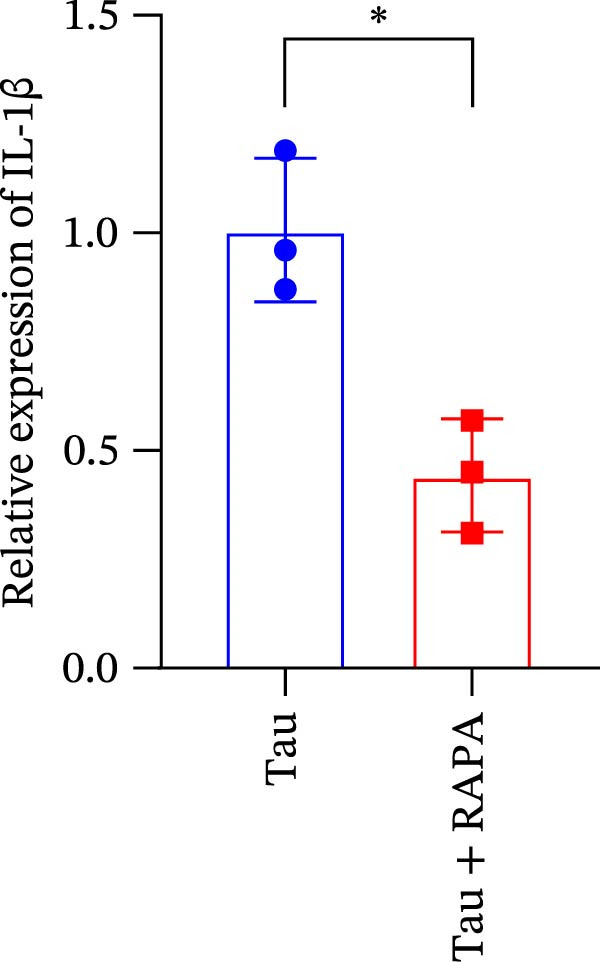 Figure 39
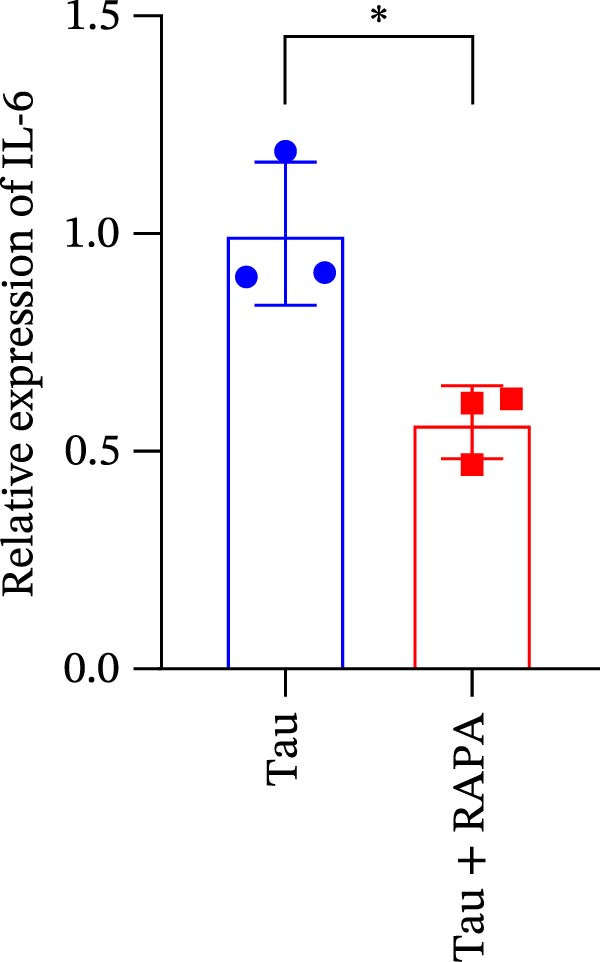 Figure 40
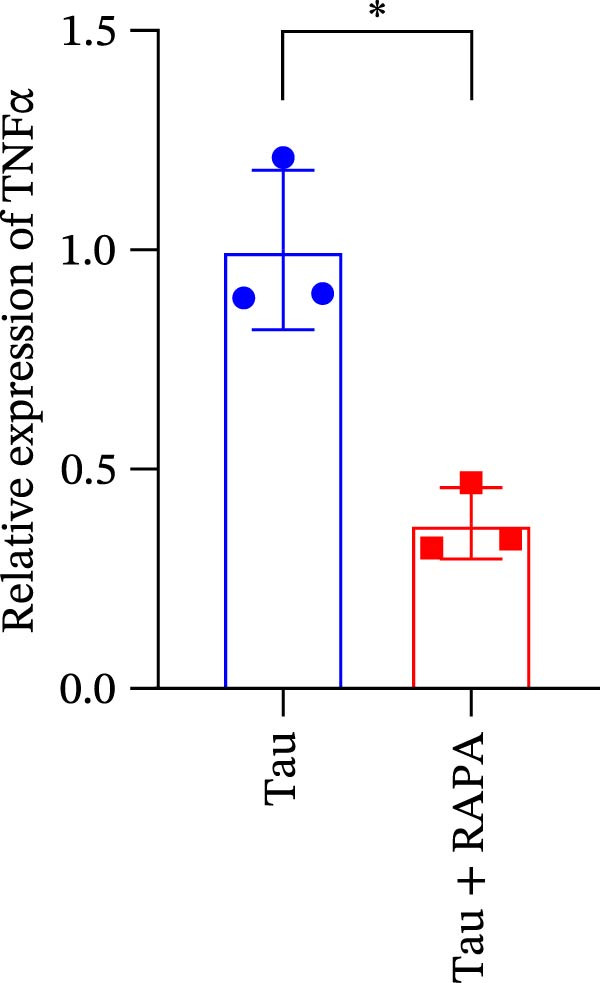 Figure 41
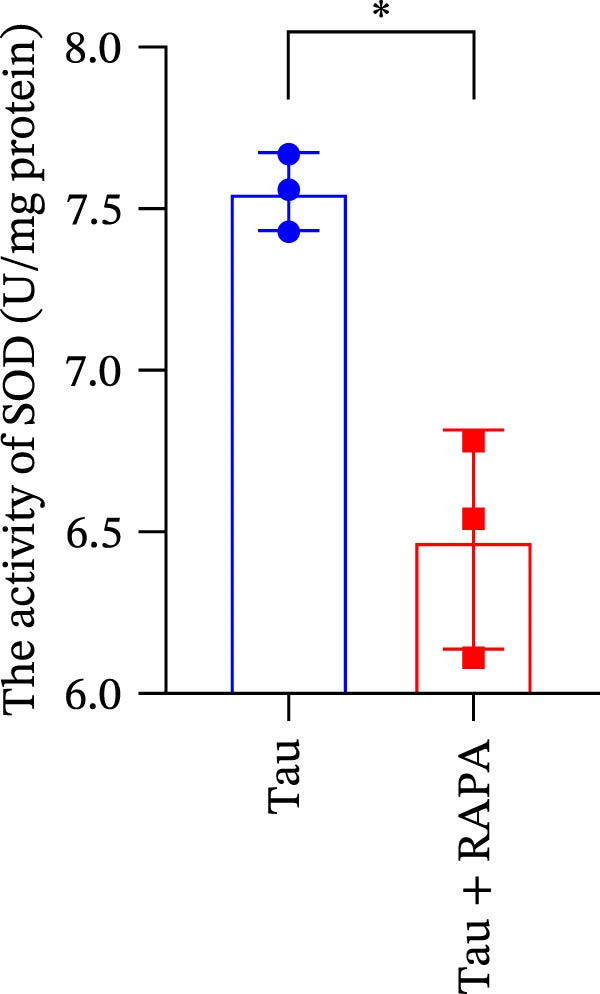 Figure 42
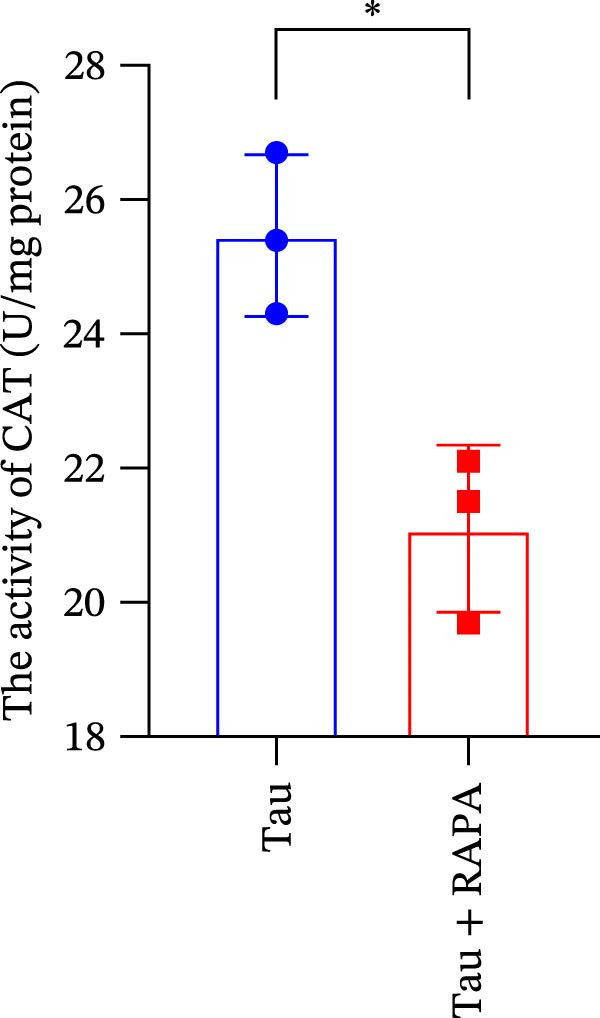 Figure 43
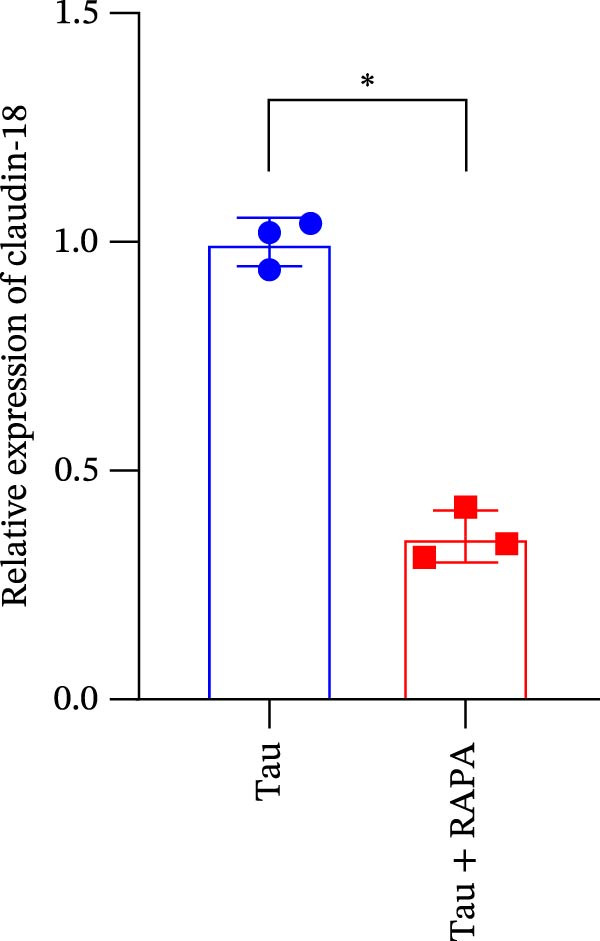 Figure 44
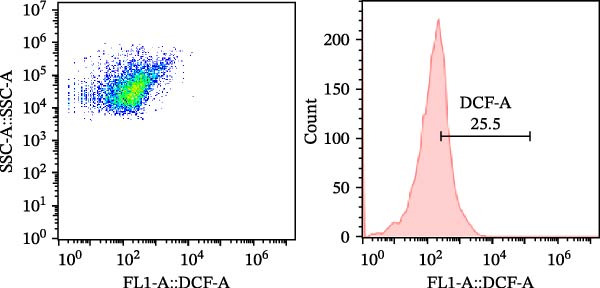 Figure 45
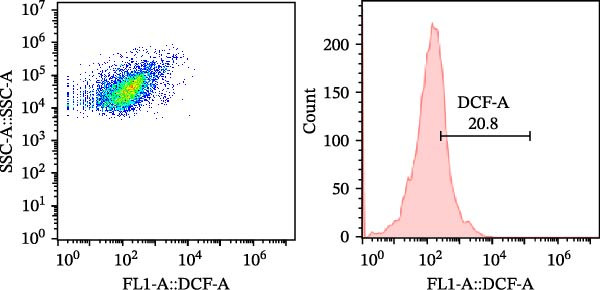 Figure 46
| Ingredients (g) | Taurine levels (g/kg) | |||
|---|---|---|---|---|
| 0 | 0.2 | 0.4 | 0.6 | |
| Caseina | 420 | 420 | 420 | 420 |
| Gelatinea | 110 | 110 | 110 | 110 |
| Dextrina | 160 | 160 | 160 | 160 |
| α‐Cellulosea | 30 | 29.8 | 29.6 | 29.4 |
| Fish oilb | 100 | 100 | 100 | 100 |
| Soybean oilb | 100 | 100 | 100 | 100 |
| Mineral premixc | 60 | 60 | 60 | 60 |
| Vitamin premixd | 10 | 10 | 10 | 10 |
| Ethoxyquin | 6 | 6 | 6 | 6 |
| Choline chloride | 3 | 3 | 3 | 3 |
| Ascorbic acid phosphate | 0.5 | 0.5 | 0.5 | 0.5 |
| Glycine betaine | 0.5 | 0.5 | 0.5 | 0.5 |
| Taurinee | 0 | 0.2 | 0.4 | 0.6 |
| Proximate composition | ||||
| Crude protein (%) | 45.07 | 45.05 | 45.03 | 45.06 |
| Crude lipid (%) | 18.07 | 18.03 | 18.05 | 18.07 |
| Ash (%) | 6.11 | 6.12 | 6.1 | 6.11 |
| Moisture (%) | 7.31 | 7.3 | 7.31 | 7.33 |
| Taurine (g/kg) | 0 | 0.2 | 0.4 | 0.6 |
| Ingredients | Dietary Tau level (g/kg) | |||
|---|---|---|---|---|
| 0 | 0.2 | 0.4 | 0.6 | |
| Essential amino acid | ||||
| Thr | 16.2 | 16.4 | 16.2 | 16.5 |
| Ile | 15.7 | 15.4 | 15.3 | 15.6 |
| Leu | 31.2 | 31.5 | 31.4 | 31.2 |
| Val | 22.4 | 22.1 | 22.6 | 22.3 |
| Met | 12.5 | 12.6 | 12.3 | 12.2 |
| Phe | 22.1 | 22.5 | 22.4 | 22.0 |
| Lys | 22.4 | 22.1 | 22.7 | 22.5 |
| His | 10.3 | 10.5 | 10.6 | 10.3 |
| Arg | 23.1 | 23.4 | 23.2 | 23.5 |
| Nonessential amino acid | ||||
| Tyr | 15.6 | 15.3 | 15.4 | 15.6 |
| Ser | 17.5 | 17.2 | 17.3 | 17.5 |
| Gly | 20.3 | 20.5 | 20.1 | 20.4 |
| Ala | 22.4 | 22.1 | 22.3 | 22.1 |
| Pro | 54.3 | 54.2 | 54.5 | 54.3 |
| Asp | 32.1 | 32.5 | 32.4 | 32.5 |
| Glu | 75.6 | 75.4 | 75.6 | 75.3 |
| Tau | 0.03 | 0.22 | 0.43 | 0.62 |
| Target gene | Forward (5′‐3′) | Reverse (5′‐3′) | GenBank |
|---|---|---|---|
| PI3K | CCAGTGGCTCAAGGACAAGAACAG | GGATGAAGGTGGCTACGCAGTATC | XM_020466892.1 |
| Akt | GAGTTCACGGCACAGACCATCAC | CGTATGCTGGCGGAGTAAGAGAAC | XM_020503531.1 |
| mTOR | GCAACAGCGACAGCGAGGTAG | TGGAGAGGGAGATTGAGCGGAAG | XM_020506200.1 |
| IL‐1β | GCGACATGGTGCGTTTCCTTTT | TGTCTACCGGTTTGGTGTAGTCCT | |
| IL‐6 | GAGCTACGTAACTTCCTGGTTGAC | GCAAGTTTCTACTCCAGGCCTGAT | XM_014143031.1 |
| TNFα | TTTACAGCCAGGCTTCGTTTAGGG | CGCCAATTTTGGACTCAGCATCAC | |
| CAT | GGAGCGTTCGGGTACTTTGAGGT | TTGTTGCCAGTAAGGTCCCAGTT | |
| SOD | AGATGGTGCTGAAGGCTGTTTGC | TCCTCCGTGGGTCTTGTTGTGGG | |
| GSH‐PX | GTCAACTCTTCTCCCAGTCCACC | CTAAACGGCACCATATTCCCAAT | |
| Occludin | AGTAGAATCTGACTCAAACCACC | AAGTACAACAGGCTAAAGGACA | |
| ZO‐1 | TTGTATCCGGGATGTGCTTGTG | AGGTGTCCGATGATGACATAGTGC | |
| Claudin‐18 | AACCGGAAGCTGCTAACGATTA | TTCACAGAGTGCCGACCCTACT | |
| EF1α | ACCGGCCATCTGATCTACAAATGC | CTCTCGCTCAGCCTTCAGCTT |
| Nutrient element (mg/kg FW) | Dietary Tau levels (g/kg) | |||||||
|---|---|---|---|---|---|---|---|---|
| 0 | 0.2 | 0.4 | 0.6 | ANOVA | Linear trend | Quadratic trend | Cubic trend | |
| Fe | 52.23 ± 3.66a | 54.37 ± 1.12a | 53.43 ± 2.97a | 53.30 ± 3.12a | 0.842 | 0.751 | 0.746 | 0.842 |
| K | 677.33 ± 10.93a | 701.47 ± 10.17ab | 708.47 ± 8.61b | 711.23 ± 12.13b | 0.016 | 0.004 | 0.005 | 0.016 |
| Ca | 236.83 ± 4.19a | 258.60 ± 6.08b | 272.30 ± 6.60bc | 275.73 ± 3.81c | 0.000 | 0.000 | 0.000 | 0.000 |
| Mg | 279.17 ± 9.49a | 278.00 ± 7.07a | 281.50 ± 6.00a | 281.47 ± 7.49a | 0.922 | 0.572 | 0.852 | 0.922 |
| Cu | 21.50 ± 0.26a | 21.43 ± 0.47a | 20.97 ± 0.55a | 21.77 ± 1.46a | 0.700 | 0.875 | 0.654 | 0.700 |
| Na | 422.30 ± 9.50a | 436.37 ± 5.59ab | 445.47 ± 5.92b | 467.90 ± 8.03c | 0.000 | 0.000 | 0.000 | 0.000 |
| Zn | 34.43 ± 3.20a | 36.30 ± 2.16a | 34.20 ± 1.90a | 35.13 ± 0.93a | 0.662 | 1.000 | 0.939 | 0.662 |
| Antioxidant enzyme activity and ROS levels | Dietary Tau levels (g/kg) | |||||||
|---|---|---|---|---|---|---|---|---|
| 0 | 0.2 | 0.4 | 0.6 | ANOVA | Linear trend | Quadratic trend | Cubic trend | |
| CAT (U/mg protein) | 23.46 ± 0.32a | 25.18 ± 0.64b | 26.17 ± 0.15c | 26.10 ± 0.16bc | 0.000 | 0.000 | 0.000 | 0.000 |
| GSH‐PX (U/mg protein) | 19.43 ± 0.39a | 21.84 ± 0.21b | 22.68 ± 0.30b | 22.60 ± 0.57b | 0.000 | 0.000 | 0.000 | 0.000 |
| SOD (U/mg protein) | 6.52 ± 0.28a | 7.63 ± 0.27b | 9.03 ± 0.16c | 7.49 ± 0.35b | 0.000 | 0.083 | 0.001 | 0.000 |
| MDA (nmol/mg protein) | 2.38 ± 0.22a | 2.03 ± 0.11ab | 1.84 ± 0.10c | 1.81 ± 0.14c | 0.005 | 0.001 | 0.001 | 0.005 |
| H2O2 (mmol/mg protein) | 5.69 ± 0.09a | 5.05 ± 0.07b | 4.60 ± 0.24c | 4.39 ± 0.18c | 0.000 | 0.000 | 0.000 | 0.000 |
| ·OH (U/mg protein) | 5.68 ± 0.23a | 5.12 ± 0.11b | 4.82 ± 0.09b | 5.08 ± 0.15b | 0.001 | 0.012 | 0.000 | 0.001 |
| O2 ·- (U/mg protein) | 19.51 ± 0.31a | 17.47 ± 0.22b | 16.69 ± 0.23bc | 15.81 ± 0.57c | 0.000 | 0.000 | 0.000 | 0.000 |
|
Free amino acids (μg/g FW) | Dietary Tau levels (g/kg) | |||||||
|---|---|---|---|---|---|---|---|---|
| 0 | 0.2 | 0.4 | 0.6 | ANOVA | Linear trend | Quadratic trend | Cubic trend | |
| Essential amino acid | ||||||||
| Thr | 139.60 ± 5.60a | 159.10 ± 3.94b | 159.40 ± 7.37b | 171.90 ± 3.92b | 0.001 | 0.000 | 0.001 | 0.001 |
| Ile | 34.17 ± 1.63a | 38.67 ± 1.42b | 42.23 ± 1.00c | 41.13 ± 1.30bc | 0.000 | 0.001 | 0.000 | 0.000 |
| Leu | 48.63 ± 1.36a | 55.27 ± 1.69b | 57.80 ± 1.10b | 58.83 ± 2.18b | 0.000 | 0.000 | 0.000 | 0.000 |
| Val | 37.17 ± 2.41a | 39.57 ± 1.75ab | 43.33 ± 1.36b | 43.50 ± 2.80b | 0.018 | 0.002 | 0.007 | 0.018 |
| Met | 5.37 ± 0.21a | 5.84 ± 0.16a | 7.03 ± 0.42b | 7.33 ± 0.25b | 0.000 | 0.000 | 0.000 | 0.000 |
| Phe | 17.90 ± 0.76a | 20.03 ± 1.10a | 25.70 ± 2.10b | 25.07 ± 1.82b | 0.001 | 0.000 | 0.001 | 0.001 |
| Lys | 54.20 ± 1.73a | 62.30 ± 3.40b | 63.67 ± 2.17b | 65.30 ± 2.82b | 0.004 | 0.001 | 0.001 | 0.004 |
| His | 36.23 ± 3.82a | 43.03 ± 2.29ab | 47.97 ± 2.02b | 48.67 ± 2.66b | 0.002 | 0.000 | 0.000 | 0.002 |
| Arg | 52.87 ± 1.53a | 56.93 ± 1.66ab | 62.60 ± 2.96bc | 63.57 ± 2.30c | 0.001 | 0.000 | 0.000 | 0.001 |
| Nonessential amino acid | ||||||||
| Tyr | 37.80 ± 1.10a | 44.93 ± 1.24b | 48.33 ± 1.44b | 52.63 ± 1.56c | 0.000 | 0.000 | 0.000 | 0.000 |
| Ser | 29.00 ± 1.25a | 35.33 ± 2.77ab | 40.03 ± 3.36bc | 46.37 ± 3.15c | 0.000 | 0.000 | 0.000 | 0.000 |
| Gly | 74.57 ± 2.89a | 83.17 ± 3.87ab | 89.20 ± 4.47bc | 93.83 ± 3.48c | 0.001 | 0.000 | 0.000 | 0.001 |
| Ala | 54.16 ± 2.78a | 64.10 ± 4.64b | 64.33 ± 2.82b | 65.17 ± 2.76b | 0.011 | 0.010 | 0.006 | 0.011 |
| Pro | 36.63 ± 2.10a | 39.77 ± 0.55ab | 42.63 ± 0.85b | 43.17 ± 2.14b | 0.003 | 0.000 | 0.001 | 0.003 |
| Asp | 6.40 ± 0.26a | 7.37 ± 0.38a | 8.73 ± 0.55b | 9.10 ± 0.53b | 0.000 | 0.000 | 0.000 | 0.000 |
| Glu | 14.33 ± 0.25a | 16.73 ± 1.15a | 20.07 ± 1.46b | 22.93 ± 1.42b | 0.000 | 0.000 | 0.000 | 0.000 |
|
Free amino acids (μg/g FW) | 0.6 g/kg Tau | 0.6 g/kg Tau + RAPA |
|---|---|---|
| Thr | 177.53 ± 6.63a | 160.73 ± 2.93b |
| Ile | 37.93 ± 1.63a | 31.10 ± 1.35b |
| Leu | 65.27 ± 2.78a | 53.80 ± 2.51b |
| Val | 50.30 ± 1.78a | 43.80 ± 2.02b |
| Met | 6.80 ± 0.36a | 5.83 ± 0.25b |
| Phe | 24.70 ± 2.07a | 17.60 ± 0.98b |
| Lys | 64.43 ± 2.99a | 52.10 ± 2.10b |
| His | 40.73 ± 1.84a | 32.40 ± 1.10b |
| Arg | 57.77 ± 3.91a | 50.03 ± 2.08b |
| Tyr | 53.77 ± 2.17a | 45.43 ± 2.15b |
| Ser | 43.10 ± 1.73a | 34.37 ± 2.20b |
| Gly | 91.23 ± 1.93a | 83.40 ± 2.20b |
| Ala | 59.30 ± 2.82a | 52.77 ± 2.08b |
| Pro | 39.00 ± 2.89a | 29.17 ± 1.84b |
| Asp | 8.13 ± 0.35a | 6.67 ± 0.45b |
| Glu | 20.53 ± 1.85a | 15.77 ± 1.36b |
- —Natural Science Foundation of Shandong Province10.13039/501100007129
Peer Reviews
No public reviews on file for this paper yet. If you reviewed it on a platform where reviews are public (OpenReview, ICLR, NeurIPS, ICML), you can paste yours below so the community can read it here.
Videos
No videos yet. Explain this paper in a talk, walkthrough, or lecture? Add one.
Taxonomy
TopicsAldose Reductase and Taurine · Aquaculture Nutrition and Growth · Aquaculture disease management and microbiota
1. Introduction
Taurine (2‐aminoethanesulfonic acid, Tau) is a sulfur‐containing β‐amino acid that plays a vital role in various physiological processes in aquatic animals. Unlike mammals, some fish species have a limited capacity to synthesize Tau endogenously due to the low activity of cysteine sulfinic acid decarboxylase, a key enzyme in Tau biosynthesis [1, 2]. Consequently, dietary Tau supplementation is essential to meet the metabolic demands of fish, particularly in the intensive aquaculture systems where plant‐based proteins are increasingly replacing fishmeal [3]. Moreover, Tau is involved in numerous biological functions, including osmoregulation, bile salt formation, antioxidant defense, immune modulation, and retinal development [4–6]. Its importance in aquaculture has been widely recognized, and Tau has been considered as a critical nutrient for optimizing growth, health, and reproduction in farmed fish species [7–9]. In the recent years, the immunomodulatory properties of Tau have garnered significant attention due to its ability to enhance disease resistance and improve overall health in aquaculture species.
Previously, Tau supplementation has been shown to significantly enhance growth performance in various fish species, especially when plant‐based proteins are used in feed formulations [3, 10]. For Tau is usually deficient in fish feed, the supplementation of Tau is necessary to prevent deficiencies and ensure optimal fish growth and health [2]. Previous studies have demonstrated that Tau supplementation improves fish growth rates, feed efficiency, and protein utilization [11–14]. These benefits are attributed to Tau’s role in enhancing nutrient absorption and metabolism, particularly in carnivorous species that rely on dietary Tau for optimal growth [15–17]. The optimal dietary inclusion level of Tau varies depending on fish species, life stage, and dietary composition but generally ranges from 0.5% to 2% [1].
In addition, Tau is a key immunomodulatory nutrient in fish aquaculture, with numerous studies highlighting its ability to enhance immune responses and improve disease resistance [18, 19]. Tau has been shown to boost innate immune responses by increasing the activity of immune cells [18, 20]. Previously, it was observed that Tau supplementation inhibits the production of reactive oxygen species (ROS), which play a critical role in pathogen elimination [6]. Similarly, Tau supplementation in low‐fishmeal diets has been shown to positively affect the immunity, intestinal health, and growth of Litopenaeus vannamei [21].
The enzymatic antioxidant systems are central to the innate immune response, acting as critical defenders against oxidative damage to cellular components. The antioxidant enzymes function in a coordinated cascade, forming the first line of immune defense. Variations in their activity levels are often used as sensitive biomarkers to assess oxidative stress and cellular damage [22, 23]. Among these enzymes, superoxide dismutase (SOD) plays a primary role by converting the harmful superoxide anion (O_2_ ^·-^) into hydrogen peroxide (H_2_O_2_) [24]. Subsequently, catalase (CAT) and glutathione peroxidase (GSH‐PX) further decompose H_2_O_2_ into water and oxygen, effectively neutralizing oxidative stress [24]. The exogenous food environment, which includes various external factors related to food intake, is closely linked to the small intestine. This connection is particularly significant because dietary stressors can readily activate the innate immune response in the intestinal tract, which serves as a critical first line of defense against pathogens and harmful agents [25]. Additionally, oxidative stress poses a persistent challenge to the small intestine, leading to chronic ROS generation. Excessive ROS production could disrupt cellular metabolism and impair intestinal function, potentially resulting in inflammation and other adverse health effects [26].
The phosphatidylinositol‐3‐kinase/Akt/mammalian target of rapamycin (RAPA) (PI3K/Akt/mTOR) signaling pathway plays a role in modulating oxidative stress responses. This pathway is involved in numerous cellular processes, including cell growth, proliferation, and metabolism [27, 28]. In particular, mTOR plays a crucial role in maintaining cellular health and function under oxidative stress conditions. In addition, Tau plays a key role in modulating digestive function in fish, primarily through its involvement in bile acid conjugation and digestive enzyme activity. As a key component for the synthesis of taurocholic acid, Tau conjugates with bile acids to form bile salts, which are essential for the emulsification, digestion, and absorption of dietary lipids [2]. This process is particularly vital for marine fish species, which have a high dietary lipid requirement and limited capacity for de novo Tau synthesis [11, 29]. Despite the well‐documented roles of Tau in oxidative stress and immune responses, there remains a significant gap in understanding the effects of dietary Tau on mTOR signaling, digestive function, and innate immune responses in aquatic species. Therefore, the aim of this study was to investigate the impact of dietary Tau on the interplay between digestive function, innate immune responses, and mTOR signaling in the small intestine of coho salmon (Oncorhynchus kisutch).
2. Materials and Methods
2.1. Experimental Diets
Four isonitrogenous and isoenergetic experimental diets were formulated to evaluate the effects of graded Tau levels on coho salmon (O. kisutch). Crystalline Tau (≥98% purity, Beijing Solarbio Science & Technology Co., Ltd.) was supplemented into the basal diet at concentrations of 0, 0.2, 0.4, and 0.6 g/kg to produce four experimental diets. The detailed ingredient composition and analyzed amino acid profile are presented in Tables 1 and 2, respectively, confirming that the diets differed primarily in their Tau content. For dietary Tau at 0, 0.2, 0.4, and 0.6 g/kg promoted mTOR gene expression, 20 mg/kg RAPA (Beijing Solarbio Science & Technology Co., Ltd.) was further added into 0.6 g/kg Tau diet to acquire another diet for mTOR inhibitor treatment (mTOR inhibitor diet).
All ingredients were finely ground and mixed following a stepwise procedure to ensure homogeneity. The mixtures were then processed into pellets (2.0 × 3.0 mm) using a single‐screw extruder (Model DGP70‐II, Xingtai, China). The resulting pellets were dried in a forced‐air oven at 40°C to a moisture content below 10%. Finally, the finished feeds were packed in sealed bags and stored at −20°C until use to preserve nutrient quality.
2.2. Animals and Tau Treatment
Prior to the experiment, a total of 360 healthy coho salmon (~5.4 g) underwent a 2‐week acclimation period in the laboratory environment, during which salmons were fed a commercial diet to acclimate to the rearing conditions. Following acclimation, the fish were randomly distributed into 12 identical circular plastic tanks (300 L) in a flow‐through system, resulting in 30 fish per tank. The experimental design followed a completely randomized block design, with each of the four experimental diets randomly assigned to three replicate tanks.
The feeding trial was conducted over an 8‐week period. The fish were hand‐fed their respective assigned experimental diets to apparent satiation twice daily at 08:00 and 16:00. Throughout the experimental period, environmental parameters were strictly monitored and maintained within optimal ranges for coho salmon. The water quality was maintained as follows: dissolved oxygen at 9.5 ± 0.8 mg/L, water temperature at 16 ± 0.5°C, and pH at 6.9 ± 0.3. The system was supplied with sand‐filtered freshwater and provided with continuous aeration to maintain oxygen saturation. A natural light–dark cycle was maintained throughout the study period.
2.3. mTOR Inhibitor Treatment
An additional 180 coho salmon (~5.4 g) were distributed into six plastic tanks, with 30 fish per tank. Three tanks served as the control group, while the other three were used for mTOR inhibitor treatment. During the experiment, the fish in the control group were fed twice daily with 0.6 g/kg Tau diet until apparent satiation. However, the fish in mTOR inhibitor treatment group were fed with mTOR inhibitor diet, which contains 20 mg/kg RAPA and 0.6 g/kg Tau. Two weeks later, the fish were sampled following the same procedures as the Tau diet treatment.
2.4. Sampling Procedures
After completion of the 8‐week feeding trial, fish were fasted for 24 h and euthanized with MS‐222 (150 mg/L). For each dietary treatment, 18 fish per tank were randomly selected for sample collection. To comprehensively evaluate the immune and digestive status, the entire intestinal tract was aseptically dissected. From the dissected intestines, six independent composite samples per tank were prepared for analysis by pooling mid‐intestine segments from three fish. The samples were immediately snap‐frozen in liquid nitrogen and stored at −80°C for subsequent gene expression and enzyme activity assays. Concurrently, additional mid‐intestine segments from three other fish per tank were collected, flushed with ice‐cold saline, and fixed in 4% paraformaldehyde for histological examination of intestinal morphology.
2.5. Assay of Antioxidant Indexes and Digestive Enzyme Activities
The frozen intestine samples were thawed on ice and weighed. Each sample was then homogenized in nine volumes (w/v) of ice‐cold 0.1 M phosphate‐buffered saline (PBS, pH 7.4) using a mechanical homogenizer. The homogenate was subsequently centrifuged at 12,000 × g for 10 min at 4°C. The resulting supernatant was carefully collected and aliquoted for immediate assay. The total protein concentration in the supernatant was determined using a commercial kit based on the Coomassie Brilliant Blue method, following the manufacturer’s instructions, to standardize the subsequent enzymatic activity data.
A comprehensive suite of biochemical assays was performed on the supernatant. The activities of key antioxidant enzymes, including SOD, CAT, and GSH‐PX, were measured using spectrophotometric kits. Concurrently, the concentrations of oxidative stress markers, including hydrogen peroxide (H_2_O_2_), malondialdehyde (MDA), hydroxyl radical (·OH), and superoxide anion (O_2_ ^·-^), were quantified to assess the level of oxidative damage. Furthermore, to evaluate the digestive capacity, the activities of major digestive enzymes, including amylase, trypsin, and lipase, were analyzed. All assays utilized commercial kits (Nanjing Jiancheng Bioengineering Institute, China) and were performed strictly according to the respective protocols.
2.6. Assay ROS Levels by Flow Cytometry
Small intestine tissues were placed in 1.5 mL centrifuge tubes and digested with 1 mL trypsin solution at 37°C for 30 min. The resulting cell suspension was filtered through a 300‐mesh nylon net, mixed with 2 mL PBS, and centrifuged to remove the supernatant. The cells were resuspended in 0.5 mL PBS and labeled with 2^′^, 7^′^‐dichlorodihydrofluorescein diacetate (DCFH‐DA). Fluorescence intensity was analyzed using a flow cytometer (FACSCaliber, Becton Dickinson, Heidelberg) with an excitation wavelength of 488 nm.
2.7. Real‐Time Quantitative Polymerase Chain Reaction (qPCR)
The primer sequences for target genes are listed in Table 3. Gene expression was quantified using a quantitative thermal cycler (Roche LightCycler 480, Switzerland) with SYBR Premix Ex Taq II (Takara, Japan) as the fluorescent dye‐based detection system. The 2^-ΔΔCT^ method was used to analyze and compare gene expression levels across samples.
2.8. Nutrient Element Analysis
Intestinal samples were immersed in nitric acid for 24 h to ensure complete extraction of nutritional metal elements. Then, the samples were heated at 90°C for an additional 4 h, as described in a previous study [30]. The content of nutritional metal elements in the digested samples was then analyzed using an inductively coupled plasma optical emission spectrometer (ICP‐OES, Optima 5300DV, Perkin Elmer Corporation). Simultaneously, the levels of free amino acids in the intestinal samples and diets were quantified using an automatic amino acid analyzer (Hitachi L‐8900, Japan), following the methodology outlined in a previous study [31].
2.9. Histological Analysis
Intestinal samples were fixed in Davidson’s solution for 24 h. After fixation, the samples were embedded in paraffin wax to facilitate sectioning. Using a microtome (Leica RM2016, Germany), the embedded samples were sliced into thin sections (5 μm thick), which were then mounted on glass slides. The sections were stained with hematoxylin and eosin (H&E) and examined under an Olympus microscope (Olympus, Japan) to capture detailed images of intestinal tissue architecture. In addition, the villus height was measured from the crypt–villus junction to the villus tip, while villus width was measured at the midpoint of the villus. Measurements were performed using image analysis software ImageJ. The mean values from all measured villi per sample were calculated and statistically analyzed across experimental groups.
2.10. Statistical Analysis
All data were presented as means ± standard error (SE). Statistical analyses were performed using SPSS 25.0 software. Normality was assessed using the Shapiro–Wilk test, and homogeneity of variance was evaluated using Levene’s test. Significant differences (p < 0.05) were determined using one‐way analysis of variance (ANOVA) followed by Tukey’s HSD post hoc test. Additionally, orthogonal polynomial contrasts were used to perform trend analysis, identifying whether significant effects (p < 0.05) exhibited linear, quadratic, or cubic trends.
3. Results
3.1. Effect of Dietary Tau on the Content of Nutrient Elements
Dietary Tau at 0.2, 0.4, and 0.6 g/kg significantly increased (p < 0.05) the Ca content in the small intestine. Among these concentrations, the highest Ca accumulation was observed at 0.6 g/kg Tau, suggesting a dose‐dependent relationship between dietary Tau intake and Ca accumulation in the small intestine (Table 4). In addition to its effects on Ca, diets containing 0.4 and 0.6 g/kg Tau also significantly influenced (p < 0.05) the levels of K and Na in the small intestine. Specifically, both 0.4 and 0.6 g/kg Tau significantly elevated (p < 0.05) K and Na content, with the highest levels observed at 0.6 g/kg Tau. In contrast, no significant differences were detected in the mineral contents of Fe, Cu, Zn, and Mg across the Tau‐supplemented diets (0.2, 0.4, and 0.6 g/kg) compared to the control group (Table 4). Furthermore, significant linear, quadratic, and cubic trend effects (p < 0.05) were observed for Ca, K, and Na content following 8 weeks of Tau supplementation (Table 4).
3.2. Effect of Dietary Tau on the Activity of Antioxidant Enzymes and ROS Levels
Diets supplemented with 0.2, 0.4, and 0.6 g/kg Tau significantly increased (p < 0.05) the activity of CAT, SOD, and GSH‐PX (Table 5). Among these, the diet containing 0.4 g/kg Tau resulted in the highest activity levels of CAT, SOD, and GSH‐PX (Table 5). In addition to modulating antioxidant enzyme activity, Tau also affected oxidative stress markers, with diets containing 0.4 and 0.6 g/kg Tau significantly reducing (p < 0.05) the levels of MDA (Table 5). Moreover, diets with 0.2, 0.4, and 0.6 g/kg Tau significantly suppressed (p < 0.05) the production of H_2_O_2_, O_2_ ^·-^, and ·OH (Table 5). Furthermore, significant linear, quadratic, and cubic trend effects (p < 0.05) were observed for the activity of CAT and GSH‐PX and ROS levels following 8 weeks of Tau supplementation (Table 5).
3.3. Effect of Dietary Tau on the Total ROS Levels by Flow Cytometer
As a fluorescent probe, DCFH‐DA could be oxidized to 2’, 7’‐dichlorofluorescein (DCF) in the presence of ROS, making it a widely used tool for monitoring cellular redox processes. As illustrated in Figure 1, diets supplemented with 0.2, 0.4, and 0.6 g/kg Tau significantly reduced total ROS levels, as measured by flow cytometry (Figure 1A–D). Notably, as the concentration of Tau in the diets increased, a corresponding decrease in total ROS levels was observed, indicating that higher dietary Tau levels may effectively mitigate ROS accumulation (Figure 1).
Figure 1. Effect of dietary Tau on the total ROS levels by flow cytometer technique. (A) 0 g/kg Tau; (B) 0.2 g/kg Tau; (C) 0.4 g/kg Tau; and (D) 0.6 g/kg Tau.(A)(B)(C)(D)
3.4. Effect of Dietary Tau on the Content of Free Amino Acids
Diets supplemented with 0.2, 0.4, and 0.6 g/kg Tau significantly increased (p < 0.05) the intestinal content of essential amino acids, including Thr, Ile, Lys, and Leu, suggesting a positive relationship between moderate Tau intake and the availability of these critical nutrients. However, the diet containing 0.2 g/kg Tau did not significantly alter the levels of essential amino acids such as Val, Met, His, Arg, and Phe compared to the control group (Table 6). In contrast, diets with 0.4 and 0.6 g/kg Tau significantly elevated (p < 0.05) the content of these essential amino acids (Table 6). Similarly, the content of nonessential amino acids was also significantly increased (p < 0.05) by diets containing 0.4 and 0.6 g/kg Tau. While nonessential amino acids are not required for protein synthesis in the same way as essential amino acids, they play crucial roles in various biochemical processes. Notably, the diet with 0.2 g/kg Tau had no significant effect on the levels of nonessential amino acids such as Ser, Gly, Pro, Asp, and Glu (Table 6). However, diets with 0.2, 0.4, and 0.6 g/kg Tau significantly enhanced (p < 0.05) the content of nonessential amino acids Tyr and Ala (Table 6). Additionally, significant linear, quadratic, and cubic trend effects (p < 0.05) were observed for both essential and nonessential amino acids following 8 weeks of Tau supplementation (Table 6).
3.5. Effect of Dietary Tau on the Gene Expression Related to mTOR Signaling
At concentrations of 0.2, 0.4, and 0.6 g/kg, Tau‐supplemented diets significantly upregulated (p < 0.05) the expression of PI3K gene (Figure 2A). Similarly, diets containing 0.2, 0.4, and 0.6 g/kg Tau also significantly enhanced (p < 0.05) the expression of Akt and mTOR genes (Figure 2B,C). Notably, the highest levels of PI3K, Akt, and mTOR gene expression were observed in the diet containing 0.4 g/kg Tau (Figure 2A–C). However, further analysis revealed no significant difference in Akt and mTOR gene expression between 0.4 and 0.6 g/kg Tau diets (Figure 2B,C).
Figure 2. Effect of dietary Tau on the mRNA expression related to mTOR signaling. (A) PI3K; (B) Akt; and (C) mTOR. Values are expressed as means ± SEM (n = 3). Statistically significant differences are denoted by different letters (p < 0.05).(A)(B)(C)
3.6. Effect of Dietary Tau on the Gene Expression of Antioxidant Enzymes and Immune Cytokines
Diets supplemented with 0.2, 0.4, and 0.6 g/kg Tau significantly upregulated (p < 0.05) the gene expression of SOD, CAT, and GSH‐PX (Figure 3A–C). Among these, the diet containing 0.4 g/kg Tau resulted in the highest expression levels of CAT and GSH‐PX (Figure 3B,C). Additionally, diets with 0.2, 0.4, and 0.6 g/kg Tau significantly increased (p < 0.05) the expression of IL‐1β gene (Figure 3D). Similarly, all three Tau‐supplemented diets markedly enhanced (p < 0.05) the expression of IL‐6 gene (Figure 3E). Furthermore, diets containing 0.2, 0.4, and 0.6 g/kg Tau significantly induced (p < 0.05) the expression of TNFα gene (Figure 3F). These findings suggest that Tau exerts a broad stimulatory effect on the expression of cytokines involved in inflammatory responses.
Figure 3. Effect of dietary Tau on the mRNA expression of immune factors. (A) SOD; (B) CAT; (C) GSH‐PX; (D) IL‐1β; (E) IL‐6; and (F) TNFα. Values are expressed as means ± SEM (n = 3). Statistically significant differences are denoted by different letters (p < 0.05).(A)(B)(C)(D)(E)(F)
3.7. Effect of Dietary Tau on the Small Intestinal Villus
As illustrated in Figure 4, Tau‐supplemented diets significantly influenced the height of the small intestinal villi (Figure 4–F), indicating that Tau intake within a specific range can modulate the structure of small intestinal villi. Additionally, as the dietary Tau concentration increased, notable changes were observed in the width of the small intestinal villi. Specifically, higher Tau levels, particularly at 0.6 g/kg, led to an increase in both the height and width of small intestinal villi (Figure 4E,F). These findings suggest that elevated Tau intake may positively impact the morphological development of the small intestinal villi.
Figure 4. Effect of dietary Tau on the small intestine section. (A) Effect of dietary 0 g/kg Tau on the small intestine section; (B) effect of dietary 0.2 g/kg Tau on the small intestine section; (C) effect of dietary 0.4 g/kg Tau on the small intestine section; (D) effect of dietary 0.6 g/kg Tau on the small intestine section; (E) effect of dietary Tau on the height of small intestinal villi; and (F) effect of dietary Tau on the width of small intestinal villi. Bar: 25 μm.(A)(B)(C)(D)(E)(F)
3.8. Effect of Dietary Tau on the Activity of Digestive Enzymes
At concentrations of 0.2, 0.4, and 0.6 g/kg Tau, Tau‐supplemented diets did not significantly alter amylase activity in the small intestine (Figure 5A). In contrast, diets containing 0.2, 0.4, and 0.6 g/kg Tau significantly increased (p < 0.05) the activity of trypsin in the small intestine (Figure 5B). However, these same Tau diets had no significant effect on the activity of lipase, a key enzyme involved in fat digestion (Figure 5C).
Figure 5. Effect of dietary Tau on the activity of digestive enzymes. (A) The activity of amylase; (B) the activity of trypsase; and (C) the activity of lipase. Values are expressed as means ± SEM (n = 3). Statistically significant differences are denoted by different letters (p < 0.05).(A)(B)(C)
3.9. Effect of Dietary Tau on the Gene Expression Levels Related to Intestinal Barrier Function
The transcriptional regulation of intestinal tight junction proteins by dietary Tau is shown in Figure 6. All tested doses of Tau (0.2, 0.4, and 0.6 g/kg) significantly promoted the gene expression of the core tight junction components occludin and ZO‐1 (Figure 6A,B). In contrast, the induction of claudin‐18 exhibited a distinct threshold effect, with significant upregulation observed only at the higher doses of 0.4 and 0.6 g/kg. These results collectively suggest that Tau is a potent modulator of the intestinal barrier, with its efficacy varying across different protein constituents.
Figure 6. Effect of dietary Tau on the gene expression levels related to the intestinal barrier function. (A) Occludin gene; (B) ZO‐1 gene; and (C) claudin‐18 gene. Values are expressed as means ± SEM (n = 3). Statistically significant differences are denoted by different letters (p < 0.05).(A)(B)(C)
3.10. Effect of mTOR Inhibitor on the Gene Expression of Antioxidant Enzymes and Immune Cytokines
Salmons treated with the mTOR inhibitor exhibited a significant reduction (p < 0.05) in mTOR gene expression (Figure 7A). Additionally, the mTOR inhibitor markedly decreased (p < 0.05) the gene expression of antioxidant enzymes, including SOD, CAT, and GSH‐PX (Figure 7B–D). Furthermore, the expression of inflammatory cytokines such as IL‐1β, IL‐6, and TNFα was significantly downregulated (p < 0.05) by the mTOR inhibitor (Figure 7E–G). These findings suggest that the mTOR inhibitor exerts a suppressive effect on the expression of both antioxidant enzymes and immune cytokines involved in inflammatory responses.
Figure 7. Effect of mTOR inhibitor on the mRNA expression of antioxidant enzymes and immune factors. (A) mTOR; (B) SOD; (C) CAT; (D) GSH‐PX; (E) IL‐1β; (F) IL‐6; and (G) TNFα. Values are expressed as means ± SEM (n = 3). Statistically significant differences are denoted by asterisk (p < 0.05).(A)(B)(C)(D)(E)(F)(G)
3.11. Effect of mTOR Inhibitor on the Activity of Antioxidant Enzymes and ROS Levels
Salmons treated with the mTOR inhibitor showed a significant reduction (p < 0.05) in the activity of CAT, SOD, and GSH‐PX (Figure 8A–C). In addition to its effects on antioxidant enzymes, the mTOR inhibitor also impacted oxidative stress markers, significantly increasing (p < 0.05) the levels of H_2_O_2_ and MDA (Figure 8D,E). Furthermore, the mTOR inhibitor significantly promoted (p < 0.05) the generation of O_2_ ^·-^ and ·OH (Figure 8F,G).
Figure 8. Effect of mTOR inhibitor on the activity of antioxidant enzymes and ROS levels. (A) SOD; (B) CAT, (C) GSH‐PX; (D) H_2_O_2_; (E) MDA; (F) O_2_ ^·-^; and (G) ·OH. Values are expressed as means ± SEM (n = 3). Statistically significant differences are denoted by asterisk (p < 0.05).(A)(B)(C)(D)(E)(F)(G)
3.12. Effect of mTOR Inhibitor on the Content of Nutrients and the Activity of Digestive Enzymes
The mTOR inhibitor significantly reduced (p < 0.05) the content of Na, K, and Ca (Figure 9A–C. Additionally, the mTOR inhibitor markedly decreased (p < 0.05) the activity of trypsin in the small intestine (Figure 9D). These findings suggest that the mTOR inhibitor exerts an inhibitory effect on nutrient content and digestive enzyme activity.
Figure 9. Effect of mTOR inhibitor on the content of nutrients and activity of digestive enzymes. (A) The content of Na; (B) the content of K; (C) the content of Ca; and (D) the activity of lipase. Values are expressed as means ± SEM (n = 3). Statistically significant differences are denoted by asterisk (p < 0.05).(A)(B)(C)(D)
3.13. Effect of mTOR Inhibitor on the Content of Free Amino Acids
Salmons treated with the mTOR inhibitor exhibited a significant reduction (p < 0.05) in the content of essential amino acids, including Thr, Ile, Lys, Leu, Val, Met, His, Arg, and Phe, compared to the control group (Table 7). Similarly, the mTOR inhibitor also significantly decreased (p < 0.05) the levels of nonessential amino acids (Table 7).
3.14. Effect of mTOR Inhibitor on the Gene Expression Levels Related to the Intestinal Barrier Function
The administration of the mTOR inhibitor markedly attenuated the transcriptional expression of key tight junction components, as evidenced by the significant inhibition of occludin, ZO‐1, and claudin‐18 genes (Figure 10A–C). These findings indicate that mTOR activity is pivotal for maintaining the molecular foundation of the tight junction complex, with its inhibition directly compromising the barrier function of the intestinal epithelium.
Figure 10. Effect of mTOR inhibitor on the gene expression levels related to the intestinal barrier function. (A) Occludin gene; (B) ZO‐1 gene; and (C) claudin‐18 gene. Values are expressed as means ± SEM (n = 3). Statistically significant differences are denoted by different letters (p < 0.05).(A)(B)(C)
4. Discussion
Tau supplementation has been shown to improve the physiological function in various fish species, particularly when plant‐based proteins are used in feed formulations [21, 32]. Under normal physiological conditions, a delicate balance is maintained between the production of ROS and the antioxidant defense system in animals. This equilibrium is crucial for cellular health and the prevention of oxidative stress. Previous studies have demonstrated that dietary Tau supplementation enhances the antioxidant capacity of fish [5, 33, 34]. Thus, Tau exhibits potent antioxidant properties and protects cells from oxidative stress induced by environmental pollutants, high‐density farming, or poor water quality.
The activity of antioxidant enzymes is directly linked to their ability to neutralize free radicals [35]. When the antioxidant enzymes fail to counteract excessive ROS production, oxidative damage occurs, leading to cellular injury and potential disease. The first line of defense against oxidative stress includes SOD and CAT, which are critical components of the antioxidant system [36]. As a key endogenous antioxidant enzyme, SOD plays a vital role in converting the harmful O_2_ ^·-^ into H_2_O_2_ [37, 38]. In our study, diets supplemented with varying levels of Tau enhanced SOD activity, with higher Tau levels showing more pronounced effects. Moreover, the other essential enzymes, such as CAT and GSH‐PX, scavenge H_2_O_2_ and prevent its accumulation and subsequent oxidative damage [37]. The increased activity of these antioxidant enzymes is critical for mitigating oxidative damage. Our results clearly demonstrate that Tau enhances overall antioxidant capacity, with higher Tau levels providing greater benefits.
To further explore the effects of Tau on ROS production, ROS levels were further measured in the small intestine of salmon. The results revealed that as dietary Tau levels increased from 0.2 to 0.6 g/kg, the levels of H_2_O_2_, O_2_ ^·-^, and ·OH significantly decreased. It suggests that Tau enhances the antioxidant capacity of salmon by effectively scavenging ROS. Therefore, maintaining appropriate dietary Tau levels is essential for minimizing the harmful effects of free radicals. Using DCFH‐DA and flow cytometry to further monitor cellular redox processes, it was observed that Tau‐supplemented diets significantly reduced total ROS levels. Notably, 0.6 g/kg Tau resulted in the most substantial reduction in ROS levels, indicating that higher Tau levels are more effective in alleviating oxidative stress. These findings support the notion that a high‐Tau diet can positively influence the antioxidant capacity of the small intestine. Thus, careful regulation of dietary Tau levels is crucial for ensuring the health and well‐being of salmon.
It is known that the unsaturated fatty acids are highly susceptible to oxidation, and MDA content is closely associated with lipid peroxidation [39]. Oxidative stress triggers excessive MDA production, indicating an imbalance in ROS levels [40]. Moreover, MDA serves as a key biomarker for assessing oxidative damage to lipids, providing insights into the extent of lipid peroxidation [41, 42]. Elevated MDA levels often correlate with reduced antioxidant enzyme activity, further compromising the cell’s ability to counteract oxidative stress [43]. Excessive MDA production can cause significant damage to various physiological systems in fish. In addition, the reduced antioxidant enzyme activity can exacerbate lipid peroxidation, leading to more MDA accumulation. Our findings align with these observations, demonstrating that Tau can mitigate lipid oxidation damage and potentially strengthen the fish’s ability against oxidative threats. The results underscore the importance of maintaining appropriate dietary Tau levels to reduce MDA levels and preserve the health of coho salmon.
Crucially, the antioxidant effects of Tau extended to the preservation of intestinal barrier integrity. Our results revealed that dietary Tau exerted dose‐dependent and target‐specific regulation on intestinal tight junction proteins. The higher doses of Tau significantly promoted the expression of core tight junction components, including occludin, ZO‐1, and claudin‐18. These results collectively establish Tau as a potent modulator of the intestinal barrier, with efficacy varying across different protein constituents.
The innate immune system is closely linked to the transcription levels of cytokines, which play a pivotal role in initiating and regulating immune responses. The cytokines are essential mediators that help fish recognize and combat pathogen infections. The relationship between Tau and immunity highlights the importance of Tau in modulating immune responses. Previous studies have shown that Tau supplementation influences the expression of pro‐inflammatory cytokines and improves survival rates following bacterial challenges, thereby reducing inflammation and tissue damage [5, 6, 20, 44]. In this study, diets containing varying levels of Tau upregulated the expression of IL‐6, TNFα, and IL‐1β genes. The findings suggest that dietary Tau can actively stimulate the transcription of genes involved in innate immune responses, enhancing the body’s defense mechanisms against pathogens in the intestine. Thus, Tau exhibits potent anti‐inflammatory properties, which are essential for maintaining immune homeostasis in coho salmons.
Previous research has shown that the PI3K/Akt/mTOR signaling pathway plays a critical role in targeting oxidative stress during the initial stages of immune responses [27, 28, 45]. In this study, dietary Tau upregulated the gene expression of PI3K, Akt, mTOR, and cytokines such as IL‐6, TNFα, and IL‐1β. The findings further suggest that the PI3K/Akt/mTOR pathway is involved in regulating innate immunity. The central role of mTOR in maintaining intestinal barrier function was substantiated by mTOR inhibitor experiments. The findings indicate that mTOR activity is pivotal for maintaining the molecular foundation of the tight junction complex and immune response of the intestinal epithelium.
Additionally, higher Tau levels in the diet increased the height and width of the small intestinal villi while inducing trypsin activity, an enzyme critical for protein digestion. Conversely, Tau increased the content of free amino acids, indicating improved protein breakdown and absorption. Previous studies have demonstrated that oxidative stress can damage the small intestine and impair its functional integrity [46–49]. Based on our findings, it is hypothesized that Tau‐reduced oxidative stress responses and enhanced innate immunity may contribute to the morphological changes in intestinal villi, potentially affecting digestive function.
Metal ion homeostasis is closely linked to oxidative stress and ROS formation, which can trigger lipid peroxidation and DNA damage, posing significant threats to cellular health [50, 51]. In this study, dietary Tau influenced the accumulation of Ca, K, and Na in the small intestine, highlighting its role in maintaining the homeostasis of nutritional elements. Disruptions in oxidative stress and ROS formation may exacerbate metal ion homeostasis, leading to detrimental effects on cellular structures and functions in the intestine of coho salmon.
In addition, the mTOR inhibitor RAPA was further added to the diet containing 0.6 g/kg Tau for investigating the role of mTOR in regulating the expression of antioxidant enzymes and immune cytokines. Salmons treated with RAPA exhibited significantly reduced gene expression of mTOR, SOD, CAT, GSH‐PX, IL‐1β, IL‐6, and TNFα. Additionally, RAPA decreased the activity of CAT, SOD, and GSH‐PX while increasing ROS generation. These results suggest that mTOR inhibition suppresses the expression of antioxidant enzymes and immune cytokines involved in inflammatory responses. Furthermore, RAPA reduced the content of Na, K, and Ca, as well as trypsin activity and amino acid levels in the small intestine. It indicates that mTOR may play a role in regulating antioxidant enzymes and immune cytokines, which in turn influence digestive enzyme activity. However, the optimal dose range of Tau and future work should be done on protein and phosphorylation validation on mTOR pathway.
In summary, the effect of dietary Tau on the innate immune responses, digestive function, and mTOR signaling was investigated in coho salmon. The results revealed that dietary Tau influences antioxidant enzyme activity and ROS production in the small intestine. Additionally, Tau affected the homeostasis of nutritional elements and upregulated the expression of mTOR and inflammatory cytokines. Notably, Tau positively impacted intestinal villus morphology, tight junction gene expression, and trypsin activity and increased the content of free amino acids. By using the mTOR inhibitor RAPA, it is shown that mTOR may play a role in regulating innate immune responses and maintaining intestinal barrier function. In conclusion, Tau influences innate immune responses and digestive function, and mTOR may play a role in regulating intestinal health in coho salmon.
Author Contributions
Conceptualization: Dongwu Liu. Methodology, software: Miao Zhang and Ya Wang. Validation, analysis, investigation: Linxuan Bian, Ya Wang, and Xinran Zhang. Writing, editing: Linxuan Bian. Funding acquisition: Dongwu Liu.
Funding
This study was funded by the Natural Science Foundation of Shandong Province (Grant ZR2023MC042).
Ethics Statement
The present study was carried out strictly according to the recommendations in the Guide for the Use of Experimental Animals of Shandong University of Technology.
Conflicts of Interest
The authors declare no conflicts of interest.
The reference list from the paper itself. Each links out to its DOI / PubMed record.
- 1El-Sayed A.-F. M. , Is Dietary Taurine Supplementation Beneficial for Farmed Fish and Shrimp? A Comprehensive Review, Reviews in Aquaculture. (2014) 6, no. 4, 241–255, 10.1111/raq.12042, 2-s 2.0-84913612616. · doi ↗
- 2Salze G. P. and Davis D. A. , Taurine: A Critical Nutrient for Future Fish Feeds, Aquaculture. (2015) 437, 215–229, 10.1016/j.aquaculture.2014.12.006, 2-s 2.0-84919363707. · doi ↗
- 3Johnson R. B. , Kim S.-K. , and Watson A. M. , et al.Effects of Dietary Taurine Supplementation on Growth, Feed Efficiency, and Nutrient Composition of Juvenile Sablefish (Anoplopoma fimbria) Fed Plant Based Feeds, Aquaculture. (2015) 445, 79–85, 10.1016/j.aquaculture.2015.03.030, 2-s 2.0-84928601678. · doi ↗
- 4Gaon A. , Nixon O. , and Tandler A. , et al.Dietary Taurine Improves Vision in Different Age Gilthead Sea Bream (Sparus aurata) Larvae Potentially Contributing to Increased Prey Hunting Success and Growth, Aquaculture. (2021) 533, 10.1016/j.aquaculture.2020.736129, 736129. · doi ↗
- 5Liu J.-X. , Guo H.-Y. , Zhu K.-C. , Liu B.-S. , Zhang N. , and Zhang D.-C. , Effects of Exogenous Taurine Supplementation on the Growth, Antioxidant Capacity, Intestine Immunity, and Resistance Against Streptococcus agalactiae in Juvenile Golden Pompano (Trachinotus ovatus) Fed With a Low-Fishmeal Diet, Frontiers in Immunology. (2022) 13, 10.3389/fimmu.2022.1036821, 1036821.36311806 PMC 9614097 · doi ↗ · pubmed ↗
- 6Shi Y. , Zhong L. , and Fan Y. , et al.Taurine Inhibits Hydrogen Peroxide-Induced Oxidative Stress, Inflammatory Response and Apoptosis in Liver of Monopterus albus , Fish & Shellfish Immunology. (2022) 128, 536–546, 10.1016/j.fsi.2022.08.029.35988713 · doi ↗ · pubmed ↗
- 7Kotzamanis Y. , Tsironi T. , and Brezas A. , et al.High Taurine Supplementation in Plant Protein-Based Diets Improves Growth and Organoleptic Characteristics of European Seabass (Dicentrarchus labrax), Scientific Reports. (2020) 10, no. 1, 10.1038/s 41598-020-69014-x, 12294.32703970 PMC 7378086 · doi ↗ · pubmed ↗
- 8Salze G. P. , Davis D. A. , Stuart K. , and Drawbridge M. , Effect of Dietary Taurine in the Performance of Broodstock and Larvae of California Yellowtail Seriola dorsalis , Aquaculture. (2019) 511, 10.1016/j.aquaculture.2019.734262, 2-s 2.0-85068250489, 734262. · doi ↗