Comparative Transcriptomic Analysis of Human Macrophages During Mycobacterium avium Versus Mycobacterium tuberculosis Infection
Gül Kilinç, Robin H. G. A. van den Biggelaar, Tom H. M. Ottenhoff, Leon H. Mei, Anno Saris

TL;DR
This study compares how human macrophages respond to two mycobacterial infections, finding both similarities and key differences in immune responses that could guide new treatments.
Contribution
The study provides the first comparative transcriptomic analysis of human macrophages infected with Mycobacterium avium and Mycobacterium tuberculosis.
Findings
Mav and Mtb infections share immune pathways like cytokine signaling and GPCR modulation.
Mav infection more strongly affects phospholipases and GIMAP genes compared to Mtb.
Immediate early genes and IFN signaling show distinct regulation between the two infections.
Abstract
The treatment of Mycobacterium avium (Mav) infection, responsible for over 80% of nontuberculous mycobacterial pulmonary disease, remains challenging due to rising antibiotic resistance and unsatisfactory success rates. Hence, there is a need for a deeper understanding of host–pathogen interactions to inform the development of alternative therapeutic approaches, like host‐directed therapy (HDT), aimed at improving host antimycobacterial defenses. However, compared to Mycobacterium tuberculosis (Mtb) infections, knowledge of host–pathogen interactions for Mav infection is still limited. To address this knowledge gap, we performed a genome‐wide host transcriptomic analysis of Mav‐infected primary human macrophages—the primary host cell—alongside Mtb‐infected macrophages to leverage insights from Mtb research. Our findings show substantial overlap in the gene expression patterns…
Genes, proteins, chemicals, diseases, species, mutations and cell lines named across the full text — each resolved to its canonical identifier and authoritative record.
Click any figure to enlarge with its caption.
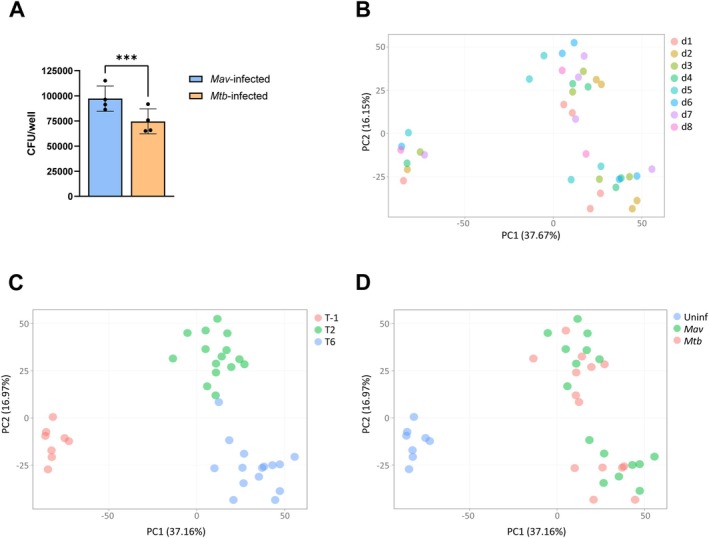 FIGURE 1
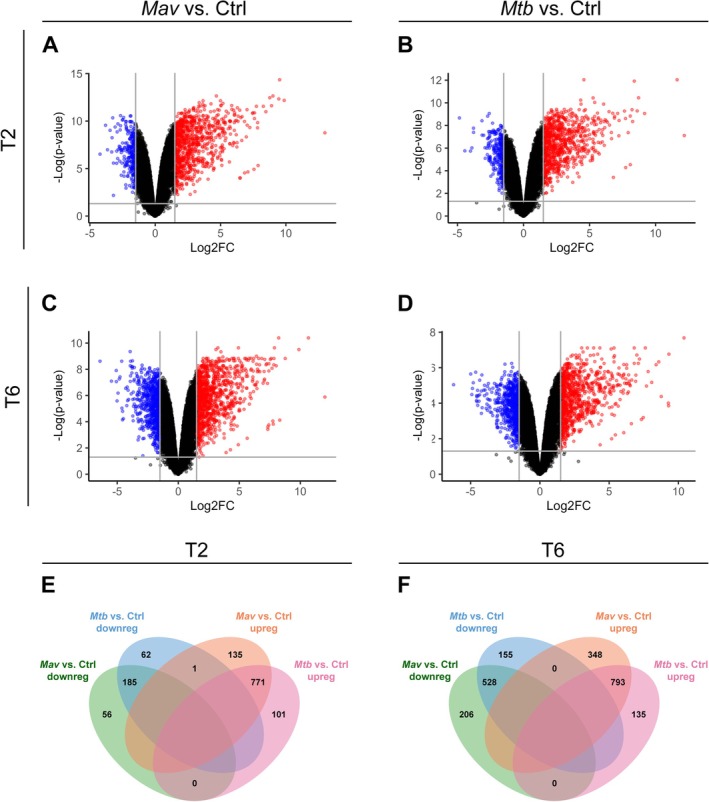 FIGURE 2
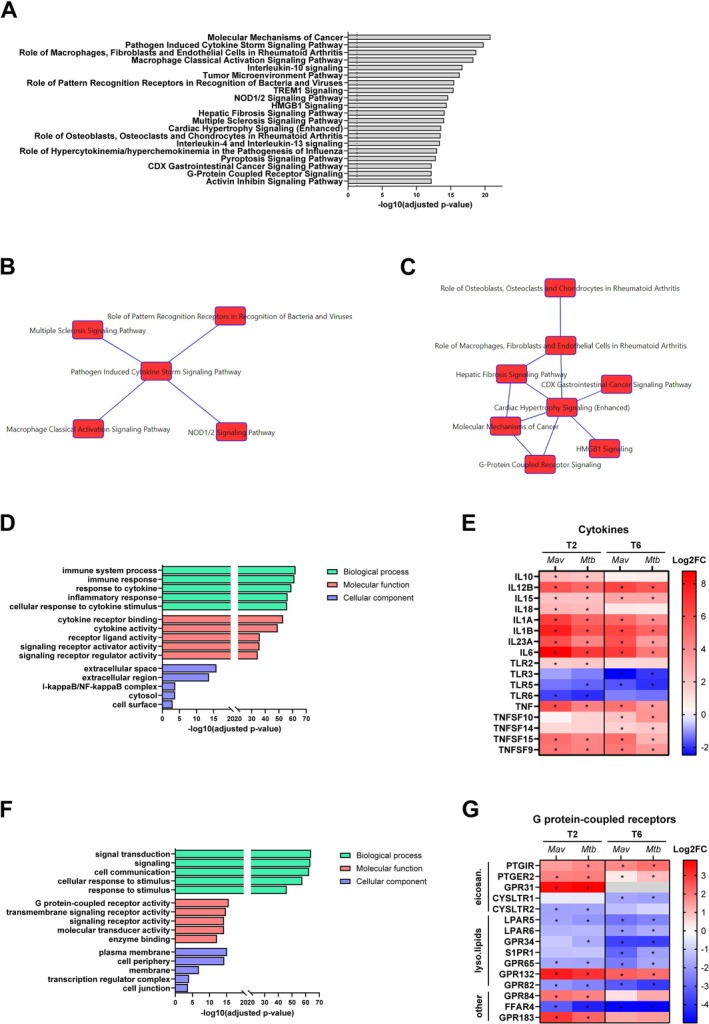 FIGURE 3
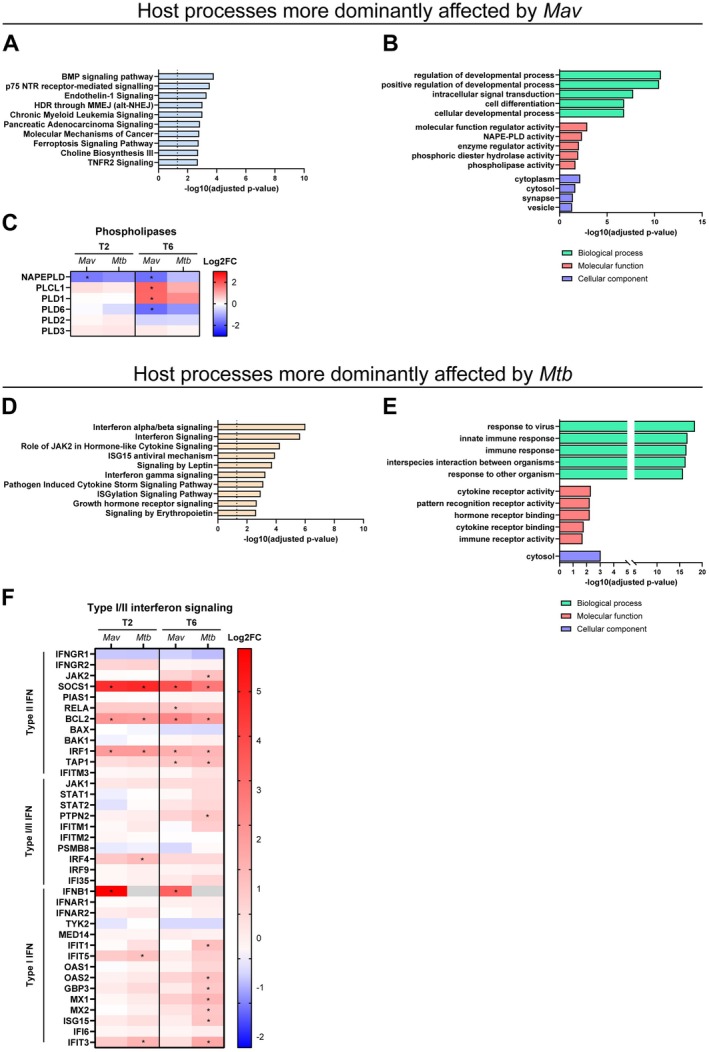 FIGURE 4
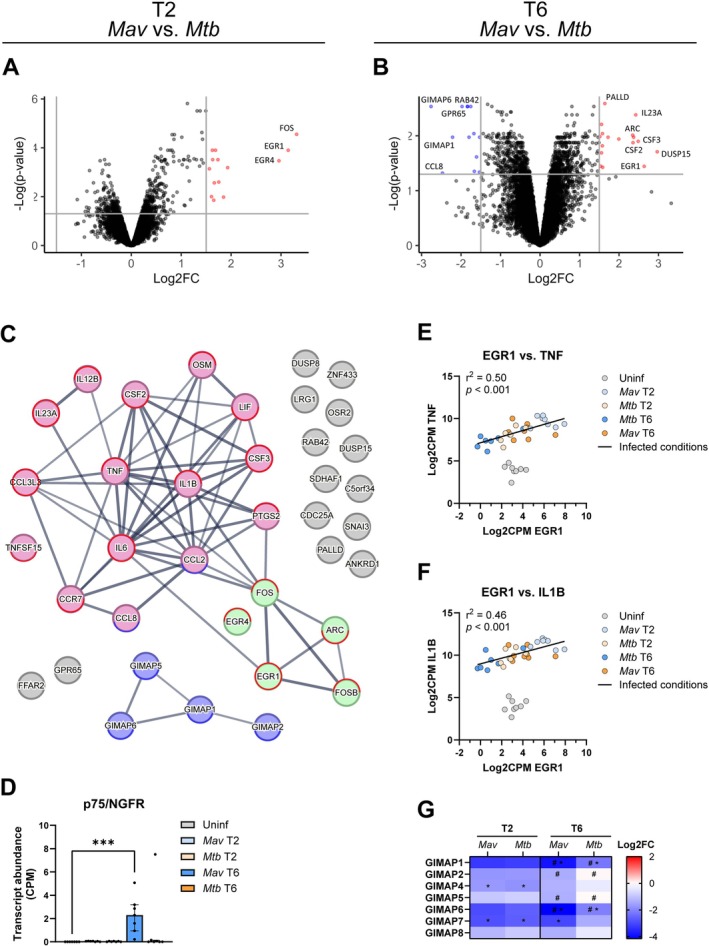 FIGURE 5
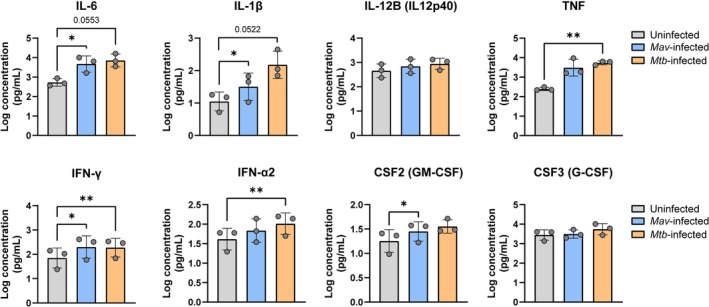 FIGURE 6
| 2 h postinfection | Log2FC ( | DEG vs. uninfected | ||
|---|---|---|---|---|
| Gene |
|
|
| |
|
| ||||
| IL23A | 1.85 | 1.05E‐02 | Up | Up |
| IL6 | 1.75 | 2.52E‐03 | Up | Up |
| OSM | 1.74 | 3.06E‐04 | Up | — |
| IL1B | 1.69 | 1.26E‐04 | Up | Up |
| IL12B | 1.65 | 1.40E‐02 | Up | Up |
| CCL3L3 | 1.63 | 3.06E‐04 | Up | Up |
| TNF | 1.62 | 1.26E‐04 | Up | Up |
| CSF3 | 1.57 | 7.26E‐04 | Up | Up |
|
| ||||
| FOS | 3.31 | 2.80E‐05 | Up | Down |
| EGR1 | 3.14 | 1.26E‐04 | Up | — |
| EGR4 | 2.96 | 3.39E‐04 | Up | — |
| FOSB | 1.93 | 6.47E‐04 | Up | — |
|
| ||||
| PTGS2 | 1.66 | 2.72E‐03 | Up | Up |
- —Innovative Medicines Initiative 2 IMI2
- —Nederlandse Organisatie voor Wetenschappelijk Onderzoek10.13039/501100003246
Peer Reviews
No public reviews on file for this paper yet. If you reviewed it on a platform where reviews are public (OpenReview, ICLR, NeurIPS, ICML), you can paste yours below so the community can read it here.
Videos
No videos yet. Explain this paper in a talk, walkthrough, or lecture? Add one.
Taxonomy
TopicsTuberculosis Research and Epidemiology · Mycobacterium research and diagnosis · Diagnosis and treatment of tuberculosis
Introduction
1
Mycobacterium avium (Mav) is the causative pathogen for the majority of the chronic lung diseases caused by nontuberculous mycobacteria (NTM) (Ingen et al. 2017; Prevots and Marras 2015; van Ingen et al. 2021), which have seen a rise in incidence globally and represent a growing public health concern (Namkoong et al. 2016; Shah et al. 2016; Winthrop et al. 2020). While lung disease caused by Mav (Mav‐LD) particularly affects individuals with predisposing lung disorders or a compromised immune system, immunocompetent individuals with certain host characteristics have been found to develop Mav‐LD. Improved understanding and management of NTM, in particular Mav, infections is therefore desirable.
The recommended treatment for Mav‐LD consists of a three‐drug antibiotic regimen comprising a macrolide, ethambutol, and a rifamycin that should be administered for at least 12 months after negative sputum conversion (Daley et al. 2020; Griffith et al. 2007). Nevertheless, even after completing the antibiotic therapy, the success rate, disappointingly, is as low as 40% (Kwon et al. 2019; Xu et al. 2014). This necessitates the development of new therapeutic strategies. One promising approach is the use of host‐directed therapy (HDT), which aims to dampen destructive inflammation or to boost the host's immune responses which may be beneficial, especially for individuals who are suffering from a Mav infection and are immunocompromised. By targeting host immunity, HDT may help to eliminate nonreplicating and drug‐resistant bacteria which are hardly eradicated by antibiotic therapy. In addition, as adjunctive treatment, HDT has the potential advantage of shortening the duration or decreasing the dosage of current antibiotic regimens, which may reduce adverse drug effects. Furthermore, since host rather than bacterial pathways are targeted, the risk of de novo development of drug resistance is less likely. While the development of HDT has been extensively explored in the context of tuberculosis (Kilinc et al. 2021; Tian et al. 2025), there remains a notable gap in this area for Mav infection. The development of HDT for Mav requires a thorough understanding of host–pathogen interactions; however, our current knowledge of these interactions during Mav infection remains limited.
Macrophages are the immune cells that play a key role in host defense against Mav infection. Upon inhalation, Mav enters the lung alveolar space where macrophages will form the main reservoir for the mycobacteria (Crowle et al. 1991; Inderlied et al. 1993). Multiple macrophage receptors, including Toll‐like receptors (TLRs) and C‐type lectins, engage in the initial bacterium‐host cells encounter which induces phagocytosis. Upon recognition and phagocytosis, the early Mav‐containing phagosomes ideally undergo maturation and fusion with lysosomes containing hydrolytic enzymes to form phagolysosomes capable of eliminating the mycobacteria (Lee et al. 2020; Uribe‐Querol and Rosales 2017). However, Mav produces virulence factors to survive and replicate intracellularly, while evading host immune responses. For instance, the Mav protein MAV_2941 inhibits phagosome maturation, and thus prevents intracellular Mav killing (Danelishvili et al. 2017; Danelishvili and Bermudez 2015). The production and signaling of pro‐inflammatory cytokines, including TNF, IL‐12, and IL‐23, by macrophages play a vital role in further stimulating the bactericidal functions of macrophages (Park et al. 2022). Consequently, inherited or acquired defects in the production and signaling of these cytokines lead to an increased susceptibility to Mav‐LD (Ottenhoff et al. 2002), stressing the significant role of host immunity in deciding the outcome of Mav infection.
A better understanding of the mechanisms involved by which macrophages either kill Mav or become its breeding ground will aid the development of HDT. RNA‐sequencing (RNA‐seq) has previously been used to study the macrophage host response following infection with Mtb, providing insights into the mechanisms of pathogenesis, potential biomarkers for disease progression, and targets for new therapeutic interventions such as HDT (Blischak et al. 2015; Lee et al. 2019; Prombutara et al. 2022; Pu et al. 2021). In contrast, most transcriptomic studies exploring the host response to Mav have been conducted in cell lines, which require specific stimulation or may not accurately reflect primary human macrophage responses to mycobacteria and have relied on predefined microarray analyses that fail to reflect the complete transcriptional response (Agdestein et al. 2014; Blumenthal et al. 2005; Greenwell‐Wild et al. 2002; McGarvey et al. 2004). Our aim was therefore to perform genome‐wide transcriptomic analysis of primary human macrophages infected with Mav, alongside Mtb as a reference to facilitate the rapid extrapolation of relevant findings from Mtb to Mav, thereby enhancing our understanding of the similarities and differences in how both pathogens interact with and are managed by the host's immune system. We hypothesized that this will ultimately contribute to the development of more effective therapies for infections caused by these mycobacteria.
In this study, we showed that the host transcriptional response is highly similar between macrophages infected with Mav and macrophages infected with Mtb. The common host response includes the expression of cytokines and other immune‐related genes, but also G protein‐coupled receptors involved in lipid metabolism. Furthermore, we identified genes with transcription levels that were different in magnitude between macrophages infected with Mav and macrophages infected with Mtb. These differences were linked to phospholipases, immediate early genes (IEGs), and the relatively uncharacterized GTPase of immunity‐associated protein (GIMAP) family.
Results
2
Genome‐Wide Transcriptome Analysis of Primary Human Macrophages Infected With Mav or Mtb
2.1
To investigate the induction of the early host immune response, primary human macrophages from 7 donors were infected with Mav or Mtb, with an 8th donor (Mtb data unavailable) maintained in the Mav analysis to increase power. Macrophage phagocytosis of Mav was modestly higher as compared to Mtb (Figure 1A). Moreover, analysis of an independent set of donors confirmed comparable percentages of infected macrophages (Figure S1). Genome‐wide transcriptome analysis using RNA‐seq was performed in seven biological replicates at 2 h and 6 h postinfection. Expression levels were compared between infected samples and uninfected controls using unsupervised and supervised analyses. PCA analysis revealed the clustering of samples derived from different donors (Figure 1B), while infected samples were clustered separately from uninfected macrophages and clearly changed over time (Figure 1C). The transcriptome profiles of macrophages infected with either Mav or Mtb were evidently clustered together (Figure 1D).
*Transcriptome analysis of Mav‐ or Mtb‐infected versus uninfected samples. (A) M2 macrophages were infected with either Mav or Mtb for 1 h. After infection, cells were washed and lysed to determine the internalization (T0) by CFU assay. CFU data represent the mean ± standard deviation (SD) from different donors (n = 4). Dots represent the mean from triplicate wells of a single donor. Differences were statistically significant by a paired t‐test. **p < 0.001. (B–D) The variance of the sequencing data from Mav‐ or Mtb‐infected M2 macrophages from different donors (n = 8 or n = 7, respectively) and uninfected controls was described in PCA plots. Separation of samples in the PCA plots is highlighted by color‐coding the samples according to donor (B), timepoint (C), or infection status (D).
Primary Human Macrophages Infected With Mav or Mtb Present Similar Host Transcription Responses
2.2
To determine the transcriptomic response upon Mav and Mtb infection, significantly differentially expressed genes (DEGs) (cutoffs: log2(fold change) ≥ 1.5 or ≤ −1.5 and false discovery rate (FDR) adjusted p‐values < 0.05) were assessed by comparing gene expression levels in infected macrophages at 2 and 6 h postinfection with uninfected controls. At 2 h postinfection, macrophages showed downregulation and upregulation of 241 and 907 genes after Mav infection (Figure 2A, Table S1) or 248 and 872 genes after Mtb infection, respectively (Figure 2B, Table S1). At 6 h postinfection, the numbers of downregulated and upregulated genes were 734 and 1141 for Mav (Figure 2C, Table S1), and 683 and 928 for Mtb (Figure 2D, Table S1), respectively. To compare the similarity between DEGs in response to infection with either Mav or Mtb, we performed Pearson's correlations and Venn diagram analyses. Changes in gene expression in Mav‐ and Mtb‐infected macrophages were very similar with Pearson coefficients of determination (r ^2^) of 0.95 and 0.93 at 2 and 6 h postinfection, respectively (Figure S2A,B). Correlations between species were stronger than those between two timepoints, with the latter resulting in Pearson correlation coefficients of 0.68 and 0.71 for Mav and Mtb infection, respectively (Figure S2C,D). Similarly, the Venn diagram analysis showed that the majority of the DEGs was affected by both mycobacteria compared to uninfected controls (Figure 2E,F).
Differential expression analysis of primary human macrophages at 2 and 6 h postinfection with Mav or Mtb compared to uninfected samples. (A–D) Volcano plots showing DEGs among biological conditions of primary human macrophages at 2 (A, B) or 6 (C, D) hours postinfection with Mav (A–C) or Mtb (B–D) versus uninfected macrophages (Ctrl). Only log2 fold change (Log2FC) ≥ 1.5 or ≤ 1.5 and false discovery rate‐adjusted p‐values < 0.05 were analyzed. The upregulated genes are labeled red and downregulated genes are labeled blue. Nondifferentially expressed genes are labeled black. (E, F) Venn diagram of the DEGs, showing the number of overlapping or unique down‐ or upregulated DEGs identified in macrophages at 2 (E) or 6 (F) hours postinfection infected with Mav or Mtb compared to the uninfected controls. N/A: Comparison not applicable, as a gene cannot be down‐ and upregulated within the same infection and time point.
To assess the common host response against Mav and Mtb, DEGs altered by both pathogens at the same timepoint—either 2 h or 6 h postinfection—were pooled, resulting in 610 downregulated genes and 1063 upregulated genes compared to uninfected controls (Table S1). Notably, one gene (FOS) was significantly upregulated by Mav and downregulated by Mtb. The 1673 DEGs shared by Mav and Mtb were subjected to Ingenuity Pathway Analysis (IPA) (Table S1). The top 20 pathways, enriched with 293 DEGs (17.5% of all DEGs), are shown in Figure 3A. These pathways were also among the highly ranked pathways in response to either Mav or Mtb compared to uninfected controls (Figure S3A,B). The DEGs enriched in these top 20 pathways showed substantial overlap between pathways, predominantly including cytokines such as IL1B, TNF, IL18, IL1A, and IL6, as well as NFKB1 and NFKB2. To comprehend the common host response, the overlapping network tool from IPA was used to identify clusters of related pathways. The analyses revealed two major nodes that were affected by both Mav and Mtb (Figure 3B,C). One node comprised pathways including Multiple Sclerosis Signaling Pathway, Role of Pattern Recognition Receptors in Recognition of Bacteria and Viruses, Pathogen Induced Cytokine Storm Signaling Pathway, Macrophage Classical Activation Signaling Pathway and NOD1/2 Signaling Pathway (Figure 3B). Gene Ontology (GO) Enrichment analysis with the 114 DEGs belonging to this node showed that most of the genes were associated with GO terms linked to a cytokine signaling response (Figure 3D, Figure S4A), which, amongst others, included cytokines (i.e., CXCL8, CSF2, IL36G, IL12B, IL15, IL10, CCL5, IL23A), TNF superfamily ligands (TNFSF10, TNFSF14, TNFSF15 and TNFSF9) and Toll‐like receptors (TLR2, TLR3, TLR5 and TLR6) (Figure 3E, Table S1).
Enrichment analysis of DEGs shared by Mav and Mtb in primary human macrophages. (A) The top 20 most significantly enriched IPA pathways of the 1673 commonly DEGs in macrophages infected with Mav and Mtb compared with uninfected controls. The enriched pathways were ranked by −log 10 p‐value of gene enrichment. (B, C) Network analysis of enriched pathways from A using the IPA overlap networks tool. Links between indicated pathways indicate an overlap of a minimum of 30 DEGs. (D) GO enrichment analysis showing the top GO terms for biological process, molecular function and cellular component categories enriched for DEGs enriched in the pathways shown in B. The enriched ontology clusters were ranked by log10 p‐value of gene enrichment. Asterisk () indicates gene is differentially expressed in comparison to uninfected controls. (E) Heatmap showing the expression patterns of various cytokines that were significantly affected by both Mav and Mtb infection at 2 (T2) and/or 6 (T6) hours postinfection, in comparison to uninfected controls. Asterisk () indicates a DEG in comparison to uninfected controls. (F) GO enrichment analysis showing the top GO terms for biological process, molecular function and cellular component categories enriched for DEGs enriched in the pathways shown in C. The enriched ontology clusters were ranked by log10 p‐value of gene enrichment. (G) Heatmap showing the expression patterns of lipid‐binding GPCRs that were significantly affected by both Mav and Mtb infection at 2 (T2) and/or 6 (T6) hours postinfection, in comparison to uninfected controls. Asterisk () indicates a DEG in comparison to uninfected controls. Grey box indicates no expression values could be determined. Ligands of genes are indicated with eicosan: Eicosanoids, lyso.lipids: Lysophospholipids and other: Free fatty acids and sterols.*
The second node comprised pathways including Molecular Mechanisms of Cancer, Role of Macrophages, Fibroblasts and Endothelial Cells in Rheumatoid Arthritis, Role of Osteoblasts, Osteoclasts and Chondrocytes in Rheumatoid Arthritis, Hepatic Fibrosis Signaling Pathway, CDX Gastrointestinal Cancer Signaling Pathway, G‐Protein Coupled Receptor Signaling and HMGB1 Signaling (Figure 3C). GO Enrichment analysis with 164 DEGs (excluding cytokines and cytokine receptors already discussed above) showed an association with mainly signal transduction by G protein‐coupled receptor (GPCR) activity (Figure 3F, Figure S4B). In total, the expression of 39 GPCRs was significantly affected by both Mav and Mtb (Table S1). Based on the GPCR database (https://gpcrdb.org), a part of these GPCRs are involved in various signaling pathways with ligands including hydrocarboxylic acids (HCAR2 and HCAR3) (Peters et al. 2022; Zandi‐Nejad et al. 2013), neurotransmitters (CHRM3), nucleotides (ADORA2A, ADORA3 and P2RY13) (Klaver and Thurnher 2021; Jacobson et al. 2018; Aggarwal et al. 2013), hormones (SSTR2, OXTR, MAS1, MC1R and C5AR2) (Li et al. 2020; Rinne et al. 2017; Hammer et al. 2016; Szeto et al. 2017; Elliott et al. 1999) and Wnt ligands (FZD2, FZD4, FZD6 and LGR4) (Schaale et al. 2011). Finally, the biggest group comprised GPCRs involved in sensing lipids, including eicosanoids (PTGIR, PTGER2, GPR31, CYSLTR1 and CYSLTR2), lysophospholipids (LPAR5, LPAR6, GPR34, S1PR1, GPR65, GPR132 and GPR82), free fatty acids (GPR84 and FFAR4) and sterols (GPR183) (Figure 3G). Taken together, these findings indicate that common changes in the host transcriptomic response upon infection with Mav and Mtb are characterized by an enhanced cytokine response, regulation of GPCRs and likely concomitant lipid‐mediated immunoregulation.
Genes Significantly Regulated Only by Either Mav or Mtb Indicate Subtle, but Not Infection‐Specific, Changes in Host Signaling Pathways
2.3
To identify individual genes that were significantly regulated by either Mav or Mtb, DEGs from the two different timepoints were pooled. Although the correlation between host transcriptomic response to Mav and Mtb infection was notably high, genes were identified that were associated with either one of the infections (Figure 2E,F). In total, 561 genes were only differentially expressed by Mav, while 323 genes were only differentially regulated by Mtb (Table S1). Pathway enrichment analysis revealed that the bone morphogenetic protein (BMP) signaling pathway (BMP1, BMP2, JUN, MAPK8, RELA, SOS1, RAP1B and PRKAG2), p75 neurotrophin receptor (NTR)‐mediated signaling (ARHGEF26, GNA13, ITSN1, MAPK8, PSEN2, RELA, SOS1 and TIAM2) and TNFR2 Signaling (BIRC2, JUN, MAPK8 and RELA) were amongst the most enriched by Mav (Figure 4A, Table S1). Importantly, these pathways were not specific for Mav, as they were also affected during Mtb infections (Figure S5). GO Enrichment analysis with the 39 DEGs enriched in the top 10 pathways affected after Mav identified a potential more dominant role of phospholipases during Mav infection (Figure 4B, Table S1). We observed that the expression of NAPE‐PLD and PLD6 (phospholipase D6) was significantly downregulated, while PLCL1 (phospholipase C like 1) and PLD1 (phospholipase D1) were significantly upregulated by Mav and not by Mtb (Figure 4C). Interestingly, in response to both Mav and Mtb, we observed a significant downregulation of FFAR4 (Table S1), described to reduce lipid accumulation in macrophages (Zhang et al. 2024). These observations suggest that host lipid metabolism is important for both mycobacteria, as is well known for Mtb (van der Klugt et al. 2024).
Genes significantly regulated only by either Mav or Mtb indicate subtle, but not infection‐specific changes in host signaling pathways. (A) The top 10 most significantly enriched IPA pathways of the 561 DEGs in exclusively Mav‐infected macrophages compared with uninfected controls. The enriched pathways were ranked by log 10 p‐value of gene enrichment. (B) GO enrichment analysis showing the top GO terms for biological process, molecular function, and cellular component categories enriched for DEGs enriched in the pathways shown in A. The enriched ontology clusters were ranked by log10 p‐value of gene enrichment. (C) Heatmap showing the expression patterns of phospholipases that were exclusively induced by Mav infection at 2 (T2) and/or 6 (T6) hours postinfection, in comparison to uninfected controls, complemented with available expression data of phospholipases which were not affected by infection. Asterisk () indicates a DEG in comparison to uninfected controls. (D) The top 10 most significantly enriched IPA pathways of the 323 DEGs induced in exclusively Mtb‐infected macrophages compared with uninfected controls. The enriched pathways were ranked by log 10 p‐value of gene enrichment. (E) GO enrichment analysis showing the top GO terms for biological process, molecular function, and cellular component categories enriched for DEGs enriched in the pathways shown in E. The enriched ontology clusters were ranked by log10 p‐value of gene enrichment. (F) Heatmap showing the expression patterns of type I and II interferon signaling that were exclusively induced by Mtb infection at 2 (T2) and/or 6 (T6) hours postinfection, in comparison to uninfected controls, complemented with available expression data of interferon genes which were not detected (grey). Asterisk () indicates a DEG in comparison to uninfected controls. Grey box indicates no expression values could be determined.
The genes that were significantly affected by Mtb were enriched in pathways associated with an immune response characterized by interferon‐alpha/beta (IFIT5, IFIT1, IFIT3, IRF4, ISG15, MX1, and MX2) and interferon‐gamma (GBP3, IRF4, JAK2, OAS2, PTPN2, and TRIM5) signaling pathways, as well as interferon‐stimulated gene 15 (ISG15) signaling (IFIT1, MX1, MX2, DTX3L, HERC5, IRF4, ISG15, ITGA2, and RIGI) (Figure 4D). GO Enrichment analysis with the 29 DEGs enriched in the top 10 pathways after Mtb infection showed that these genes were associated with signaling in response to pathogens, consisting of mainly type I and type II interferon responses (Figure 4E). Like Mtb, Mav stimulated the expression of genes involved in interferon signaling (Figure 4F). This observation is reflected by the fact that these pathways were enriched among the transcriptomic response to both Mav and Mtb infections (Figure S5). However, while Mtb evoked both type I and type II interferon signaling, Mav mainly affected type II interferon signaling. An exception was IFNB1, which was solely induced upon Mav infection.
Genes Differentially Expressed in Macrophages Infected With Mav Compared to Mtb Are Associated With Lipid Metabolism, Immediate Early Genes, and the GIMAP Family
2.4
In the previous analyses, we focused on the DEGs that were identified relative to uninfected controls. In the following analysis, the magnitude of gene expression was compared between the two infections to uncover significant changes between Mav and Mtb that may have been overlooked in comparison with uninfected controls. At 2 h postinfection, this comparison revealed 14 genes that were significantly upregulated by Mav compared to Mtb and no genes that were downregulated in Mav (Figure 5A, Table 1; Tables S1 and S2). At 6 h postinfection, Mav infection resulted in 13 DEGs with downregulated expression levels and 17 DEGs with significantly upregulated expression levels compared to Mtb infection (Figure 5B, Table 1; Tables S1 and S2). Protein–protein interaction (PPI) network analysis using the Search Tool for the Retrieval of Interacting Genes (STRING) database identified three distinct interaction networks including 24 of 38 genes: IEG transcription regulators, GIMAPs, and cytokines (Figure 5C). Interestingly, among the genes that were not associated with a network, FFAR2 and GPR65 are related to lipid binding and/or metabolism and were significantly higher expressed in Mav‐infected macrophages compared to those infected with Mtb (Table S2) (Al Mahri et al. 2022; Lin et al. 2017; Xu et al. 2024).
*Genes differentially expressed in macrophages infected with Mav compared to Mtb. (A, B) Volcano plots showing DEGs among biological conditions of primary human macrophages at 2 (A) or 6 (B) hours postinfection with Mav versus Mtb (n = 7). Only log2 fold change (Log2FC) ≥ 1.5 or ≤ 1.5 and false discovery rate‐adjusted p‐values < 0.05 were analyzed. The upregulated genes are labeled red and downregulated genes are labeled blue. Nondifferentially expressed genes are labeled black. (C) PPI network showing the DEGs from Mav‐infected macrophages compared with Mtb‐infected macrophages from A, B. The color representation indicates three distinct networks. Outline of genes indicates expression is increased (red) or decreased (blue), at 2 h (upper circle) or 6 h (lower circle), or both timepoints (full circle), postinfection with Mav compared to Mtb infection. (D) Transcript levels (count per million; CPM) of NGFR in uninfected (grey), and Mav (blue shaded)‐ and Mtb (orange shaded)‐infected macrophages at 2 and 6 h postinfection. Differences were statistically significant by a Friedman test with Dunn's multiple comparison test. *p < 0.001. (E‐F) Correlations between log2‐transformed transcript levels (counts per million; CPM) of EGR1 vs. TNF (E) or IL1B (F). The r 2 describes the Pearson coefficients of determination between genes for infected conditions (all samples except those uninfected). (G) Heatmap showing the expression patterns of GIMAPs that were differentially regulated in Mav‐infected macrophages at 2 (T2) and/or 6 (T6) hours postinfection, compared to uninfected or Mtb‐infected macrophages, complemented with available expression data of GIMAPs which were not affected by infection. Asterisk () indicates differential expression when compared to uninfected controls, whereas number sign (#) indicates differential expression between Mav and Mtb.
The first network consisted of IEGs FOS, FOSB (AP‐1 transcription factor complex), EGR1, EGR4 (EGR family of transcription factors), and ARC, which were all found to increase after Mav infection relative to Mtb infection (Table 1). IEGs play key roles in regulating various biological processes including cell proliferation, differentiation and survival, and the production of pro‐inflammatory cytokines IL‐1β and TNF (Bahrami and Drablos 2016; Silverman et al. 2001; Yan et al. 2000). EGR1, EGR4, FOS, FOSB and ARC are part of the Reactome pathway of nerve growth factor (NGF)‐stimulated transcription (R‐HSA‐9031628). NGF signaling involves a high‐affinity receptor, TrkA, and a low‐affinity receptor, p75/NGFR, which upon activation either induce cell survival or apoptosis, respectively (Bruno et al. 2022; Dechant and Barde 2002). Expression of the p75/NGFR gene was low at baseline but became significantly upregulated 6 h postinfection with Mav, in line with upregulation of its signaling pathway (Figures 4A and 5D). Therefore, we investigated a potential link with pro‐apoptotic gene regulation by examining the expression of additional key apoptosis markers. The anti‐apoptotic gene BCL2 was significantly upregulated, particularly in Mav‐infected macrophages while the pro‐apoptotic gene BAX was significantly downregulated in macrophages infected with either Mav or Mtb (Figure S6A,B), actually suggesting a shift towards host cell survival rather than apoptosis, especially in Mav‐infected cells. Given the role of IEGs in the production of pro‐inflammatory cytokines, we next investigated whether their expression correlated with transcription of pro‐inflammatory cytokines. Indeed, EGR1 expression correlated well with TNF (r ^2^ = 0.50, p < 0.001; Figure 5E), IL1B (r ^2^ = 0.46, p < 0.001; Figure 5F) as well as IL6 (r ^2^ = 0.44, p < 0.001). Together, these findings suggest that IEG upregulation in Mav‐infected macrophages is associated with increased pro‐inflammatory cytokine responses.
The second network consisted of genes of the GIMAP family, which were significantly downregulated in macrophages infected with Mav compared to those infected with Mtb. GIMAP1 and GIMAP6 showed reduced expression in macrophages 6 h postinfection with Mav and Mtb compared to uninfected controls, with significantly more silencing by Mav compared to Mtb (Figure 5G). Although GIMAP5 and GIMAP2 were not significantly affected by mycobacterial infection when compared to uninfected controls, these genes were downregulated in macrophages infected with Mav compared to Mtb. Furthermore, while not differentially regulated between the two mycobacteria, GIMAP4 and GIMAP7 were significantly silenced by both Mav and Mtb 2 h postinfection in comparison to uninfected controls.
Finally, the third PPI network consisted of genes encoding mainly cytokines. While we observed that both Mav and Mtb triggered significant early cytokine responses in macrophages compared to noninfected controls, Mav induced a more pronounced upregulation of several cytokines compared to Mtb. At 2 h postinfection, these cytokines included IL23A, IL6, IL1B, IL12B, CCL3L3, TNF and CSF3 (Table 1). At 6 h postinfection, the upregulation of IL23A, IL6, CCL3L3, and CSF3 persisted, along with the downregulation of CCL8 and CCL2 and additional upregulation of cytokines TNFSF15, CSF2, and CCR7 in response to Mav compared to Mtb (Table 1, Figure 5C). The heightened expression of these molecules in response to Mav suggests this infection might be stimulating a more intense or swifter activation of immune pathways compared to Mtb. In addition, macrophages infected with Mav or Mtb showed increased expression of PTGS2, which was significantly higher upon Mav compared to Mtb infection.
Taken together, macrophages infected with Mav showed upregulation of pro‐inflammatory cytokines compared to Mtb infection, which was correlated with increased expression of IEG transcription factors, whereas transcription of GIMAP genes was downregulated.
Validation of Upregulated Cytokine Expression by Assessing Cytokine Secretion by Mav‐ and Mtb‐Infected Macrophages
2.5
To validate the transcriptome analysis results of cytokine production (Figure S7A), secretion of a number of DEGs encoding cytokines in the supernatants of macrophages infected with Mav or Mtb 24 h postinfection was measured using the Luminex assay. Compared to uninfected controls, both Mav and Mtb infection resulted in the induction of IL‐6, IL‐1β, TNF, IFN‐γ, and to a lesser extent IL‐12B and IFN‐α2 (Figure 6). Induction of CSF2 and CSF3 by Mav or Mtb was not evident. Moreover, the transcriptome analysis between Mav‐ and Mtb‐infected macrophages indicated the higher expression of certain cytokines after Mav infection (Table 1, Figure S7). While Mtb rather than Mav tended to induce higher levels of certain cytokines, no statistically significant differences in cytokine production were observed between Mav and Mtb infections (Figure 6, Figure S7).
*Cytokine production by Mav‐ and Mtb‐infected macrophages. Supernatants of Mav‐ and Mtb infected macrophages collected 24 h postinfection were assessed for IL‐6, IL‐1β, IL‐12B, TNF, IFN‐γ, IFN‐α2, CSF2 and CSF3 by the Luminex assay. Data represent the mean ± SD from different donors (n = 3). Dots represent the mean from duplicate wells of a single donor. Statistical significance was tested using a one‐way ANOVA with Tukey's multiple comparisons test. *p < 0.05 and *p < 0.005.
Discussion
3
There is a paucity of studies investigating the host‐pathogen interactions and host transcriptomic response in Mav‐infected primary human macrophages, cells crucial in immunity against Mav infection. Here, we report the first genome‐wide transcriptome analysis of macrophages infected with Mav, and directly cross‐reference these observations with Mtb infection. Our findings indicate that the transcriptional response to both infections largely overlaps, while some infection‐specific responses are at play. The shared response to Mav and Mtb primarily involved cytokine signaling responses and GPCR signaling. In contrast, when comparing Mav and Mtb to one another and uninfected controls, differences were observed in the regulation of lipid metabolism, IEG transcription factors, and the less‐explored GIMAPS. Overall, we found alterations in the host response to both mycobacteria, providing insights into the shared and distinctive host processes that may play a role in the intracellular control of Mav and Mtb, and which potentially offer targets for host‐directed therapy.
Macrophages have a leading role in mycobacterial killing, antigen presentation, and directing immune responses. Cytokines like TNF, IL‐1β, IL‐6, and IL‐10 produced by macrophages upon activation of pattern recognition receptors including Toll‐like receptors (TLR) are crucial in bridging the innate and adaptive immune responses to mycobacterial infection (Park et al. 2022). Consistent with previous findings, we observed a significant increase in pro‐inflammatory cytokines (IL12B, IL23A, TNF, IL1B, IL6, CCL20, CSF3, and CSF2) in macrophages within hours of Mav or Mtb infection (Agdestein et al. 2014; Greenwell‐Wild et al. 2002; Casey et al. 2015; Kawka et al. 2023). Some of these cytokines in turn regulate TLR transcription to create feedback loops (Wang et al. 2000). We found increased TLR2 expression and decreased TLR5 expression in macrophages up to 6 h postinfection with Mav and Mtb, as observed in prior studies (Agdestein et al. 2014; Wang et al. 2000; Ariel et al. 2019). In addition, TLR3 and TLR6 were downregulated in Mav‐ and Mtb‐infected macrophages. Our cytokine secretion data validate that cytokine responses are a common feature of both Mav and Mtb infections. At 2 h postinfection, however, differential expression analysis of infected macrophages showed a higher expression of pro‐inflammatory cytokines such as TNF, CSF3, and IL6 in response to Mav as compared to Mtb, which did not result in differences in cytokine secretion patterns between Mav‐ and Mtb‐infected macrophages. Possibly, cytokine gene expression upon Mtb infection is slightly delayed as compared to Mav infection, which may be associated with the suggestion that mycobacterial virulence is inversely related to their ability to induce pro‐inflammatory cytokines as an immune evasion strategy (Strohmeier and Fenton 1999; Borrmann et al. 2011; Feng et al. 2020). Overall, these results reveal that early cytokine responses in macrophages are largely shared between Mav and Mtb, while minor pathogen‐specific variations may play a role in shaping the host immune environment.
Comparing the host transcriptomic response to Mav and Mtb revealed that both infections affected interferon signaling, which was more pronounced following Mtb infection. Both Mav and Mtb upregulated genes related to type II interferon (IFN) signaling. Interestingly, Mav affected type I IFN signaling only by upregulation of IFNB1 (type I IFN), while Mtb induced the expression of genes downstream of type I IFN signaling (including OAS2, MX1, MX2, ISG15). In line with this, both Mav and Mtb seemed to induce secretion of IFN‐γ to a similar extent, whereas secretion of IFN‐α2 was slightly higher for Mtb‐infected macrophages. While type II IFN (i.e., IFN‐γ) is required for the resistance to mycobacteria, there is a lack of consensus on the role of type I IFNs in mycobacterial infections. In Mav‐infected mice, continuous IFN‐β infusion increased resistance, as evidenced by reduced bacterial loads (Denis 1991). In contrast, type I IFN worsens Mtb infections (Cooper et al. 2011), as shown by reduced bacterial loads in type I IFN receptor‐deficient mice, and increased bacterial burden and pathology associated with recruitment of permissive macrophages via CCL2 when IFN‐α/β was induced (Antonelli et al. 2010; Sabir et al. 2017). Remarkably, CCL2 was more strongly downregulated in macrophages infected by Mav compared to Mtb. Moreover, type I IFN induces the immunosuppressive cytokine IL‐10 and suppresses IL‐1β production, resulting in the loss of protection against Mtb (Novikov et al. 2011; Mayer‐Barber et al. 2011; McNab et al. 2014). IL1B was more strongly upregulated in Mav‐infected cells compared to Mtb at 2 h. IL‐1β has a reciprocal control of type I IFN by controlling type I IFN‐induced accumulation of permissive macrophages at the site of infection through prostaglandin E2 (Mayer‐Barber et al. 2014). In line with the expression pattern of IL1B, PTGS2, which encodes for COX2 that mediates the production of prostaglandin E2, was more strongly upregulated by Mav compared to Mtb at 2 h. The disappearance of IL1B and PTGS2 expression differences between Mav and Mtb at 6 h postinfection may explain the comparable cytokine secretion observed following both infections. Taken together, IFN signaling was affected by both Mav and Mtb infection, with considerable variation over time.
The host transcriptomic regulation by Mav and Mtb infection also involved many genes linked to lipid metabolism, with some clear differences between both infections. Fatty acids are the most energy‐dense substrates for energy production and are components of phospholipids in cell membranes (Remmerie and Scott 2018). When nutrients are in excess, fatty acids can be stored as triglycerides, together with cholesteryl esters, in lipid droplets, which can be accessed via lipophagy (hydrolysis of lipid droplets by lipo‐autophagosomes and lysosomes) or lipolysis (enzymatic hydrolysis of contents of cytosolic lipid droplets) during nutrient starvation (Zechner et al. 2017). We found that infection with Mav and Mtb commonly upregulated HCAR2 (promotes lipid accumulation associated with Mtb survival) (Naz and Arish 2022), downregulated FFAR4 (reduces lipid accumulation) (Stuttgen and Sahoo 2021), and upregulated GPR156 (increases lipid accumulation) (Kalam et al. 2023), indicating mycobacterial infection induces the accumulation and availability of lipids. Moreover, Mav and Mtb infections downregulated GPR34 and closely related GPR82 (both inhibit lipolysis) (Yasuda et al. 2023; Engel et al. 2011; Andreu et al. 2017; Liebscher et al. 2011) and upregulated GPR84, GPR132, and GPR183 (all three involved in sensing fatty acids or cholesterol) (Wang et al. 2006; Hannedouche et al. 2011; Foster et al. 2019; Foo et al. 2023; Recio et al. 2018). In addition, the expression of FFAR2 (i.e., GPR43), associated with inhibition of lipolysis (Al Mahri et al. 2022), varied in time and was more strongly downregulated by Mav compared to Mtb infection. Lipid metabolism is known to be crucial for Mtb survival during infections; Mtb stimulates intracellular lipid accumulation and access to cytosolic lipids by escaping the phagosome or promoting the transport of lipid droplets to mycobacteria‐containing vacuoles (van der Klugt et al. 2024), creating a nutrient‐rich environment that supports mycobacterial growth (Choi et al. 2024). While knowledge of the modulation of the host lipid metabolism during Mav infections is limited (Thirunavukkarasu et al. 2016), our findings suggest that lipid metabolism is also essential during Mav infections. Indeed, there is a clear association between lower body fat mass and the development of Mav‐LD (Kartalija et al. 2013; Tasaka et al. 2010), and increased fatty acid metabolism has been linked to disease progression (Choi et al. 2024), indicating that altered lipid metabolism is also involved during Mav infection. This is supported by Mav‐infected mice showing a correlation between increased fatty acid uptake and the formation of lipid‐rich foamy macrophages with the progression of pulmonary disease (Choi et al. 2024). Notably, Mav but not Mtb induced significant changes in the expression of phospholipases, which have a hydrolytic activity on host membrane phospholipids, resulting in the release of fatty acids for energy consumption, or anabolism of other lipids. These findings suggest that Mav, like Mtb, modulates lipid metabolism, possibly through different strategies in the battle between the host and mycobacteria for host lipids.
Other genes differentially regulated by Mav included several IEGs, which in turn regulate expression of genes associated with cell proliferation, differentiation, pro‐inflammatory cytokines and survival (Bahrami and Drablos 2016). Apoptosis of infected macrophages is a tightly regulated host defense mechanism that limits bacterial growth and promotes adaptive immunity, unlike necrosis, which involves cell lysis and bacterial release (Behar et al. 2011). The role of apoptosis in both Mav and Mtb infection is debated, as inhibition of apoptosis is recognized as a key strategy to impair host immunity (Keane et al. 2002; Liu et al. 2015; Bermudez et al. 2015; Early et al. 2011). However, mycobacteria can also benefit from the induction of apoptosis, which enables them to escape from dying cells to infect neighboring cells (Augenstreich et al. 2017; Aguilo et al. 2013; Fratazzi et al. 1997). Here, we observed that Mav infection induced expression of pro‐apoptotic neurotrophic factor receptor p75/NGFR 6 h postinfection (Bruno et al. 2022; Dechant and Barde 2002), although the NGF ligand was not detected. Increased expression of prosurvival BCL2 and reduced expression of pro‐apoptotic BAX suggested that apoptosis was overall suppressed by both Mav and Mtb. This also indicates that IEGs did not specifically regulate apoptosis‐related gene expression in Mav‐infected macrophages. Instead, elevated expression levels of IEGs in Mav‐infected macrophages correlated positively with expression levels of pro‐inflammatory cytokines. Consistent with this, studies with EGR1 knockout mice have previously demonstrated that transcription factor EGR1 is involved in the production of IL‐1β and TNF (Silverman et al. 2001; Yan et al. 2000). Hence, Mav seems to elicit a stronger early transcriptional programme involving IEGs, which augments the proinflammatory cytokine response, as compared to Mtb.
Lastly, multiple GIMAPs were downregulated by both mycobacterial infections, and this downregulation was more pronounced during Mav infections. GIMAP4 and GIMAP7 were comparably silenced in macrophages by both Mav and Mtb 2 h postinfection. At 6 h postinfection, however, Mav showed a stronger suppression of GIMAP1, GIMAP2, GIMAP5, and GIMAP6 expression compared to Mtb. To our knowledge, this is the first report that describes the differential expression of GIMAPs in human macrophages infected with mycobacteria. However, similar expression patterns were previously observed, although not described, in Mav‐infected macrophages (Agdestein et al. 2014). While the role of these proteins has mainly been described for the maintenance of lymphocytes (Pascall et al. 2018; Saunders et al. 2010; Schnell et al. 2006), GIMAPs are also thought to be important in intracellular trafficking, as well as autophagy and lysosome function (Limoges et al. 2021; Yao et al. 2022), processes considered important in immune defenses against mycobacteria. GIMAP2 is found on lipid droplets to which it recruits GIMAP7, suggesting a role for these GIMAPs in lipid droplet trafficking (Schwefel et al. 2010). Furthermore, mutations in GIMAP5, which resides on lysosomes, are linked to increased autoimmune susceptibility (Pascall et al. 2018), but its function in macrophages remains to be determined. GIMAP6 is involved in regulating efficient autophagy and facilitates antibacterial innate immunity by binding to and clearing pathogens (Pascall et al. 2018, 2013; Yao et al. 2022). Finally, GIMAP6 was downregulated in cattle infected with Mav subspecies paratuberculosis, while its role in disease susceptibility remains unknown (Thirunavukkarasu et al. 2014). Taken together, while it remains unclear what the exact roles of GIMAPs are during mycobacterial infection, the more profoundly reduced expression of these proteins observed upon Mav infection may indicate a stronger impairment of the macrophage's ability to manage the infection. More investigation into the role of GIMAPs during mycobacterial infection is desired and may reveal novel targets for HDT.
This study has several limitations that should be considered. Firstly, as a validation strategy, cytokine regulation was assessed by a Luminex, but other differences found in the transcriptomic data were not validated further by complementary analyses. Hence, the findings from this study require further validation. Secondly, the analysis focused exclusively on early time points postinfection, which represents only a snapshot of macrophage activity shortly after infection and may not reflect the longer‐term dynamic regulation of macrophage functions. Insufficient RNA yields at later time points (24 h postinfection) unfortunately limited our ability to assess gene expression over a prolonged time course. Finally, the bulk RNA‐seq data represent a heterogeneous population of infected and uninfected macrophages, and may therefore capture broader transcriptional changes occurring in the infection environment. Despite these limitations, a strength of this study was the use of RNA‐seq, which, unlike microarray studies performed previously on Mav‐infected cells (Agdestein et al. 2014; Blumenthal et al. 2005; Greenwell‐Wild et al. 2002; McGarvey et al. 2004), offers significant advantages including unbiased, genome‐wide transcriptome profiling of host gene expression without requiring preexisting genome sequence information. Additionally, our study directly compares Mav and Mtb infections across primary human macrophages from matched donors, providing relevant insights into the differential responses of macrophages to these two mycobacterial infections. This direct comparison between Mav and Mtb facilitates extrapolation of shared findings given the wealth of studies that have functionally validated RNA regulation by Mtb.
In conclusion, this study on the host transcriptomic regulation of the human macrophage response to Mav and Mtb infection reveals a significant overlap between these infections in gene expression patterns. However, also distinct effects were observed in macrophage gene expression, being particularly pronounced during Mav infection. The functional implications of these expression patterns remain to be determined, in which our results provide direction to further explore host–pathogen interactions during Mav and Mtb infections.
Experimental Procedures
4
Cell Culture
4.1
Buffy coats were collected from healthy anonymous Dutch adult donors after written informed consent (Sanquin Blood Bank, Amsterdam, The Netherlands). Primary human macrophages were obtained as previously described (Kilinc et al. 2022). In short, CD14+ monocytes were isolated from peripheral blood mononuclear cells using density gradient centrifugation with Ficoll (Pharmacy, LUMC, the Netherlands) and subsequently magnetic‐activated cell sorting (MACS) with anti‐CD14‐coated microbeads (Miltenyi Biotec, Auburn, CA, USA). Purified CD14+ monocytes were cultured for 6 days at 37°C/5% CO_2_ in Gibco Dutch modified Roswell Park Memorial Institute (RPMI) 1640 medium (ThermoFisher Scientific, Landsmeer, the Netherlands) supplemented with 10% fetal calf serum (FCS), 2 mM L‐glutamine (PAA, Linz, Austria), 100 units/mL penicillin, 100 μg/mL streptomycin, and 50 ng/mL macrophage colony‐stimulating factor (M‐CSF, R&D Systems, Abingdon, UK) for anti‐inflammatory M2 macrophage differentiation. Cytokines were refreshed at day 3 of differentiation. One day prior to experiments, macrophages were harvested and seeded into flat‐bottom 96‐well plates (30,000 cells/well), if not indicated otherwise, in complete RPMI medium without antibiotics or cytokines. Macrophage differentiation was validated based on cell surface marker expression (anti‐human CD163‐PE, CD14‐PE‐Cy7, and CD1a‐Alexa Fluor 647 (1:20) from Biolegend (Amsterdam, the Netherlands) and anti‐human CD11b‐BB515 (1:20) from BD Biosciences) using flow cytometry and secretion of cytokines (IL‐10 and IL‐12) following 24 h stimulation of cells with 100 ng/mL lipopolysaccharide (InvivoGen, San Diego, United States) using ELISA.
Bacterial Cultures
4.2
Mav‐Wasabi (laboratory strain 101) and Mtb‐Venus (H37Rv) were cultured in Difco Middlebrook 7H9 broth supplemented with 0.2% glycerol, 10% Middlebrook ADC (albumin, dextrose, catalase), and 0.05% Tween‐80 (Kilinc et al. 2022; Korbee et al. 2018). Prior to experiments, bacterial concentrations were determined by measuring the optical density at 600 nm (OD_600_).
Bacterial Infection of Cells
4.3
Infection experiments were performed as previously described (Kilinc et al. 2022; Korbee et al. 2018). Briefly, 1 day before infection, Mav and Mtb cultures were diluted to a density corresponding with early log‐phase growth, OD_600_ of 0.25. On the day of macrophage infection, bacterial suspensions were diluted in antibiotic‐free cell culture medium to consistently infect cells with a multiplicity of infection (MOI) of 10. The accuracy of the MOI was verified using a standard CFU assay. Following inoculation of the cells, plates were centrifuged for 3 min at 130 RCF and incubated for 1 h at 37°C/5% CO_2_. Cells were then treated with cell culture medium supplemented with 30 μg/mL gentamicin for 10 min to inactivate and remove residual extracellular bacteria, after which the medium was refreshed with medium containing 5 μg/mL gentamicin sulfate before cells were incubated at 37°C/5% CO_2_ until indicated timepoints. Following incubation, supernatants were either stored at −20°C for Luminex assay or discarded. To assess the percentage of infected cells, cells were washed, fixed with 1% paraformaldehyde, and measured on a BD Accuri C6 Plus flow cytometer before analysis using FlowJo v10 software (BD Biosciences). Alternatively, cells were lysed using 100 μL of lysis buffer (H2O + 0.05% SDS) for the determination of intracellular bacterial burden using a CFU assay or lysed for RNA extraction as described below.
RNA Isolation and Sequencing
4.4
Total RNA was extracted from Mav‐ or Mtb infected macrophages seeded in a flat bottom 6‐wells plate (900,000 cells/well) with 350 μL TRIzol reagent (Thermo Fisher Scientific) and using the Direct‐zol RNA miniPrep kit (Zymo Research, Leiden, Netherlands) according to the manufacturer's protocol. Samples were diluted in 25 μL RNA‐free water, and the total RNA concentration of each sample was quantified using DeNovix DS‐11 Spectrophotometer (ThermoFisher Scientific). Nanodrop (ThermoFisher Scientific) was used to determine RNA purity. Gene expressions were profiled using the NovaSeq 6000 platform (Illumina, San Diego, CA, USA) by GenomeScan (Leiden, Netherlands).
Data Processing and Analysis
4.5
RNA‐Seq files were processed using the opensource BIOWDL RNAseq pipeline v5.0.0 (https://zenodo.org/record/5109461#.Ya2yLFPMJhE) developed at the LUMC. This pipeline performs FASTQ preprocessing (including quality control, quality trimming, and adapter clipping), RNA‐Seq alignment, read quantification, and optionally transcript assembly. FastQC was used for checking raw read QC. Adapter clipping was performed using Cutadapt (v2.10) with default settings and standard lllumina universal adapter “AGATCGGAAGAG”. RNA‐Seq reads' alignment was performed using STAR (v2.7.5a) on GRCh38 human reference genome. umi_tools (v1.1.1) was used to remove PCR duplicates detected with UMIs. The gene read quantification was performed using HTSeq‐count (v0.12.4) with setting “–stranded = reverse”. The gene annotation used for quantification was Ensembl version 111. Using the gene read count matrix, CPM was calculated per sample on all annotated genes. Genes with a higher log2CPM than 1 in at least 25% of all samples are kept for downstream analysis.
For the differential gene expression analysis and PCA plot creation, dgeAnalysis R‐shiny application (https://github.com/LUMC/dgeAnalysis/tree/v1.4.4) was used. EdgeR (v3.34.1) with TMM normalization was used to perform differential gene expression analysis using donor as covariate. Genes with log2(fold change) ≥ 1.5 or ≤ −1.5 and Benjamini and Hochberg false discovery rate (FDR) adjusted p‐values < 0.05 were designated as differentially expressed genes (DEGs).
Functional Enrichment Analysis
4.6
To classify the functions of the DEGs, functional enrichment analysis and clustering of biological pathways was performed through the use of QIAGEN Ingenuity Pathway Analysis (IPA) (QIAGEN Inc., https://digitalinsights.qiagen.com/IPA) (Kramer et al. 2014). In addition, enrichment of Gene Ontology (GO) categories biological process, cellular component and molecular function was analyzed. Enrichment with an adjusted P value of < 0.05 was considered significant. The protein–protein interaction (PPI) networks of DEGs were predicted using the Search Tool for the Retrieval of Interacting Genes (STRING) database.
Cytokine Secretion
4.7
Collected supernatants of uninfected or Mav‐ and Mtb‐infected macrophages were filtered in FiltrEX 96‐wells filter plates (Corning Costar) with pore size 0.2 μm to remove bacteria. The concentration of IL‐6, IL‐1β, TNF, IFN‐γ, IL‐12B, IFN‐α2, CSF2, and CSF3 was measured by diluting the supernatants four times with Luminex Assay buffer (Bio‐Rad, Hercules, CA, USA). Next, the Bio‐Plex Pro Human Cytokine 48‐plex Assay (Bio‐Rad) was performed according to the manufacturer's instructions. Samples were measured on a Bio‐Plex 200 System (Bio‐Rad). Per analyte, a lower and upper limit of detection was determined with standard curves. Concentrations measured below the assays' detection limit were set to 1 pg/mL, and those measured over the detection limit were set to the maximum quantifiable pg/mL per analyte.
Author Contributions
Gül Kilinç: conceptualization, methodology, investigation, formal analysis, visualization, writing – original draft, writing – review and editing. Robin H. G. A. van den Biggelaar: supervision, writing – review and editing. Tom H. M. Ottenhoff: funding acquisition, writing – review and editing. Leon H. Mei: methodology, investigation, data curation. Anno Saris: conceptualization, supervision, writing – review and editing
Disclosure
Copyright Statement: The graphical abstract was created using BioRender.com. Pathway and network analyses shown in Figure 3B,C were generated using Ingenuity Pathway Analysis (IPA, QIAGEN Inc.). Protein–protein interaction analysis shown in Figure 5C was generated using the STRING database.
Ethics Statement
Human blood samples were isolated from buffy coats obtained from healthy donors after written informed consent (Sanquin, Amsterdam, the Netherlands). The biological samples were sourced ethically, and their research use was in accordance with the terms of the informed consents under an IRB/EC approved protocol. The use of blood samples was approved by the Sanquin Ethical Advisory Board and in accordance with the Declaration of Helsinki.
Conflicts of Interest
The authors declare no conflicts of interest.
Supporting information
Data S1: mmi70045‐sup‐0001‐Supinfo.pdf.
Table S1: Gene expression value of Mav‐ and Mtb‐infected macrophages compared to uninfected controls.
The reference list from the paper itself. Each links out to its DOI / PubMed record.
- 1Agdestein, A. , A. Jones , A. Flatberg , et al. 2014. “Intracellular Growth of Mycobacterium Avium Subspecies and Global Transcriptional Responses in Human Macrophages After Infection.” BMC Genomics 15: 58.24450835 10.1186/1471-2164-15-58PMC 3906092 · doi ↗ · pubmed ↗
- 2Aggarwal, N. R. , F. R. D'Alessio , Y. Eto , et al. 2013. “Macrophage Adenosine Receptor 2a (A 2a R) Protects Against Oxygen‐Induced Augmentation of Experimental Lung Injury.” American Journal of Respiratory Cell and Molecular Biology 48, no. 5: 635–646.23349051 10.1165/rcmb.2012-0351 OCPMC 3707379 · doi ↗ · pubmed ↗
- 3Aguilo, J. I. , H. Alonso , S. Uranga , et al. 2013. “ESX‐1‐Induced Apoptosis Is Involved in Cell‐To‐Cell Spread of Mycobacterium Tuberculosis.” Cellular Microbiology 15, no. 12: 1994–2005.23848406 10.1111/cmi.12169 · doi ↗ · pubmed ↗
- 4Al Mahri, S. , S. S. Malik , M. Al Ibrahim , E. Haji , G. Dairi , and S. Mohammad . 2022. “Free Fatty Acid Receptors (FFA Rs) in Adipose: Physiological Role and Therapeutic Outlook.” Cells 11, no. 4: 750.35203397 10.3390/cells 11040750 PMC 8870169 · doi ↗ · pubmed ↗
- 5Andreu, N. , J. Phelan , P. F. de Sessions , J. M. Cliff , T. G. Clark , and M. L. Hibberd . 2017. “Primary Macrophages and J 774 Cells Respond Differently to Infection With Mycobacterium Tuberculosis .” Scientific Reports 7: 42225.28176867 10.1038/srep 42225 PMC 5296737 · doi ↗ · pubmed ↗
- 6Antonelli, L. R. , A. Gigliotti Rothfuchs , R. Goncalves , et al. 2010. “Intranasal Poly‐IC Treatment Exacerbates Tuberculosis in Mice Through the Pulmonary Recruitment of a Pathogen‐Permissive Monocyte/Macrophage Population.” Journal of Clinical Investigation 120, no. 5: 1674–1682.20389020 10.1172/JCI 40817 PMC 2860920 · doi ↗ · pubmed ↗
- 7Ariel, O. , D. Gendron , P. L. Dudemaine , N. Gevry , E. M. Ibeagha‐Awemu , and N. Bissonnette . 2019. “Transcriptome Profiling of Bovine Macrophages Infected by Mycobacterium Avium spp. Paratuberculosis Depicts Foam Cell and Innate Immune Tolerance Phenotypes.” Frontiers in Immunology 10: 2874.31969876 10.3389/fimmu.2019.02874 PMC 6960179 · doi ↗ · pubmed ↗
- 8Augenstreich, J. , A. Arbues , R. Simeone , et al. 2017. “ESX‐1 and Phthiocerol Dimycocerosates of Mycobacterium Tuberculosis Act in Concert to Cause Phagosomal Rupture and Host Cell Apoptosis.” Cellular Microbiology 19, no. 7: e 12726.10.1111/cmi.1272628095608 · doi ↗ · pubmed ↗