IRP1 deficiency alters mitochondrial metabolism and protects against metabolic syndrome pathologies
Wen Gu, Nicole Wilkinson, Carine Fillebeen, Darren M. Blackburn, Korin Sahinyan, Eric Bonneil, Tao Zhao, Zhi Luo, Vahab D. Soleimani, Vincent Richard, Christoph H. Borchers, Albert Koulman, Benjamin Jenkins, Bernhard Michalke, Hans Zischka, Judith Sailer, Vivek Venkataramani

TL;DR
Mice lacking IRP1 show altered energy metabolism and are protected against metabolic syndrome pathologies.
Contribution
IRP1 deficiency is shown to alter mitochondrial metabolism and protect against metabolic syndrome.
Findings
Irp1–/– mice develop fasting hypoglycemia and resist high-fat diet–induced hyperglycemia and hepatic steatosis.
IRP1 deficiency causes mitochondrial dysfunction and a shift to glycolytic ATP production.
Altered redox balance in IRP1-deficient mice leads to metabolic rewiring and increased insulin sensitivity.
Abstract
Iron regulatory protein 1 (IRP1) is a posttranscriptional regulator of cellular iron metabolism. In mice, loss of IRP1 causes polycythemia through translational de-repression of HIF2α mRNA, which increases renal erythropoietin production. Here, we show that Irp1–/– mice develop fasting hypoglycemia and are protected against high-fat diet–induced hyperglycemia and hepatic steatosis. Discovery-based proteomics of Irp1–/– livers revealed a mitochondrial dysfunction signature. Seahorse flux analysis in primary hepatocytes and differentiated skeletal muscle myotubes confirmed impaired respiratory capacity, with a shift from oxidative phosphorylation to glycolytic ATP production. This metabolic rewiring was associated with enhanced insulin sensitivity and increased glucose uptake in skeletal muscle. Under metabolic stress, IRP1 deficiency altered the redox balance of mitochondrial iron,…
Genes, proteins, chemicals, diseases, species, mutations and cell lines named across the full text — each resolved to its canonical identifier and authoritative record.
Click any figure to enlarge with its caption.
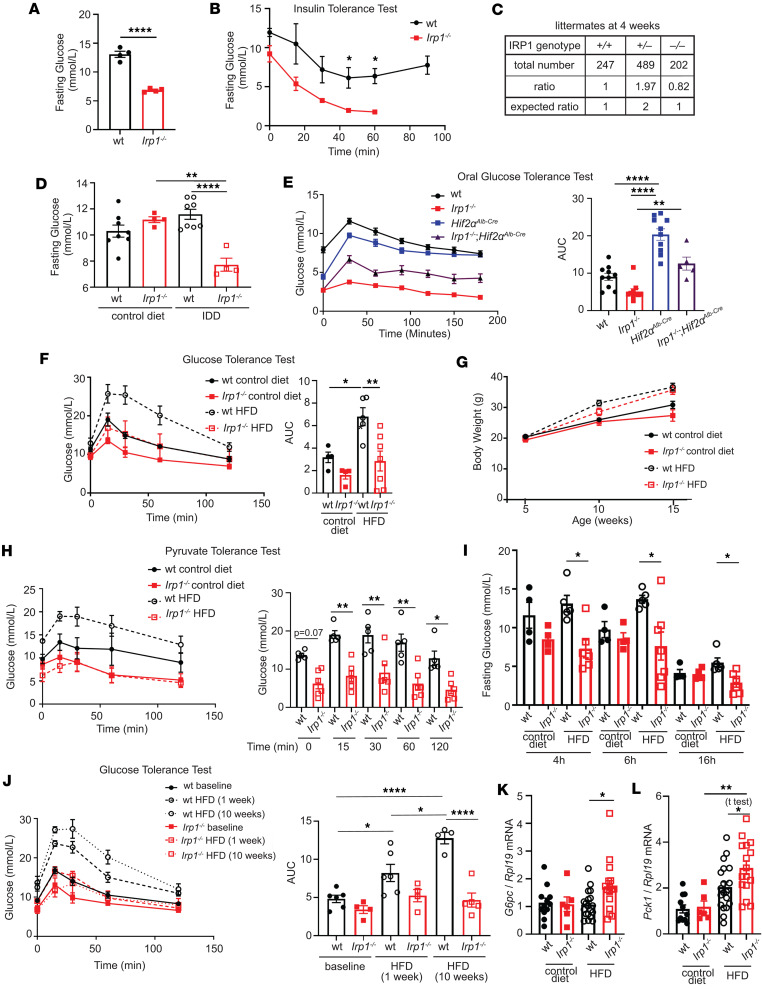 Figure 1
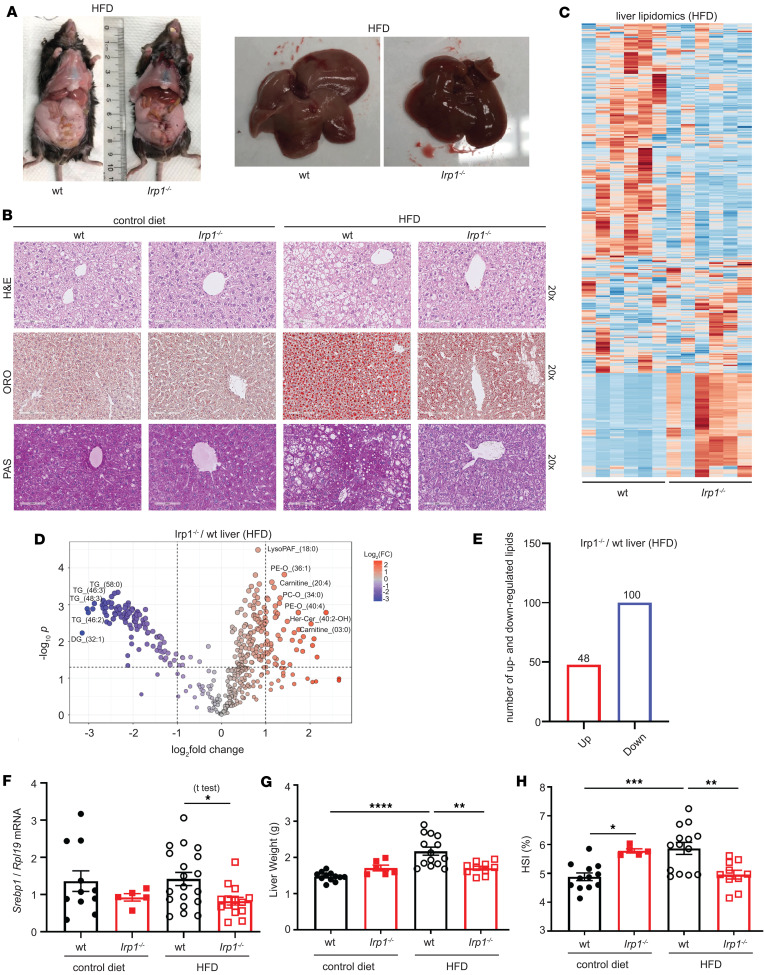 Figure 2
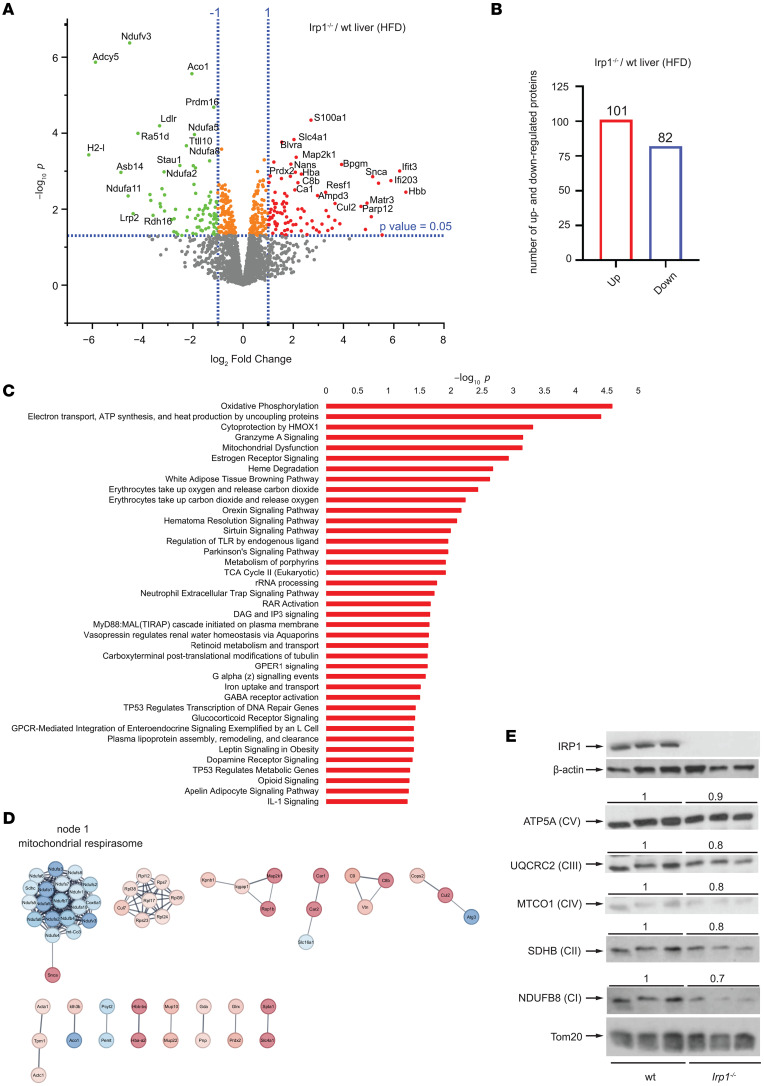 Figure 3
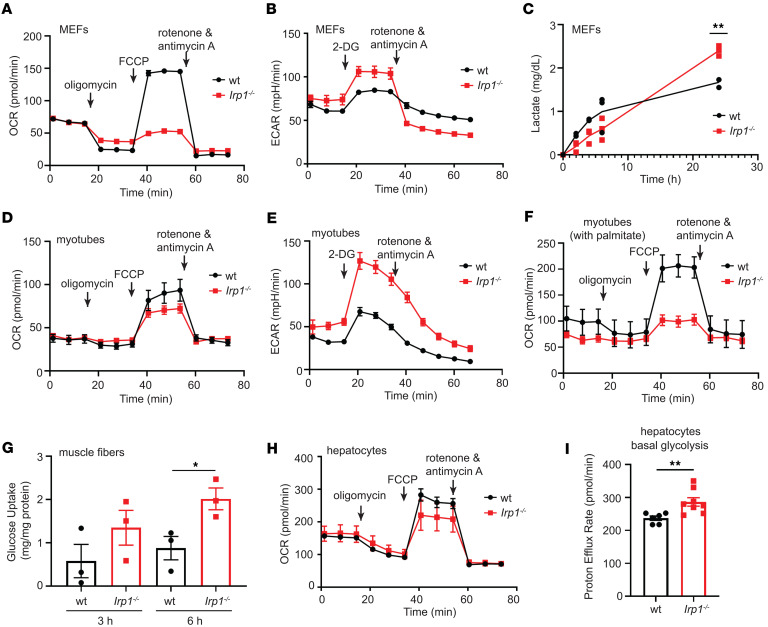 Figure 4
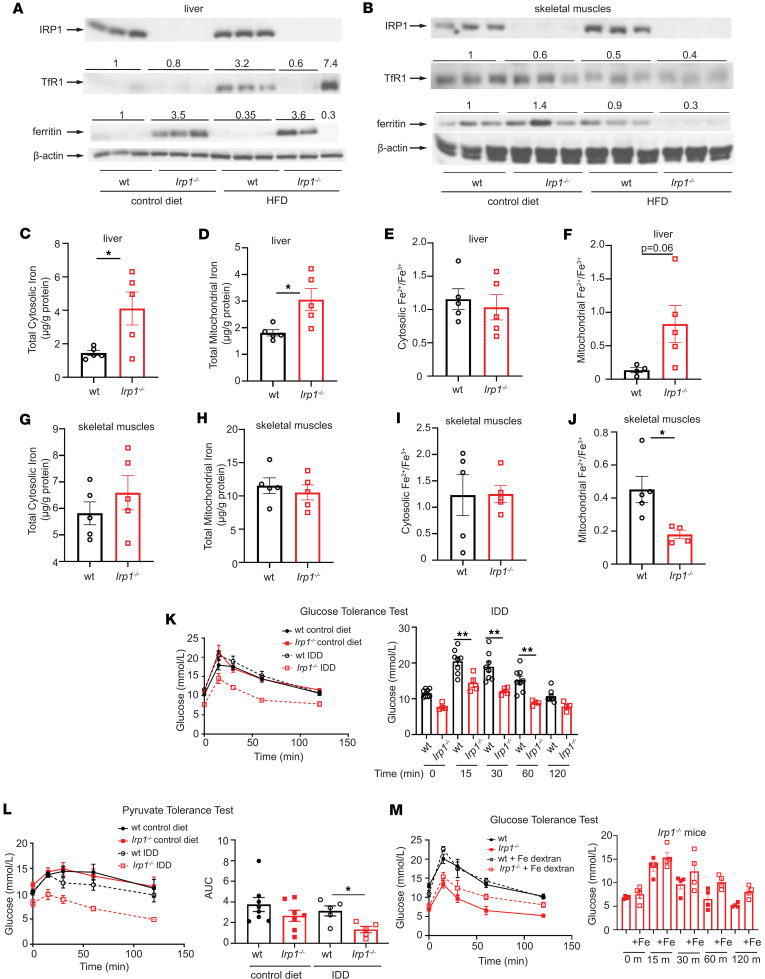 Figure 5
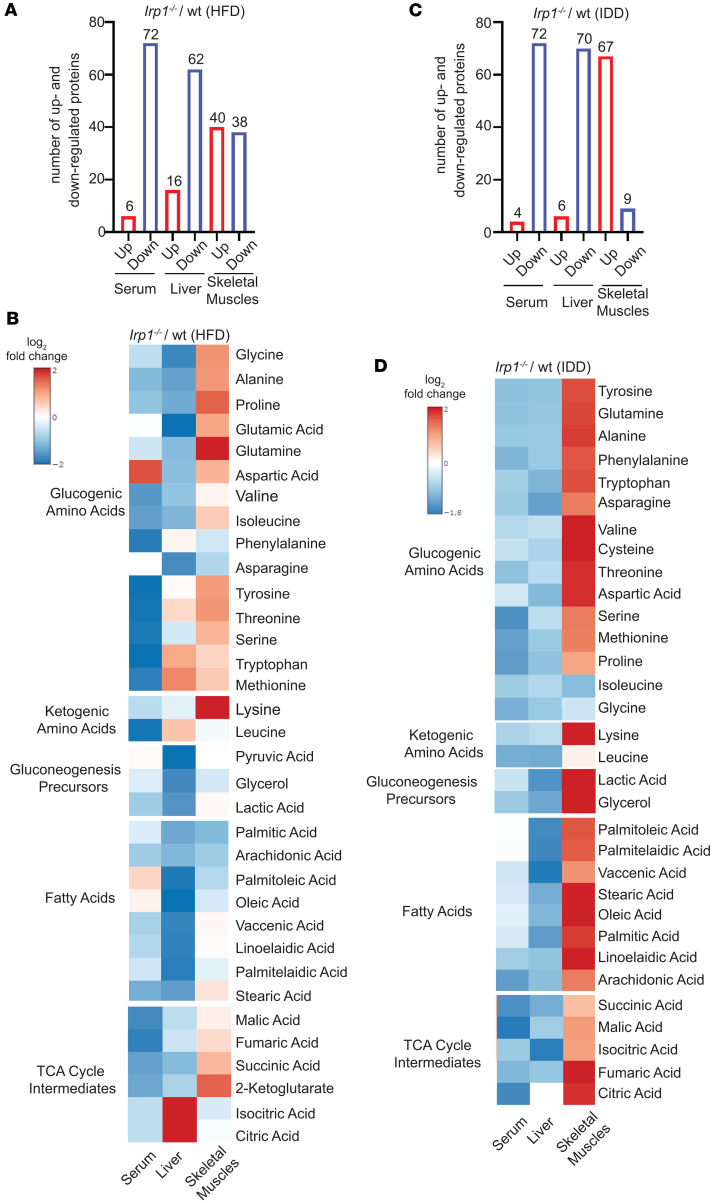 Figure 6
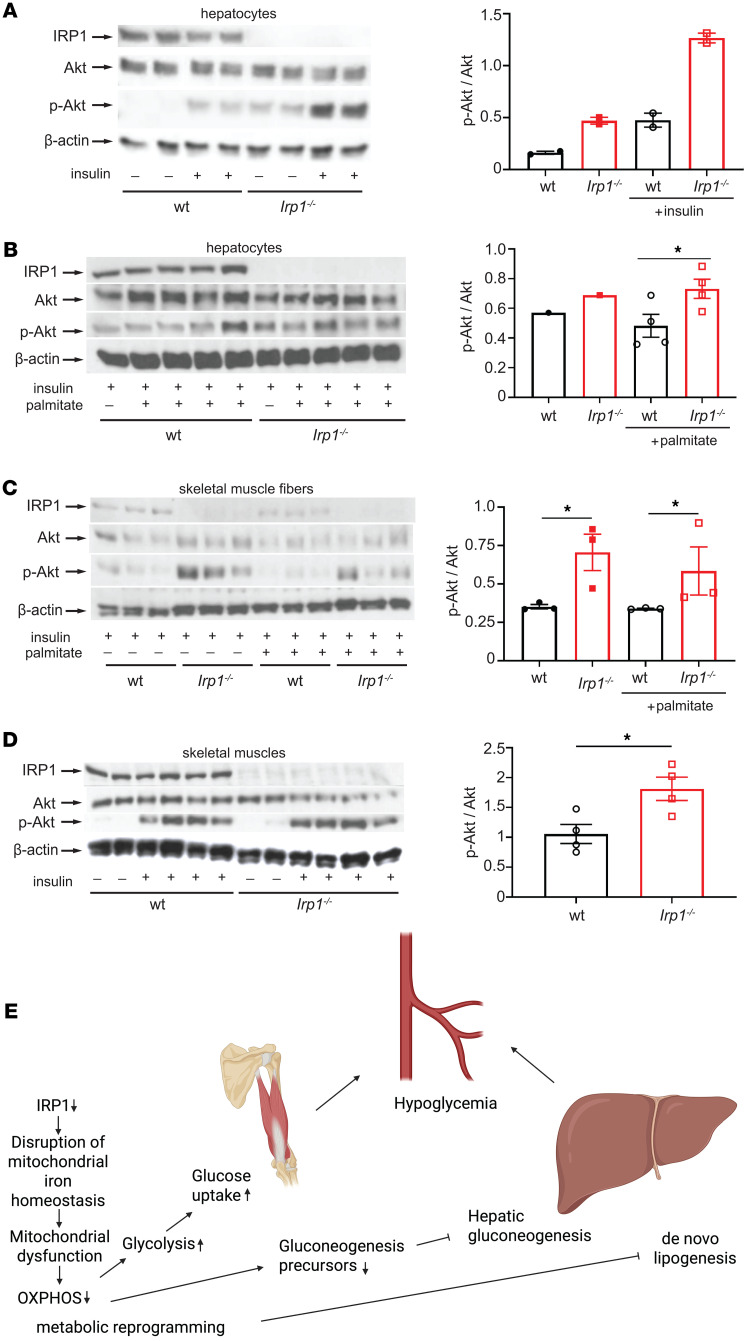 Figure 7
- —Canadian Institutes of Health Researchhttps://doi.org/10.13039/501100000024
Peer Reviews
No public reviews on file for this paper yet. If you reviewed it on a platform where reviews are public (OpenReview, ICLR, NeurIPS, ICML), you can paste yours below so the community can read it here.
Videos
No videos yet. Explain this paper in a talk, walkthrough, or lecture? Add one.
Taxonomy
TopicsIron Metabolism and Disorders · Cancer, Hypoxia, and Metabolism · Growth Hormone and Insulin-like Growth Factors
Introduction
Iron regulatory proteins IRP1 and IRP2 coordinately control the expression of mRNAs containing iron responsive elements (IREs). These include Tfrc, Fth/Ftl, and Slc40α1 mRNAs, which encode proteins of iron uptake (transferrin receptor 1), storage (ferritin), and efflux (ferroportin), respectively (1). In iron-starved cells, IRE/IRP interactions protect Tfrc mRNA against degradation and inhibit translation of Fth/Ftl and Slc40α1 mRNAs, in a homeostatic response to secure adequate iron supply. Conversely, in iron-replete cells, IRP1 is converted to cytosolic aconitase at the expense of its RNA-binding activity, while IRP2 undergoes proteasomal degradation. Inactivation of IRPs permits the decay of Tfrc mRNA and the de novo synthesis of ferritin and ferroportin to prevent detrimental iron overload.
IRP1 and IRP2 exhibit extensive sequence homology but only partial functional redundancy (2). Although global or tissue-specific disruption of both IRPs has yielded lethal phenotypes (3–5), single Irp1^–/–^ and Irp2^–/–^ mice are viable and have distinct pathophysiological features. Thus, Irp1^–/–^ mice develop polycythemia due to translational de-repression of the IRE-containing mRNA encoding HIF2α, which in turn stimulates erythropoiesis via transcriptional induction of erythropoietin in the kidney (6–8). On the other hand, Irp2^–/–^ mice manifest microcytic anemia, mild iron overload in the liver and duodenum, erythropoietic protoporphyria, diabetes, and late-onset neurodegeneration (9–11).
Herein, we show that Irp1^–/–^ mice are protected against hyperglycemia, insulin resistance, and liver steatosis. These are common clinical manifestations of metabolic syndrome, a pathological state defined by the combined presentation of at least 3 of the following conditions: abdominal obesity, hyperglycemia due to insulin resistance, dyslipidemia, and hypertension. Metabolic syndrome has a prevalence of approximately 25% in the adult US population and increases the risk for type 2 diabetes, cardiovascular and liver disease, and all-cause mortality (12). We demonstrate here that IRP1 deficiency causes mitochondrial dysfunction and metabolic rewiring that alters energy homeostasis. Our data unveil an unexpected role of IRP1 in the control of intermediary metabolism.
Results
Irp1–/– mice are protected against high fat diet–induced hyperglycemia.
Young Irp1^–/–^ mice develop erythrocytosis due to induction of the HIF2α/erythropoietin axis (6–8), and gradually recover after the age of 8–10 weeks, where HIF2α overexpression is mitigated (6). Prompted by evidence that HIF2α also controls insulin signaling in the liver via transcriptional induction of insulin receptor substrate 2 (IRS2) (13, 14), we analyzed metabolic functions in these animals. At the age of 5 weeks, Irp1^–/–^ mice exhibited profound fasting hypoglycemia (Figure 1A), while the phenotype of heterozygous Irp1^+/–^ animals was indistinguishable from WT controls (data not shown). Insulin tolerance testing (ITT) caused a sharper early drop in blood glucose levels of Irp1^–/–^ mice (Figure 1B), indicating increased insulin sensitivity. Moreover, Irp1^–/–^ mice could not initiate a gradual return of blood glucose levels to baseline within 45–60 minutes after an insulin injection; instead, they developed hypoglycemic seizures and had to be treated for recovery. In line with the severe fasting hypoglycemia, we observed 18% reduced survival of Irp1^–/–^ pups at the age of 4 weeks (Figure 1C), which was more pronounced in male (24%) versus female (11%) animals (Supplemental Figure 1A; supplemental material available online with this article; https://doi.org/10.1172/jci.insight.183247DS1). Notably, blood glucose levels were normalized in older Irp1^–/–^ mice (Figure 1D, control diet), but the age-dependent correction of hypoglycemia was abolished when animals were fed an iron-deficient diet (IDD) (Figure 1D). These data suggest that IRP1 deficiency has an impact on metabolism and are consistent with HIF2α involvement. However, while Irp1^–/–^ mice exhibited rapid glucose clearance in an oral glucose tolerance test (GTT), hepatocyte-specific ablation of HIF2α only partially corrected this phenotype in Irp1^–/–^ Hif2α^Alb-Cre^ mice (Figure 1E).
We then analyzed the responses of Irp1^–/–^ mice and WT littermates to a high-fat diet (HFD). Young (5–6 weeks old) male animals were fed an HFD or control diet for 10 weeks, and subsequently received a GTT. As expected, WT mice on an HFD developed hyperglycemia and glucose intolerance, whereas Irp1^–/–^ mice maintained physiological blood glucose levels and glucose clearance despite HFD feeding (Figure 1F). The observed metabolic differences were independent of serum insulin levels (Supplemental Figure 1B) or weight gain (Figure 1G), which were similar in HFD-fed WT and mutant animals. No significant differences in blood pressure were noted among the experimental groups (Supplemental Figure 1, C and D). We noted that the hypoglycemic phenotype persisted in both male and female young Irp1^–/–^ mice (data not shown). However, female Irp1^–/–^ mice appeared less protected than males against HFD-induced hyperglycemia (Supplemental Figure 1E). Thus, we focused on male animals for mechanistic studies.
Pyruvate tolerance testing revealed that Irp1^–/–^ mice exhibit a modest impairment in pyruvate-induced hepatic gluconeogenesis (Figure 1H). This was corroborated by decreased glucose levels in these animals after16 hours of fasting (Figure 1I), under conditions where glycogen stores are depleted and glucose supply largely depends on hepatic gluconeogenesis (15). Furthermore, Irp1^–/–^ mice on an HFD exhibited lower blood glucose levels after 4 and 6 hours of fasting compared with WT controls, indicating reduced hepatic glycogen storage (Figure 1I). This hypoglycemic phenotype was also recapitulated in a longitudinal experiment, in which Irp1^–/–^ mice and WT littermates were subjected to GTT at baseline and at 1 and 10 weeks after initiation of HFD intake. Unlike WT animals, which developed increased glucose intolerance with prolonged HFD feeding, the Irp1^–/–^ mice exhibited minimal defects in glucose clearance mostly after 1 week of HFD intake but not at the endpoint (10 weeks), suggesting metabolic adaptation and reprogramming (Figure 1J). To gain mechanistic insights, we analyzed hepatic expression of genes involved in gluconeogenesis (G6pc, Pck1, Fbp1) in WT and *Irp1^–/–^*mice fed a control diet or an HFD. G6pc (Figure 1K) and Pck1 (Figure 1L) were significantly upregulated in Irp1^–/–^ versus WT animals on the HFD, and a similar trend appeared for Fbp1 (Supplemental Figure 1F), despite the overall impaired gluconeogenic capacity. The expression of HIF2α-inducible Irs2 (but not Irs1) tended to be higher in Irp1^–/–^ mice on the HFD (Supplemental Figure 1G). This indicates potentially increased insulin sensitivity and is again consistent with a role of HIF2α. The induction of gluconeogenic genes despite increased insulin sensitivity suggests that Irp1^–/–^ mice are in an energy-deprived state.
Metabolic cage analysis of WT and Irp1^–/–^ mice on the HFD showed no significant differences among the genotypes on food or water intake, oxygen consumption, CO_2_ production, respiratory exchange rate, or heat, while Irp1^–/–^ mice tended to exhibit slightly increased movement activities (Supplemental Figure 2).
Irp1–/– mice are protected against HFD-induced liver steatosis.
After 10 weeks of HFD feeding, livers from WT mice became pale, indicative of steatosis; by contrast, livers from Irp1^–/–^ littermates retained their physiological color, suggesting protection against steatosis (Figure 2A). Histopathological analysis using H&E or Oil Red O staining confirmed that liver sections from Irp1^–/–^ mice had significantly reduced fat content, without large visible lipid droplets (Figure 2B), indicating that these animals were spared from HFD-induced hepatic steatosis.
The histological findings were corroborated by large-scale lipidomics profiling; the heatmap in Figure 2C reveals dramatic alterations in the liver lipidome of Irp1^–/–^ mice. Quantified liver lipidomics data are provided in Supplemental Data Set 2. A total of 100 lipid species were upregulated and 48 downregulated in the liver of Irp1^–/–^ versus WT mice (Figure 2, D and E). Upregulated lipids included phosphatidylethanolamine plasmalogens (PE-O_36:1 and PE-O_40:4), arachidonoyl-L-carnitine (carnitine_20:4), and phosphatidylcholine plasmalogens (PC-O_34:0 and PCO_31:0). Downregulated lipids included triacylglycerols (TG_58:0, TG_46:3, TG_48:3, and TG_46:2) and diacylglycerols (DG_32:1), which may indicate decreased hepatic lipogenesis in Irp1^–/–^ mice. Supporting evidence is provided by the significantly reduced expression of Srebp1 mRNA (Figure 2F) encoding a key transcriptional activator of de novo hepatic lipogenesis (16).
Consistent with these findings, HFD feeding increased liver weight and the hepatosomatic index (liver weight expressed as a percentage of total body weight) in WT mice only (Figure 2, G and H). In contrast, the hepatosomatic index decreased in HFD-fed Irp1^–/–^ animals. Periodic acid–Schiff (PAS) staining suggested that livers from Irp1^–/–^ mice on the HFD also had reduced glycogen content (Figure 2B), in line with the relative hypoglycemia that these animals developed after 4 and 6 hours of fasting (Figure 1I).
Serum biochemistry showed that an HFD increased total cholesterol in both WT and mutant mice (Supplemental Figure 3A), while triglyceride levels tended to be lower in Irp1^–/–^ mice independent of diet (Supplemental Figure 3B). Despite elevated HDL cholesterol in both genotypes after HFD intake (Supplemental Figure 3C), non-HDL cholesterol levels appeared lower in Irp1^–/–^ animals (Supplemental Figure 3D), and total cholesterol/HDL ratios were not affected (Supplemental Figure 3E). Values for serum iron, total iron-binding capacity (TIBC), transferrin saturation, and liver Hamp mRNA did not differ among all experimental groups (Supplemental Figure 3, F–I), whereas serum ferritin was elevated in Irp1^–/–^ mice (Supplemental Figure 3J), possibly due to translational de-repression under IRP1 deficiency. Complete blood count showed a normal red blood cell number and even reduced hematocrit in Irp1^–/–^ mice after the 10-week HFD feeding period (Supplemental Table 1), validating the correction of polycythemia with age (6). Along these lines, liver Epo mRNA and serum Epo levels were similar in all groups (Supplemental Figure 3, K and L). Nevertheless, splenomegaly persisted in the Irp1^–/–^ animals (Supplemental Figure 3, M–O), indicating extramedullary hematopoiesis. This was not associated with altered splenic iron content (Supplemental Figure 3P).
IRP1 deficiency causes mitochondrial dysfunction and a shift of energy metabolism from oxidative phosphorylation to glycolysis.
An unbiased proteomics approach was utilized to elucidate pathways by which IRP1 deficiency affects metabolic functions. To this end, liver samples from WT and Irp1^–/–^ mice on HFD (n = 4 from each group) were subjected to liquid chromatography–tandem mass spectrometry (LC-MS/MS) analysis. After filtering, 2,300 proteins on average were identified in each sample. Principal component analysis showed good separation between samples from the 2 genotypes (Supplemental Figure 4A), and Pearson correlation analysis showed that the replicates correlated well (Supplemental Figure 4B). Quantified liver proteomics data are provided in Supplemental Data Set 1. In Irp1^–/–^ versus WT livers, 101 proteins were upregulated and 82 downregulated (Figure 3, A and B). Upregulated proteins included S100a1, Slc4a1, and Blvra. Prominent downregulated proteins were Nduf3, Adcy5, Prdm16, and IRP1 (Aco1), which served as a control. Enrichment analysis with IPA software (QIAGEN) identified mitochondrial pathways (oxidative phosphorylation, electron transport, ATP synthesis) as most affected by IRP1 deficiency in the liver of HFD-fed mice (Figure 3C). The top hits in Gene Ontology (GO) hierarchy analysis were catalytic activity (GO Molecular Function), small molecule metabolic process (GO Biological Process), and cytoplasm and mitochondrion (GO Cellular Component); the top hits in Kyoto Encyclopedia of Genes and Genomes (KEGG) and Reactome pathway analysis were metabolic pathways and metabolism, respectively (Supplemental Figure 5). These data uncovered metabolic reprograming in the liver of Irp1^–/–^ mice that involved mitochondria. Mitochondrial dysfunction was also highlighted in STRING functional association networks (Figure 3D) and validated by Western blot analysis for electron transport chain complexes, showing reduced expression, especially of proteins representing complexes I and II, but also III and IV in the liver of Irp1^–/–^ mice (Figure 3E). This was not accompanied by any significant changes in expression of markers of mitochondrial biogenesis (Pgc1α mRNA), fission (Fis1 and Drp1 mRNAs), or fusion (Mfn1 and Mfn2 mRNAs) (17) (Supplemental Figure 6, A–E).
Diminished expression of electron transport chain complexes has previously been reported in Irp1^–/–^ murine embryonic fibroblasts (MEFs) (18). To assess functional implications, we analyzed mitochondrial oxygen consumption rates in Irp1^–/–^ MEFs with the Seahorse assay. IRP1 deficiency significantly impaired basal, ATP-linked, and maximal respiration, as well as spare capacity (Figure 4A and Supplemental Figure 7, A–D). This was associated with increased glycolytic activity and lactate production (Figure 4, B and C); both basal and compensatory glycolysis were induced (Supplemental Figure 7, E and F). Similar results were obtained with differentiated primary skeletal muscle myotubes from Irp1^–/–^ mice (Figure 4, D and E, and Supplemental Figure 7, G–L), which also exhibited defective mitochondrial respiration when palmitate was used as substrate (Figure 4F and Supplemental Figure 7, M–P). Along these lines, muscle fibers from Irp1^–/–^ mice had increased glucose uptake capacity (Figure 4G). IRP1 deficiency did not affect muscle stem cell differentiation to myotubes (Supplemental Figure 8A) but increased proliferation rates of myoblasts (Supplemental Figure 8B) and MEFs (Supplemental Figure 8C). In line with the liver proteomics data, primary hepatocytes from Irp1^–/–^ mice likewise exhibited impaired mitochondrial respiration (Figure 4H and Supplemental Figure 7, Q–T) and increased basal glycolysis (Figure 4I). The effects in hepatocytes appeared milder compared with MEFs and myotubes, and statistically significant differences among the genotypes were only noted for spare capacity (Supplemental Figure 7T) and basal (Figure 4I) but not compensatory glycolysis (not shown). Taken together, the above data suggest that IRP1 deficiency triggers mitochondrial dysfunction and a shift to aerobic glycolysis for energy production.
IRP1 deficiency alters mitochondrial redox speciation of iron in the liver and skeletal muscles.
In mouse (19) and rat (20) models of liver steatosis, HFD intake elicited a phenotype of low hepatic iron characterized by induction of transferrin receptor 1 (TfR1), the major iron uptake protein. In agreement with the earlier findings, we noted that WT mice on the HFD manifested increased TfR1 levels in the liver (Figure 5A). TfR1 expression was reduced, and ferritin was upregulated in the liver of Irp1^–/–^ versus WT mice on the control diet, presumably due to IRP1 deficiency. These responses were preserved after HFD feeding; however, a small number (2 out of 9) of the analyzed livers from Irp1^–/–^ animals exhibited high TfR1 and low ferritin levels (only 3 representative samples from each condition are shown in the Western blot).
On the other hand, HFD intake neither induced TfR1 nor suppressed ferritin in skeletal muscles of WT mice (Figure 5B), indicating relatively normal iron balance in this tissue. Ferritin was paradoxically suppressed in skeletal muscles of HFD-fed Irp1^–/–^ mice and TfR1 levels appeared slightly reduced, possibly due to IRP1 deficiency. These data suggest that iron homeostasis in the liver and skeletal muscles is controlled by distinct tissue-specific pathways in response to an HFD, with or without IRP1 deficiency.
To shed light on these pathways and dissect the role of IRP1, we profiled ferrous (Fe^2+^) and ferric (Fe^3+^) iron content in the cytosolic and mitochondrial fractions from the liver and skeletal muscles of WT and Irp1^–/–^ mice on an HFD, using cation exchange chromatography coupled with inductively coupled plasma mass spectrometry (SCX-ICP-MS). The Fe^2+^/Fe^3+^ ratio was calculated as an indicator of redox-active, labile iron pools. The purity of subcellular fractions was assessed by Western blotting for cytosolic IRP1 and mitochondrial Tom20 (Supplemental Figure 9, A and B).
Total (Fe^2+^ and Fe^3+^) iron levels were significantly higher in the liver cytosolic (~2.8-fold) and mitochondrial (~1.7-fold) fractions of Irp1^–/–^ mice compared with WT controls (Figure 5, C and D). Separate measurements of Fe^2+^ and Fe^3+^ are shown in Supplemental Figure 9, C and D. Although cytosolic Fe^2+^/Fe^3+^ ratios were similar between genotypes (Figure 5E), the mitochondrial Fe^2+^/Fe^3+^ ratio was elevated by approximately 6-fold in Irp1^–/–^ livers (Figure 5F), suggesting a relative accumulation of reduced, potentially unutilized, and redox-active Fe^2+^ in IRP1-deficient liver mitochondria.
In skeletal muscles, total cytosolic and mitochondrial iron (Figure 5, G and H), Fe^2+^ levels (Supplemental Figure 9E), Fe^3+^ (Supplemental Figure 9F) levels, and cytosolic Fe^2+^/Fe^3+^ ratios (Figure 5I) were comparable across genotypes. However, mitochondrial Fe^2+^/Fe^3+^ ratios were significantly decreased approximately 2.5-fold in Irp1^–/–^ skeletal muscles (Figure 5J), indicating a relative oxidation of the mitochondrial iron pool in the absence of IRP1. Collectively, these iron speciation data suggest that IRP1 deficiency impairs mitochondrial iron homeostasis in both the liver and skeletal muscles under metabolic stress induced by HFD, while cytosolic iron buffering remains unaffected.
Contrary to data previously reported in MEFs (18), IRP1 deficiency (or HFD intake) did not significantly affect expression of the Fe-S cluster biogenesis proteins frataxin and IscU in the liver and skeletal muscles (Supplemental Figure 9, G and H). Additionally, it did not affect expression of the mitochondrial iron transporter mitoferrin-1 (Mfrn1; Supplemental Figure 9, G and H). Notably, Irp1^–/–^ mice on an HFD had impaired mitochondrial aconitase activity in the heart (Supplemental Figure 9I). Considering that catalytic aconitase activity requires a 4Fe-4S cluster in the active site of the enzyme, these data suggest that HFD-induced metabolic stress causes functional inactivation of Fe-S clusters in IRP1-deficient mitochondria.
Our findings suggest that the metabolic phenotype of Irp1^–/–^ mice on an HFD may be linked to defective mitochondrial iron and redox homeostasis. Based on this, we hypothesized that dietary iron restriction might elicit metabolic responses in these animals analogous to those induced by HFD. Indeed, adult Irp1^–/–^ mice fed an IDD not only maintained fasting hypoglycemia (Figure 1D), but also exhibited improved glucose clearance (Figure 5K) and blunted gluconeogenesis (Figure 5L). Notably, injection with iron dextran did not affect glucose clearance in young (5 weeks old) WT mice but substantially impaired it in hypoglycemic Irp1^–/–^ littermates (Figure 5M), underlying the critical role of iron in glucose metabolism. These data demonstrate that dietary iron deficiency mimics effects of metabolic stress imposed by an HFD on glucose homeostasis in the absence of IRP1. Moreover, they support the notion that disruption of mitochondrial iron and redox balance may be a common underlying factor contributing to fasting hypoglycemia in young Irp1^–/–^ mice and to the metabolic responses of adult Irp1^–/–^ mice to both HFD and IDD.
Metabolic reprogramming in Irp1–/– mice.
Targeted metabolomics analysis in the serum, liver, and skeletal muscles was performed to uncover systemic metabolic alterations triggered by IRP1 deficiency after HFD or IDD intake. Normalized metabolomics data are provided in Supplemental Data Set 3. A total of 78 metabolites were detected in the serum, liver, and skeletal muscles of WT and Irp1^–/–^ mice on an HFD; a complete heatmap is shown in Supplemental Figure 10A. Under these conditions, Irp1^–/–^ mice exhibited lower levels of most serum and liver metabolites compared with WT controls (Figure 6A). We focused on changes in expression of specific metabolites such as glucogenic amino acids, ketogenic amino acids, gluconeogenesis precursors, fatty acids, and TCA cycle intermediates (Figure 6B). Among these, only aspartic acid was upregulated in serum, and citric and isocitric acid in the liver of Irp1^–/–^ mice. By contrast, skeletal muscles from Irp1^–/–^ mice on an HFD were enriched in glucogenic amino acids and TCA cycle intermediates, with the highest abundance of glutamine, proline, and 2-ketoglutarate; expression of ketogenic lysine was also high. Enrichment analysis identified the pathways most significantly affected by IRP1 deficiency and HFD: (a) tryptophan metabolism and starch and sucrose metabolism in serum (Supplemental Figure 10B); (b) glyoxylate and dicarboxylate metabolism, alanine aspartate and glutamate metabolism, TCA cycle, and unsaturated fatty acid biosynthesis in the liver (Supplemental Figure 10C); and (c) arginine and proline metabolism, pantothenate and CoA biosynthesis, and pyrimidine metabolism in skeletal muscles (Supplemental Figure 10D).
Under conditions of dietary iron restriction, the abundance of most analyzed metabolites was likewise lower in the serum and liver of Irp1^–/–^ versus WT mice (Figure 6, C and D, and Supplemental Figure 11A). Notably, IDD intake resulted in a dramatic shift of metabolites to the skeletal muscles of these animals. Thus, 67 out of 76 detected metabolites were upregulated in Irp1^–/–^ versus WT skeletal muscles, including glucogenic amino acids, gluconeogenesis precursors, fatty acids, and TCA cycle intermediates. Pathways most significantly affected by IRP1 and iron deficiency include the following: (a) lipoic acid metabolism; butanoate metabolism; and alanine, aspartate, and glutamate metabolism in serum (Supplemental Figure 11B); (b) starch and sucrose metabolism, as well as tryptophan metabolism in the liver (Supplemental Figure 11C); and (c) TCA cycle, glyoxylate and dicarboxylate metabolism, and biotin metabolism in skeletal muscles (Supplemental Figure 11D).
We also analyzed the impact of IRP1 deficiency under physiological conditions in mice fed the control diet. With few exceptions, metabolite levels were generally lower in Irp1^–/–^ versus WT mice across the serum, liver, and skeletal muscles (Supplemental Figure 12, A and B). Enrichment analysis identified the following pathways as most affected: (a) glyoxylate and dicarboxylate metabolism; alanine, aspartate, and glutamate metabolism; and glycolysis/gluconeogenesis in serum (Supplemental Figure 12C); (b) histidine, metabolism, propanoate metabolism, pyruvate metabolism, TCA cycle, and glyoxylate and dicarboxylate metabolism in the liver (Supplemental Figure 12D); and (c) glycerophospholipid, fructose and mannose metabolism, inositol metabolism, glycerolipid metabolism, and glycolysis/gluconeogenesis in skeletal muscles (Supplemental Figure 12E). These data reveal extensive metabolic reprogramming in response to IRP1 deficiency, which is reflected in serum, liver, and skeletal muscle metabolites. HFD or IDD intake triggers a shift of metabolites from the liver and serum to skeletal muscles of Irp1^–/–^ mice.
IRP1 deficiency improves insulin sensitivity in hepatocytes and skeletal muscle cells.
We explored whether the observed metabolic reprogramming in Irp1^–/–^ mice is associated with altered insulin signaling. To this end, primary hepatocytes from WT and Irp1^–/–^ mice remained untreated or treated with insulin, and downstream signaling was monitored by analyzing Akt phosphorylation as a surrogate marker (Figure 7A). We found p-Akt/Akt ratios were highly increased in insulin-treated Irp1^–/–^ hepatocytes compared with insulin-treated WT hepatocytes (Figure 7A). Moreover, p-Akt/Akt ratios remained higher in Irp1^–/–^ versus WT hepatocytes after treatment with palmitate, a fatty acid that causes insulin resistance (Figure 7B).
A similar experiment was performed with skeletal muscle fibers isolated from WT and Irp1^–/–^ mice (Figure 7C). We found p-Akt/Akt ratios were increased in insulin-treated Irp1^–/–^ versus WT muscle fibers and remained elevated after palmitate administration. To validate this finding in vivo, WT and Irp1^–/–^ mice on an HFD were injected with insulin or not, and skeletal muscle tissue was analyzed by Western blotting. Insulin injection stimulated Akt phosphorylation in both genotypes (Figure 7D). However, p-Akt/Akt ratios were significantly higher in Irp1^–/–^ versus WT skeletal muscles, again indicating increased insulin sensitivity. These data suggest that IRP1 deficiency increases insulin sensitivity and ameliorates fat-induced insulin resistance in the liver and skeletal muscles, in agreement with the metabolic phenotype of Irp1^–/–^ mice.
Discussion
Irp1^–/–^ mice were initially considered to lack any discernible pathology (21). Nevertheless, further studies revealed that these animals develop polycythemia and pulmonary hypertension due to aberrant HIF2α-dependent transcriptional induction of erythropoietin in renal interstitial fibroblasts and hepatocytes, and of endothelin 1 in pulmonary endothelial cells, respectively (6–8). The mechanism involves translational de-repression of the IRE-containing HIF2α mRNA due to IRP1 deficiency. HIF2α and its homologue HIF1α are sensitive to oxygen- and iron-dependent posttranslational modification by prolyl-hydroxylases (PHD1, PHD2, or PHD3), which leads to their proteasomal degradation via the von Hippel-Lindau (VHL) E3 ubiquitin ligase complex (22). Modest HIF2α stabilization in the mouse liver (by acute deletion of Phd3) has been associated with improved insulin sensitivity and relative protection against type 2 diabetes following induction of Irs2, another HIF2α target gene (13, 14). Notably, in patients with Chuvash polycythemia, a condition characterized by VHL mutation that impairs HIF2α and HIF1α degradation, polycythemia correlates with low glycemia (23). Moreover, increased erythropoietic activity has been linked to low glycemia in the context of myeloproliferative neoplasms, hypoxia, or erythropoietin therapy (24, 25).
Consistent with these data, we observed that Irp1^–/–^ mice exhibit more pronounced insulin responsiveness and glucose clearance compared with WT littermates, even after HFD feeding (Figure 1). These responses were likewise associated with a trend for Irs2 induction in the liver, arguing for potential HIF2α involvement. This is further supported by the partial correction of rapid glucose disposal in Irp1^–/–^ mice with hepatocyte-specific ablation of HIF2α versus Irp1^–/–^ mice with intact HIF2α (Figure 1E). A modest HIF2α induction due to IRP1 deficiency could also contribute to suppressed Srebp1-induced lipogenesis and protection of Irp1^–/–^ mice against liver steatosis (14) (Figure 2). Another argument supporting a role of HIF2α is provided by the correction of fasting hypoglycemia in older Irp1^–/–^ mice, similar to polycythemia (6), and by the abrogation of this effect under HIF2α-stabilizing (26) dietary iron restriction (Figure 1D and Figure 5K). However, expression of gluconeogenic genes was not suppressed in Irp1^–/–^ mice (Figure 1, K and L, and Supplemental Figure 1F), despite increased insulin sensitivity. This finding also contrasts with data in mouse models of modest or more severe hepatocyte-specific HIF2α stabilization due to acute ablation of Phd3 (13, 14) or constitutive ablation of Vhl (27), respectively. Both approaches led to inhibition of gluconeogenic gene expression via either stimulation of insulin signaling (13, 14) or repression of glucagon signaling (27). Moreover, constitutive HIF2α upregulation in Vhl-deficient hepatocytes is known to cause severe steatosis in adult mice on a standard chow diet (28), while Irp1^–/–^ mice were protected against liver steatosis even after HFD feeding (Figure 2).
Our initial data suggested a more complex phenotype for Irp1^–/–^ mice that cannot be fully explained by molecular responses of modest HIF2α upregulation in hepatocytes, and may also be linked to energy deprivation and involve other tissues. In fact, hypoglycemia of Irp1^–/–^ mice on a standard diet was severe and only comparable to models of hepatic HIF2α overexpression above a favorable metabolic threshold (14). We speculate that this accounts for the 18% lower survival rate that we noted for these animals at the age of 4 weeks. Embryonic lethality has been reported for mice with a βgeo gene trap construct inserted into the Irp1 locus but not for Irp1^–/–^ mice (29). The differences may be related to the genetic background of the animals, dietary factors, and possibly also the approximately 4.5 times lower number of mice genotyped in the previous study (29).
The liver proteomics analysis (Figure 3) provided further hints for altered energy metabolism in Irp1^–/–^ mice. It uncovered potential mitochondrial dysfunction and changes in expression of proteins involved in oxidative phosphorylation and energy metabolism. We corroborated these data by Western blot analysis of respiratory chain proteins (Figure 3E) and by assessment of mitochondrial respiration in MEFs, primary hepatocytes, and differentiated myotubes from Irp1^–/–^ mice (Figure 4 and Supplemental Figure 7). All these cell types manifested defective mitochondrial respiration and a switch to aerobic glycolysis for energy metabolism, also known as the Warburg effect in cancer cells (30), which was accompanied by increased proliferation rates of MEFs and myoblasts (Supplemental Figure 8, B and C). The phenotype was more pronounced in MEFs and differentiated myotubes. Skeletal muscle fibers from Irp1^–/–^ mice exhibited increased glucose uptake, consistent with the high need for nutrients for energy production via less efficient aerobic glycolysis (30). Importantly, differentiated myotubes displayed aberrant oxygen consumption with palmitate as substrate, indicating defective β-oxidation (Figure 4F), which correlated with relative protection against insulin resistance (Figure 7C). These data support the conclusion from an earlier study that “dietary fat is less damaging to skeletal muscle metabolic function under conditions of constrained β-oxidation” (31).
We provide evidence that mitochondrial dysfunction is caused by disruption of iron redox balance in this organelle due to lack of IRP1 (Figure 5). Our findings offer an additional link between iron and intermediary metabolism (32). HFD feeding has been associated with responses to iron starvation in the liver, such as upregulation of TfR1 expression (19), possibly via IRP1 (20). These data are largely validated in Figure 5A. Even though we did not directly compare changes in mitochondrial iron content in response to an HFD, we speculate that increased supply of metabolically active iron to mitochondria is needed to cope with the metabolic stress imposed by long-term exposure to an HFD. Another limitation of our study is that we did not validate the mitochondrial dysfunction data from primary cell cultures using isolated tissue mitochondria. Conversely, we did not validate the iron speciation data from tissues using primary cell cultures.
The critical role of iron is also underlined by the observations that dietary iron restriction maintained hypoglycemia (Figure 1D), efficient glucose clearance (Figure 5K), and poor gluconeogenesis (Figure 5L) in Irp1^–/–^ mice, and the glucose phenotype was partially reversed by iron dextran injection (Figure 5M). These findings are in line with previous studies showing that iron deficiency causes mitochondrial dysfunction and uncoupling of oxidative phosphorylation in the liver (33), impairs the gluconeogenic capacity of isolated hepatocytes (34), enhances glucose catabolism in skeletal muscles (35), and increases peripheral insulin responsiveness (36, 37). Moreover, they are consistent with the protective effects of iron deficiency and mitochondrial dysfunction against insulin resistance caused by an HFD in rats (38).
Our data suggest that not only iron content but also iron redox balance is critical for mitochondrial function. Notably, the loss of IRP1, a cytosolic protein, disrupted iron redox balance in mitochondria but not in the cytosol (Figure 5). In liver mitochondria, Irp1^–/–^ mice exhibited an increase in the Fe^2+^/Fe^3+^ ratio, primarily driven by elevated Fe^2+^ concentrations (Figure 5F and Supplemental Figure 9, C and D). Excess Fe^2+^ may represent a metabolically inert iron pool that fails to enter bioenergetic pathways, potentially increasing redox vulnerability. In contrast, in skeletal muscle mitochondria from Irp1^–/–^ mice, the Fe^2+^/Fe^3+^ ratio was lower due to decreased Fe^2+^ and elevated Fe^3+^ levels (Figure 5J and Supplemental Figure 9, E and F), pointing to oxidative sequestration and reduced availability of metabolically active Fe^2+^. In both cases, redox imbalance of iron causes mitochondrial dysfunction.
Our data highlight the important role of IRP1 in mitochondrial iron metabolism, especially under stress, and corroborate previous findings in diverse settings. For instance, Fxn^Alb-Cre^ mice with hepatocyte-specific frataxin disruption exhibited mitochondrial dysfunction that was exacerbated upon crossing with Irp1^–/–^ mice due to defective mitochondrial iron import (39). In another example, targeted hepatocyte-specific ablation of both IRP1 and IRP2 caused liver failure and death in mice due to mitochondrial iron deficiency and dysfunction (5); these data also imply a contribution of IRP2. Indeed, MEFs from either Irp1^–/–^ or Irp2^–/–^ mice had compromised mitochondrial Fe-S cluster biogenesis due to repressed frataxin and IscU expression (18), while IRP2 deficiency triggered a switch from oxidative phosphorylation to aerobic glycolysis in MEFs (40). Along these lines, proteomics analysis revealed reduced expression of several mitochondrial electron transport chain proteins in bone marrow–derived macrophages lacking both IRP1 and IRP2 (41). However, contrary to the metabolic phenotype of Irp1^–/–^ mice reported herein, Irp2^–/–^ animals exhibit glucose intolerance and develop diabetes (11). Thus, the systemic metabolic functions of IRP1 and IRP2 are distinct. Dissecting the mechanism by which IRP1 modulates mitochondrial iron metabolism awaits further investigation. We speculate that this may involve posttranscriptional regulation of known and/or yet unidentified downstream mRNA targets. Alternatively, IRP1 may control mitochondrial iron traffic via protein-protein interactions; a recent study identified IRP1 as an interacting partner of MEMO1, a protein linked to mitochondrial iron supply (42).
Our metabolomics analysis uncovered extensive metabolic reprogramming in the liver and skeletal muscles of Irp1^–/–^ mice, presumably due to mitochondrial dysfunction and inefficient energy production. These responses were exacerbated under conditions of high energetic needs following metabolic stress (HFD) or dietary iron restriction (Figure 6 and Supplemental Figures 10 and 11), and are reminiscent of metabolic changes reported in Tfr1^mu/mu^ mice bearing skeletal muscle–specific disruption of TfR1 (43). In this animal model, TfR1 deficiency in skeletal muscles caused severe iron deficiency, incapacitating mitochondrial energy production that led to growth arrest and a muted attempt to switch to fatty acid β-oxidation, consuming fat stores. Even though hepatic gluconeogenesis was stimulated, amino acid substrates became limiting, and lethal hypoglycemia developed shortly after birth.
In Irp1^–/–^ mice on an IDD or HFD, amino acid substrates likewise became limiting for gluconeogenesis, which might also have been impaired by energy deprivation. Paradoxically, insulin signaling was stimulated in these animals rather than suppressed (Figure 7). This very likely contributed to IDD-induced hypoglycemia or protection against HFD-induced hyperglycemia, and increased glucose disposal by skeletal muscles. The protection against HFD-induced hyperglycemia was more prominent in male mice (Figure 1F and Supplemental Figure 1E). The molecular basis for the apparent sexual dimorphism is not clear and will be addressed in follow-up studies.
On a final note, while Irp1^–/–^ mice were initially considered to lack any apparent phenotype (21), we and others demonstrated that these animals develop polycythemia due to translational de-repression of renal HIF2α mRNA and subsequent transcriptional induction of its downstream target erythropoietin (6–8). The physiological relevance of our findings was subsequently validated by a meta-analysis of genome-wide association studies involving 684,122 individuals from Iceland and the United Kingdom, which identified the IRP1-encoding ACO1 gene as a major homeostatic regulator of hemoglobin concentration (44). We expect that the metabolic phenotype of Irp1^–/–^ mice reported herein will spark analogous validation studies.
In conclusion, our data uncover a potentially novel function of IRP1 as a metabolic switch (Figure 7E) and provide evidence that this involves its iron regulatory activity. Moreover, our data suggest that targeting IRP1 may offer therapeutic benefits against hyperglycemia, insulin resistance, and metabolic dysfunction–associated steatotic liver disease, the hepatic manifestation of metabolic syndrome (45).
Methods
Sex as a biological variable.
Early experiments were performed using both male and female mice. Because the metabolic phenotypes of IRP1 deficiency were stronger in males, only male animals were used for subsequent mechanistic studies.
Animals.
Irp1^–/–^ mice on C57BL/6 background (29) were provided by M.W. Hentze (European Molecular Biology Laboratory). Irp1^+/–^ mice were generated by breeding Irp1^–/–^ with congenic Irp1^+/+^ (WT) mice. Breeding pairs from these animals were used to generate Irp1^+/+^ (WT) and Irp1^–/–^ littermates that were used throughout this study. Irp1^–/–^Hif2α^Alb-Cre^ and Hif2α^Alb-Cre^ mice were as previously described (6). All animals were housed in Makrolon cages (up to 5 mice per cage, 12-hour light/12-hour dark cycle: 7:00 am to 7:00 pm; 22°C ± 1°C, 60% ± 5% humidity) according to institutional guidelines. Where indicated, the mice were fed an HFD (43% fat; ssniff Spezialdiäten GmbH, S9552-E034) or its equivalent control diet (12% fat; ssniff Spezialdiäten GmbH, S9552-E033). In other experiments, the mice were fed an IDD (TD.80396 [Envigo/Inotiv] containing 2–6 ppm iron) or its equivalent control diet (TD.89173, [Envigo/Inotiv] 18% protein, 2918 containing 200 ppm iron).
Cell culture.
MEFs were obtained from WT and Irp1^–/–^ mouse embryos according to standard procedures. Briefly, embryos were excised from the uterus at 10–12 days of gestation. The head, appendages, and organs were removed from the embryo. Embryos were minced in PBS and added to a 50 mL centrifuge tube with 0.1% collagenase (MilliporeSigma) solution in DMEM (Invitrogen). The cells were filtered through a silk filter, spun at 300g for 10 minutes, resuspended in culture media and plated on a 10 cm dish in a CO_2_ incubator at 37°C. The cells were cultured in DMEM supplemented with 10% heat-inactivated FBS (Wisent), nonessential amino acids, 100 U/mL penicillin, and 100 μg/mL streptomycin, and immortalized using a pBABE-neo large T antigen cDNA (Addgene plasmid 1780). Primary hepatocytes were prepared from adult mice using a 2-step collagenase perfusion technique and cultured as described (46). Primary myoblasts were prepared from 4- to 6-week-old mice as described (47). Differentiation to myotubes was in DMEM supplemented with 5% horse serum for 5 days. Muscle fibers were isolated from soleus muscle (48) and cultured in DMEM supplemented with 10% FBS and antibiotics.
Glucose, pyruvate, and insulin tolerance tests.
Irp1^–/–^ mice and WT littermates were fasted for 4–16 hours before the experiments. The animals were intraperitoneally injected with 1 g/kg glucose for the GTT, 2 g/kg sodium pyruvate for the pyruvate tolerance test, or 0.5 U/kg insulin (Humulin, DIN 00586714) for the insulin tolerance test. For oral GTT, the mice were given 2 g/kg glucose by oral gavage. Where indicated, mice were intraperitoneally injected with iron dextran (Sigma-Aldrich) at 15 mg/kg, 3 times with 2-hour intervals; the last injection was performed 24 hours before the GTT. Blood glucose levels were measured at 0, 15, 30, 60, and 120 minutes using the OneTouch Verio Flex blood glucose meter.
Glucose uptake assay.
Isolated muscle fibers were starved in glucose-deficient DMEM for 45 minutes before the assay. Subsequently, the media were replaced with DMEM containing 4.5 g/L glucose and supplemented with 1% FBS and antibiotics, and the muscle fibers were incubated for 6 hours. Culture supernatants (100 μL) were collected at 0, 3, and 6 hours, and glucose was measured by using glucose oxidase liquid reagents (Pointe Scientific, G7521120). Glucose uptake was calculated as the difference of glucose amount collected at the zero time point and the specific time points. Data were normalized to total protein.
Seahorse experiments.
Mitochondrial respiration and glycolysis were analyzed in MEFs, primary hepatocytes, or differentiated myotubes by the Seahorse assay (49). Details are provided in the Supplemental Methods.
Lactate assay.
Cells were cultured in DMEM supplemented with 1% fetal FBS and antibiotics (100 U/mL penicillin, 100 μg/mL streptomycin). Old media were replaced with fresh, and aliquots (100 μL) were collected at 3, 6, and 24 hours. Lactate was measured using a lactate oxidase reagent kit (Pointe Scientific, L7596-50). Data were normalized to total protein.
Isolation of cytosolic and mitochondrial fractions.
Liver and skeletal muscles from Irp1^–/–^ mice and WT littermates were processed to separate mitochondrial and cytosolic fractions by using a mitochondria isolation kit (Thermo Fisher Scientific, 89801).
Iron redox speciation analysis.
For redox speciation analysis of Fe^2+^ and Fe^3+^, the method outlined previously (50) was significantly modified to reduce the overall analysis time (including analysis and column cleaning) and to optimize detection for inductively coupled plasma kinetic energy discrimination mass spectrometry. Details are provided in the Supplemental Methods.
Quantitative real-time reverse-transcription PCR.
Total RNA was extracted from tissues by using the RNeasy kit (QIAGEN). Purity was assessed by 260/280 nm absorbance ratios, and quality was monitored by agarose gel electrophoresis. cDNA was synthesized from 1 μg RNA by using the OneScript Plus cDNA Synthesis Kit (Applied Biological Materials). Quantitative real-time reverse-transcription PCR was performed in a 7500 Fast Real Time PCR System (Applied Biosystems) with gene-specific primers provided in the Reagents and Resources section of the supplemental materials. Primer pairs were validated by dissociation curve analysis and demonstrated amplification efficiency between 90% and 110%. SYBR Green (Bioline) and primers were used to amplify products under the following cycling conditions: initial denaturation 95°C for 10 minutes, 40 cycles of 95°C for 5 seconds, 58°C for 30 seconds, 72°C for 10 seconds, and the final cycle melt analysis between 58°C and 95°C. Relative mRNA expression was calculated by the 2^–ΔΔCt^ method (51). Data were normalized to murine ribosomal protein L19 (Rpl19).
Western blotting.
Western blot analysis was performed as described earlier (52). Antibodies and dilutions are provided in the Reagents and Resources section of the supplemental materials. Immunoreactive bands were quantified by densitometry with ImageJ (NIH) software.
Histology.
Liver specimens from 3 mice per experimental group were fixed in 10% buffered formalin and embedded in paraffin. Samples were cut at 4 μm, placed on SuperFrost/Plus slides (Thermo Fisher Scientific), and dried overnight at 37°C. De-paraffinized slides were used for H&E or PAS staining.
Lipidomics, proteomics, metabolomics studies, and other assays.
The experimental outline and details are provided in the Supplemental Methods.
Statistics.
Quantitative data are expressed as mean ± SEM. Statistical analysis was performed using GraphPad Prism (v10.6.1). Multiple groups were analyzed by 2-way ANOVA except for 1E, which was 1-way, with Tukey’s post hoc comparisons test. Comparisons between 2 independent groups were done with an unpaired 2-tailed Student’s t test. A P value of less than 0.05 was considered statistically significant.
Study approval.
All experimental procedures were approved by the IACUC of McGill University (protocol 4966).
Data availability.
The mass spectrometry proteomics data have been deposited to the ProteomeXchange Consortium via the PRIDE partner repository (dataset identifier PXD051897). The lipidomics raw data have been deposited to the MassIVE repository (project accession MassIVE MSV000100449). The metabolomics raw data have been deposited to Mendeley Data (https://data.mendeley.com/datasets/tjwvzfk4wg/2). Quantified liver proteomics and lipidomics data and normalized metabolomics data are provided in supplemental spreadsheets. The Supporting Data Values file is also provided.
Author contributions
WG contributed to the investigation, formal analysis, methodology, and writing of the original draft. NW and TZ contributed to the investigation. CF was responsible for formal analysis, methodology, and project administration. AK, BJ, BM, CHB, DMB, HZ, JS, KS, VDS, and VV were responsible for methodology. EB and VR contributed to methodology and formal analysis. ZL contributed to the formal analysis. OI was responsible for methodology and conceptualization. GS contributed to the methodology, resources, and conceptualization. KP was responsible for conceptualization, supervision, funding acquisition, and review and editing of the manuscript.
Funding support
Canadian Institutes of Health Research (PJT-186193).Deutsche Forschungsgemeinschaft (VE 1249/1-1) to BM and VV.
Supplementary Material
Supplemental data
Supplemental data set 1
Supplemental data set 2
Supplemental data set 3
Unedited blot and gel images
Supporting data values
The reference list from the paper itself. Each links out to its DOI / PubMed record.
- 1Galy B et al Mechanisms controlling cellular and systemic iron homeostasis Nat Rev Mol Cell Biol 202425213315510.1038/s 41580-023-00648-137783783 · doi ↗ · pubmed ↗
- 2Wilkinson N Pantopoulos K The IRP/IRE system in vivo: insights from mouse models Front Pharmacol 2014517610.3389/fphar.2014.0017625120486 PMC 4112806 · doi ↗ · pubmed ↗
- 3Smith SR et al Complete loss of iron regulatory proteins 1 and 2 prevents viability of murine zygotes beyond the blastocyst stage of embryonic development Blood Cells Mol Dis 200636228328710.1016/j.bcmd.2005.12.00616480904 · doi ↗ · pubmed ↗
- 4Galy B et al Iron regulatory proteins are essential for intestinal function and control key iron absorption molecules in the duodenum Cell Metab 200871798510.1016/j.cmet.2007.10.00618177727 · doi ↗ · pubmed ↗
- 5Galy B et al Iron regulatory proteins secure mitochondrial iron sufficiency and function Cell Metab 201012219420110.1016/j.cmet.2010.06.00720674864 · doi ↗ · pubmed ↗
- 6Wilkinson N Pantopoulos K IRP 1 regulates erythropoiesis and systemic iron homeostasis by controlling HIF 2α m RNA translation Blood 201312291658166810.1182/blood-2013-03-49245423777768 · doi ↗ · pubmed ↗
- 7Anderson SA et al The IRP 1-HIF-2α axis coordinates iron and oxygen sensing with erythropoiesis and iron absorption Cell Metab 201317228229010.1016/j.cmet.2013.01.00723395174 PMC 3612289 · doi ↗ · pubmed ↗
- 8Ghosh MC et al Deletion of iron regulatory protein 1 causes polycythemia and pulmonary hypertension in mice through translational derepression of HIF 2αCell Metab 201317227128110.1016/j.cmet.2012.12.01623395173 PMC 3569856 · doi ↗ · pubmed ↗