Cleaning and pre-processing of actigraphy data for physical activity and sleep research: a scoping review
S G Gonsalves, J J Zhao, A A Livinski, M Steele, A Ross, T Fuss, K Clevenger, L N Saligan

TL;DR
This paper reviews how actigraphy data is cleaned and processed for sleep and activity research, finding inconsistent methods that need standardization.
Contribution
The paper is the first to systematically differentiate and quantify actigraphy data cleaning practices across devices and methods.
Findings
There is substantial heterogeneity in actigraphy data cleaning and pre-processing methods.
Many studies use custom or insufficiently detailed algorithms, limiting replication and comparison.
Standardized protocols are urgently needed to improve consistency in actigraphy research.
Abstract
Objective. Numerous studies examine the link between health and sleep-wake patterns to understand etiology, establish preventive algorithms, or develop therapeutics. The use of actigraphy to measure physical activity (PA) and sleep is increasing, partly because of its non-invasive nature and its ability to continuously monitor PA and sleep in free-living settings. There are several actigraphy data cleaning and pre-processing methods, but there is no consensus on how to define PA metrics or standardized cleaning procedures to enable comparison across research studies. This scoping review examined existing literature on cleaning and pre-processing of actigraphy data. Approach. The PubMed (US National Library of Medicine), Scopus (Elsevier), and Web of Science: Core Collection (Clarivate Analytics) databases were searched for original studies published in English from 2017–2024. Using…
Genes, proteins, chemicals, diseases, species, mutations and cell lines named across the full text — each resolved to its canonical identifier and authoritative record.
Click any figure to enlarge with its caption.
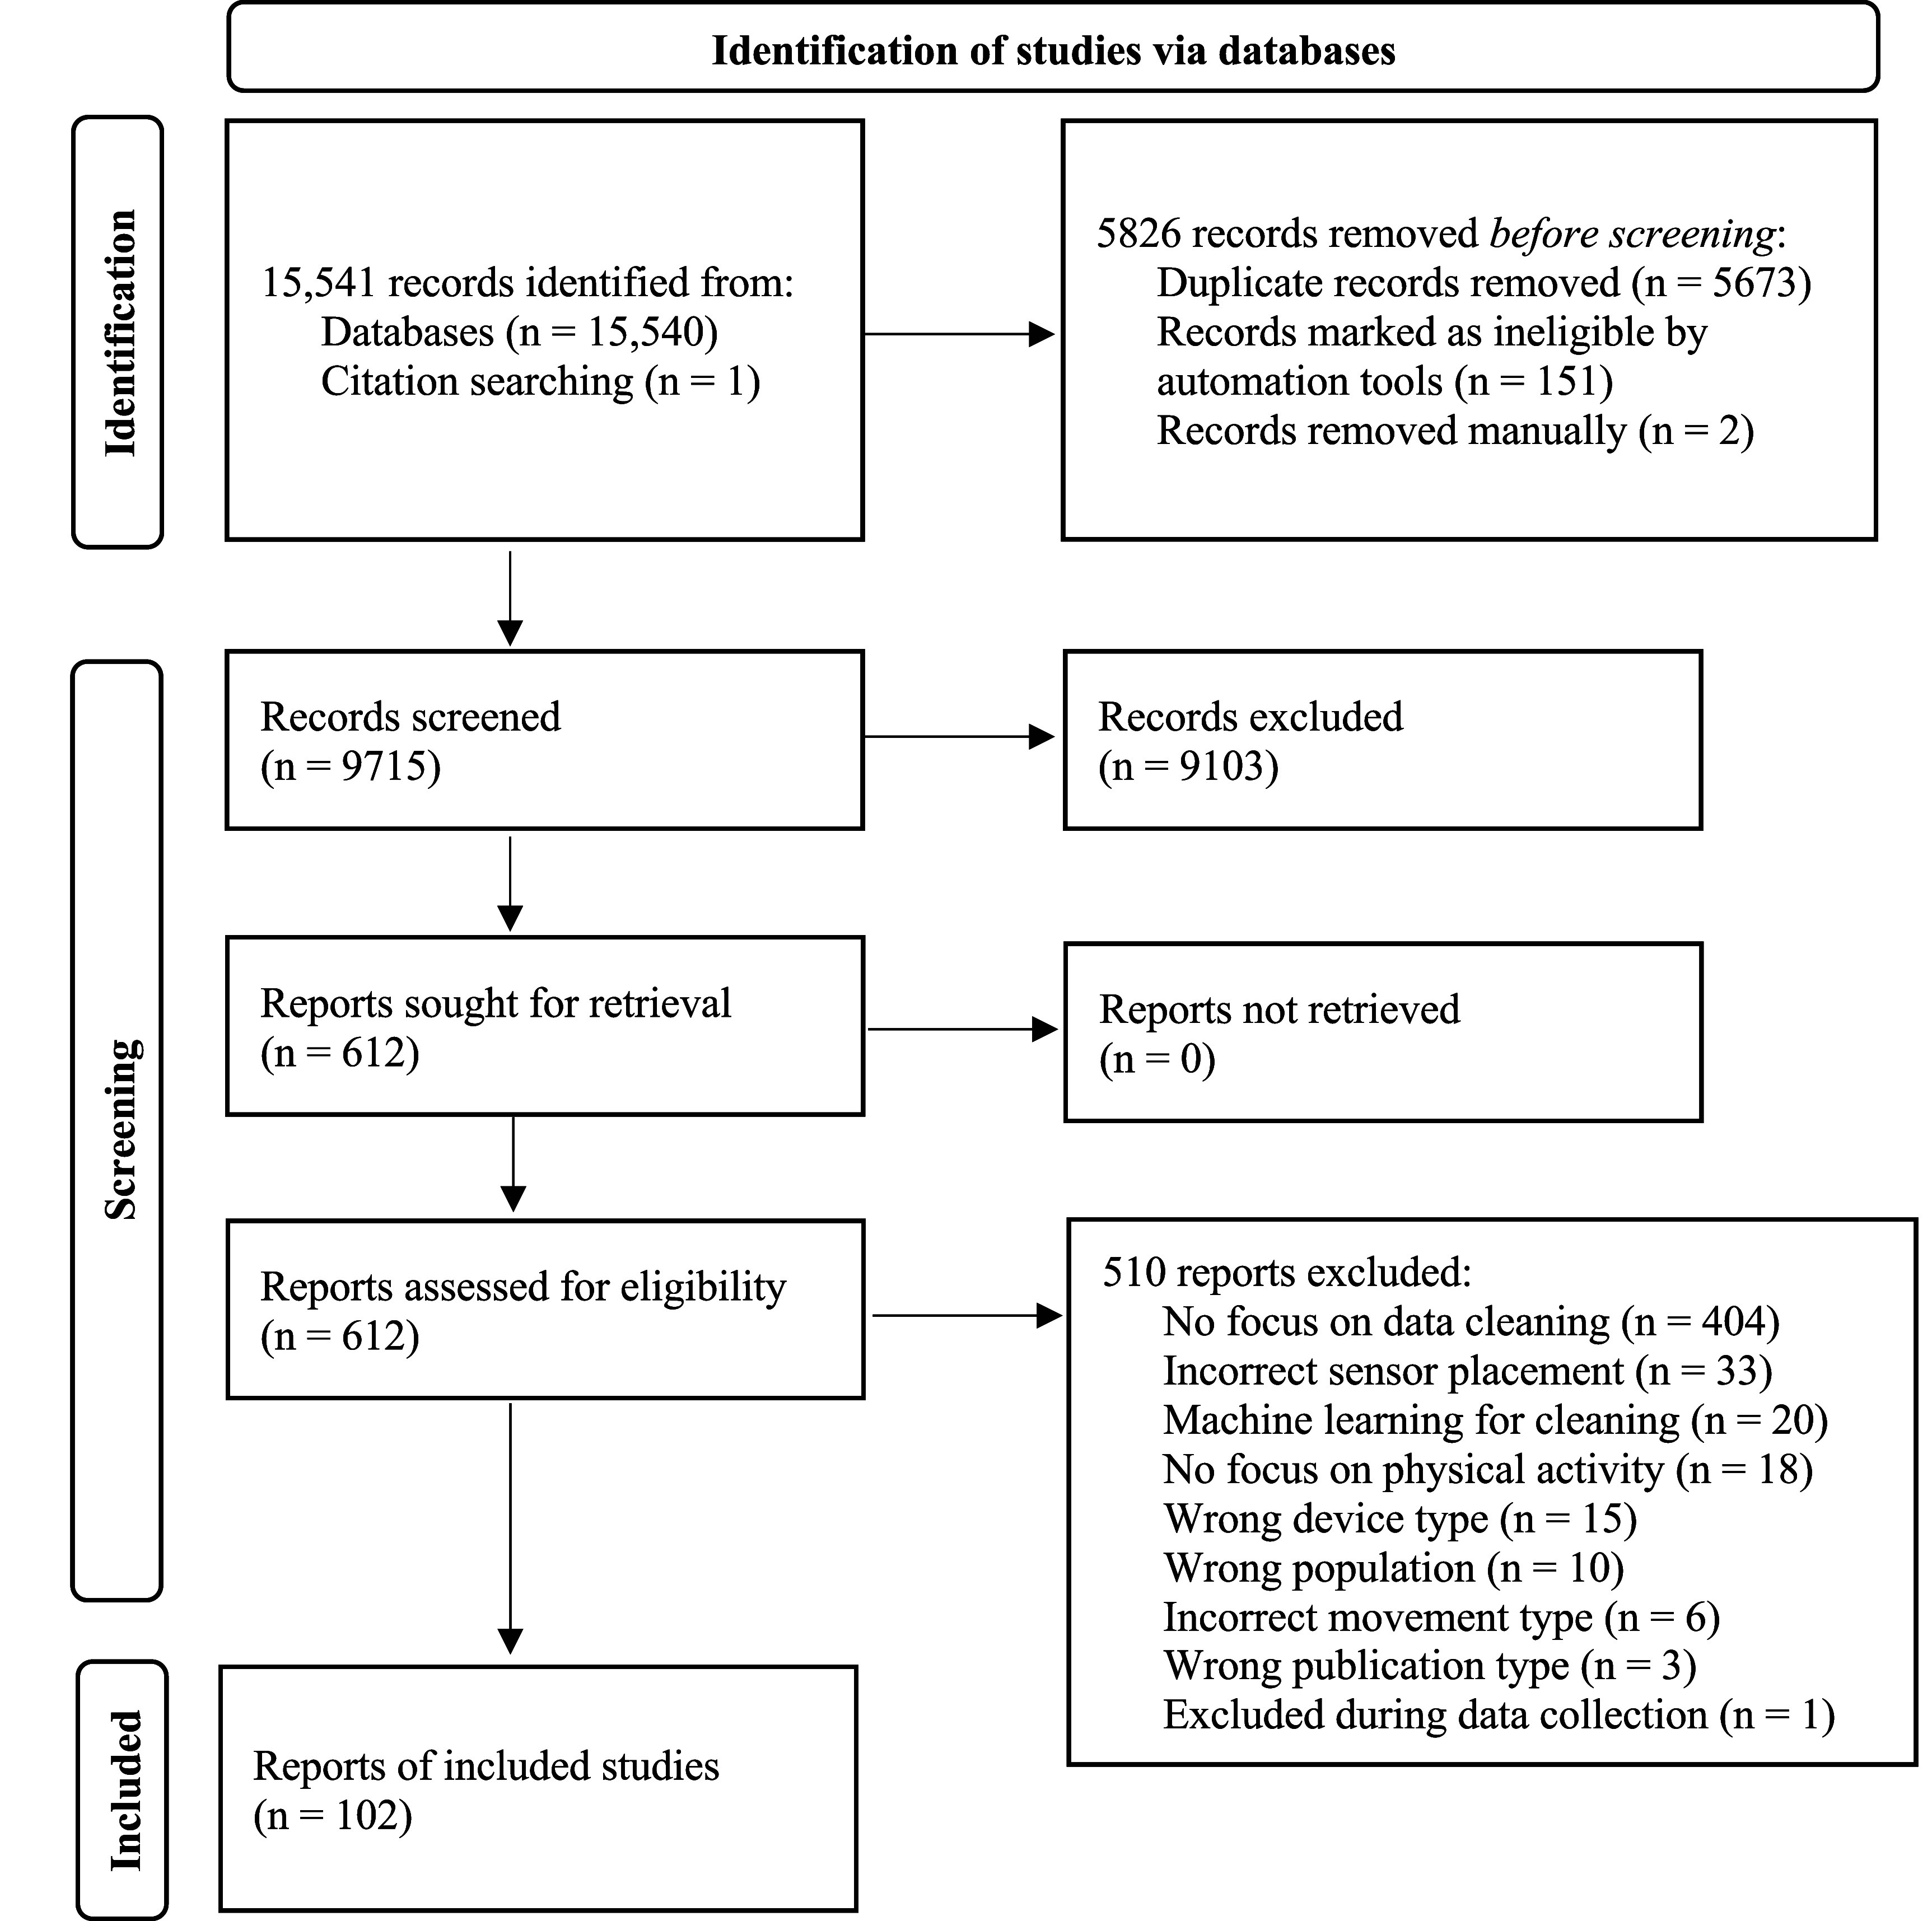 Figure 1
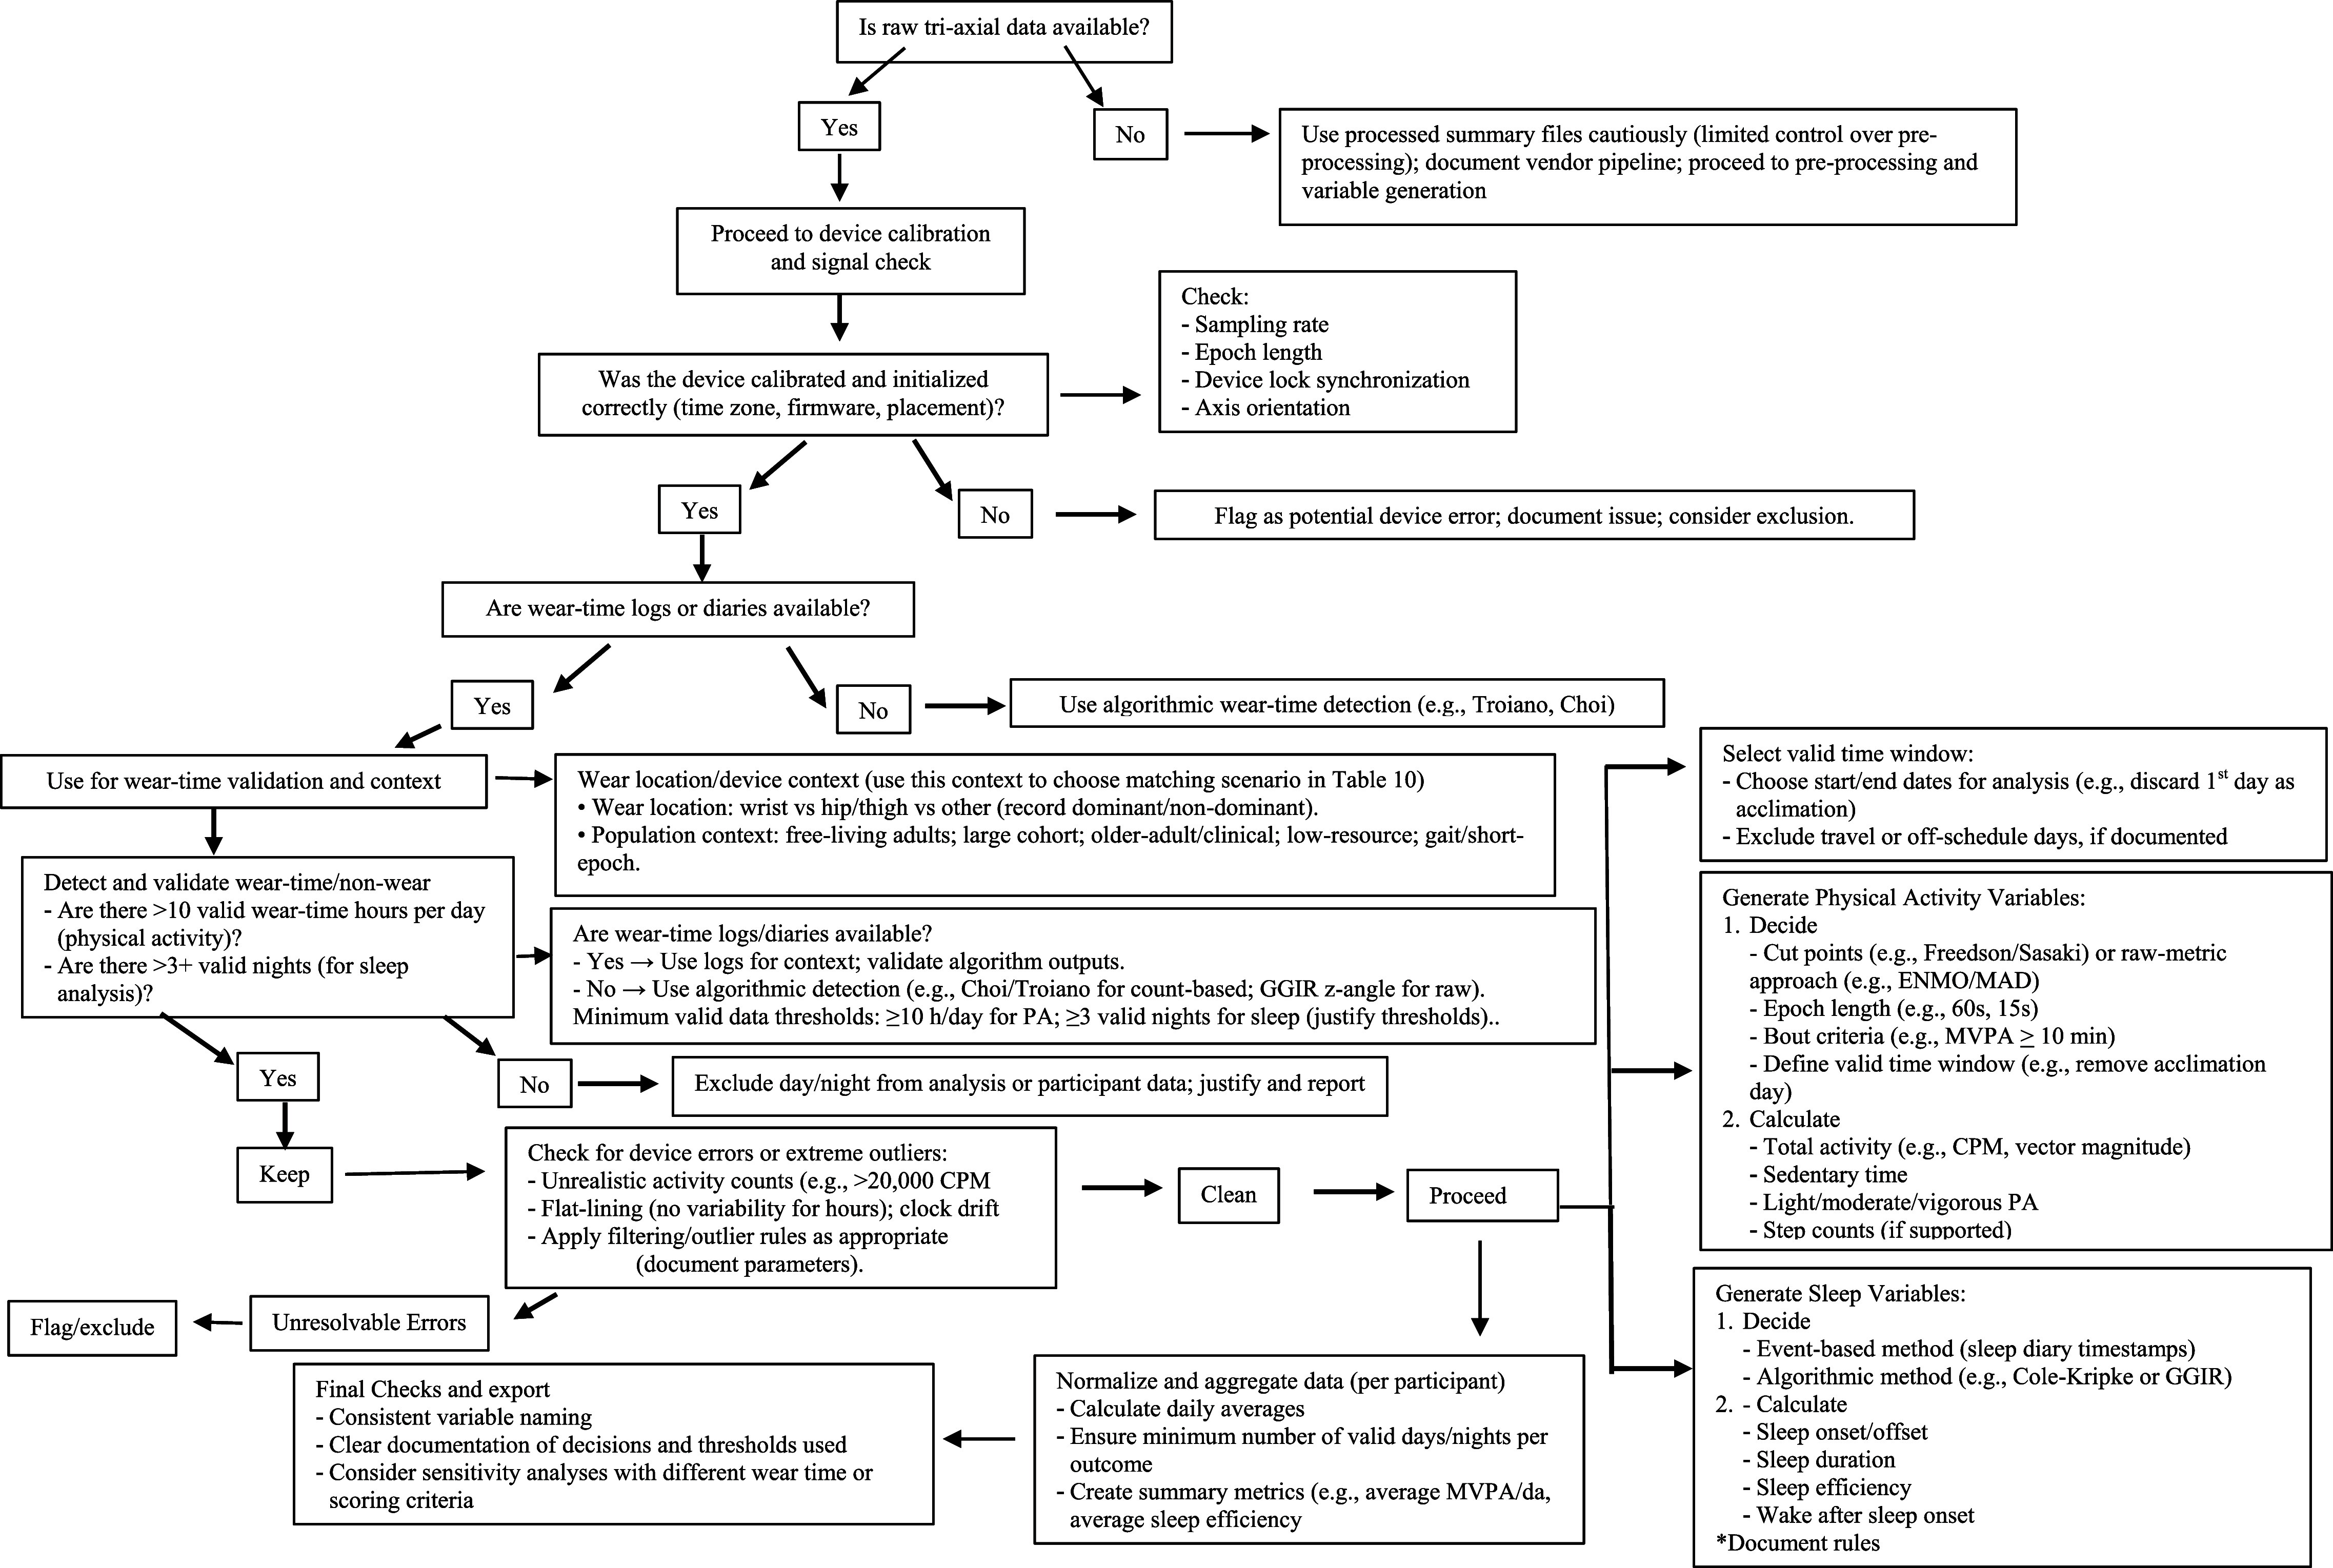 Figure 2
| Inclusion criteria | Exclusion criteria | ||
|---|---|---|---|
| Category | Criteria | Category | Criteria |
| 1. Study population | Human adults (>18 years old). If the population’s age is not mentioned, the article will be included | 1. Missing abstracts | Articles without abstracts |
|
| |||
| 2. Movement type | Human whole-body physical activity (i.e., entire body movement such as walking, skipping, jogging, and not just movement of one part or section(s) of the body, as in arms, feet, wrist, head, eyelids, etc.) | 2. Study population | If study population <18 years of age, or of mixed ages (e.g. includes both adults, adolescents, and/or pediatrics) |
|
| |||
| 3. Activity type | Article mentions activity monitor or device as actigraphy, tri-axial accelerometer, accelerometry, movement tracker, energy expenditure measuring device, or a synonym of any of these words | 3. Study subject(s) | Actigraphy studies of non-human subjects (e.g. wind turbines, robots, weather, earthquakes, continents, navigation, ocean, geologic processes, buildings, bridges, traffic, and inanimate objects) |
|
| |||
| 4. Publication type | Original research, methods and/or validation papers, pilot studies, and frameworks. If publication type is not clear, the paper will be included. | 4. Device types | Articles that mention using actigraphy for non-movement specific variables (e.g. body temperature, pulse ox, tremors), and/or to augment movement collection—besides whole body—such as muscle activity by EMG, heart rhythm by EKG, brain activity by EEG, eye movement by EOG, geographical location tracking (GPS), and 3D models of human movement |
|
| |||
| 5. Language | English only | 5. Sensor types | Movement ‘sensors’ other than accelerometers/actigraphy such as machine vision-based cameras, floor/step sensors, optical gait analysis sensors, pedometers, or step counters |
|
| |||
| 6. Data processing/analysis | Methodology and/or results section should mention data cleaning of human physical activity data, data scrubbing, data quality control, preparing data sets, data cleansing, and data pruning, or a synonym thereof. If data cleaning is not mentioned, the article will be included.
Data must be related to variables specific to movement; and Data cleaning must be on raw/unmodified data | 6. Publication types | Reviews (narrative, systematic, and meta-analysis), editorials, letters, commentary, books and/or book chapters, dissertations, conference abstracts and proceedings, case studies, case reports, opinion papers, posters, and briefs as well as grey literature and information produced outside of traditional publishing and distribution channels (e.g., reports, policy working/white papers, newsletters, speeches), and articles that are not empirical (i.e., only from theory) or that did not provide enough information for our analysis |
|
| |||
| 7. Publication date | 2017–2024 | 7. Study type | Animal and |
| Inclusion criteria | Exclusion criteria | ||
|---|---|---|---|
| Category | Criteria | Category | Criteria |
| 1. Device Type/location | Only studies which use an accelerometer (not pedometers or step counters) on the wrist and waist areas will be included | 1. Primary article subject and variables | Articles were excluded if they analyzed actigraphy data without reporting at least one raw-data cleaning or pre-processing step (e.g. non-wear detection, artifact removal, epoching, or signal filtering). Manuscripts reporting only derived PA/sleep outcomes (including sedentary time) with no cleaning/pre-processing description were excluded. |
|
| |||
| 2. Activity type | Human physical activity data from any type of whole bodily movement | 2. Movement type | Full text articles that do not include human, whole-body movement data. Studies specific to posture, gait, balance, tremors, gestures, falls, and fall detection systems (these activity patterns require algorithms, thresholds, filters, and statistical analysis different from typical physical activity) and special populations where movement is altered or impaired (e.g. lower limb amputees, wheelchair bound, casted foot or ankle fractures, cerebral palsy, etc) |
|
| |||
| 3. Inactivity/sleep | Studies that measure activity frequency, duration, and intensity to determine sedentary behaviors (SBs), and sleep-wake periods—in addition to PA—and distinguish times spent in each will be included | 3. Activity type | Articles that do not define wear versus non-wear and active versus sedentary activity |
|
| |||
| 4. Sensor placement | Studies which only use activity monitors/accelerometers in areas besides hip and wrist (e.g., 3D chest-mounted accelerometer, foot, ankle, back, head, etc.) | ||
|
| |||
| 5. Device type | Actigraphy/accelerometers from cell phones and pedometers. | ||
|
| |||
| 6. Publication type | Studies that use algorithms as combinations of accelerometers and gyroscopes attached to different body locations; unless specific procedure(s) are used to clean and score raw accelerometer data separately, and devices that pair accelerometers with other devices to measure non-motor activities (e.g. Brain activity EEG, Eye EOG, muscle EMG, heart ECG). | ||
|
| |||
| 7. Study type | Modeling, framework, and methodology studies (all without primary outcome of data cleaning) articles in which results were exclusively qualitative, or where no PA data was collected and/or analyzed | ||
|
| |||
| 8. Algorithms | Articles that do not describe the activity detection algorithms and/or data processing (cleaning) and analysis (scoring) methods, or if it is a proprietary algorithm, the method(s) used to clean and score raw data, or if no preprocessing of PA data was done, and AI or machine learning (i.e., neural networks, random forest (RF) classifier, human activity recognition) systems that preprocess the data. | ||
| Device Name | Manufacturer/notes | Number of studies |
|---|---|---|
| ActiGraph | ActiGraph LLC (USA)1 | 54 (52.9%) |
| Other/unique devices | e.g. Garmin Vivosmart, Empatica E46 | 28 (27.5%) |
| Used multiple devices | Used > 2 devices (e.g., wrist + hip) | 20 (19.6%) |
| ActiWatch | Philips Respironics (USA)2 | 13 (12.7%) |
| GENEActiv | ActivInsights Ltd (UK)3 | 11 (10.8%) |
| Fitbit | Google Fitbit (USA)4 | 10 (9.8%) |
| Axivity | Axivity Ltd (UK)5 | 5 (4.9%) |
| Not reported | Device not specified | 2 (2%) |
| Cleaning method | Category | Number of studies |
|---|---|---|
| Butterworth filters | Signal filter | 37 (36.3%) |
| Removal of specific time periods | Manual/data-driven | 21 (20.6%) |
| Low frequency extension (LFE) filters | Signal filter | 11 (10.8%) |
| Low pass filters | Signal filter | 10 (9.8%) |
| Visual inspection | Manual/data-driven | 10 (9.8%) |
| Calibration/auto-calibration | Manual/data-driven | 9 (8.8%) |
| Removal of data above/below thresholds | Manual/data-driven | 8 (7.8%) |
| Band pass filters | Signal filter | 8 (7.8%) |
| High pass filters | Signal filter | 7 (6.9%) |
| Consistency checks | Manual/data-driven | 1 (1%) |
| Custom/specialized cleaning (e.g., interpolation) | Study-specific | 31 (30.4%) |
| Not Reported | Method not specified | 25 (24.5%) |
| Non-Wear Algorithm | Number of studies |
|---|---|
| Choi | 23 (22.5%) |
| Self-report (logs) | 17 (16.7%) |
| Zero counts | 15 (14.7%) |
| Other techniques (e.g., DETACH) | 15 (14.7%) |
| Troiano | 10 (9.8%) |
| Temperature/light sensors | 6 (5.9%) |
| GGIR | 5 (4.9%) |
| Manual/visual inspection | 4 (3.9%) |
| Threshold-based methods | 1 (1%) |
| Not Reported | 38 (37.3%) |
| Metric type | Number of studies |
|---|---|
| Activity counts (proprietary) | 39 (38.2%) |
| General activity counts (axis not specified) | 28 (27.5%) |
| Euclidean norm-minus one (ENMO) | 14 (13.7%) |
| Mean of raw acceleration | 14 (13.7%) |
| Standard deviation/variance of raw acceleration | 12 (11.8%) |
| Signal vector magnitude (SVM) | 8 (7.8%) |
| Min/max of raw acceleration | 7 (6.9%) |
| Percentiles of raw acceleration | 5 (4.9%) |
| Mean amplitude deviation (MAD) | 4 (3.9%) |
| Dominant frequency of raw acceleration | 4 (3.9%) |
| Not reported | 4 (3.9%) |
| Other/study-specific metrics (e.g., directional change metrics) | 39 (38.2%) |
| Sleep outcome | Number of studies | Sleep outcome processing | Number of studies |
|---|---|---|---|
| Total sleep time (TST) | 26 (25.5%) | ActiWatch or Actical thresholds | 9 (8.8%) |
| Sleep efficiency (SE) | 16 (15.7%) | Cole–Kripke | 8 (7.8%) |
| Wake after sleep onset (WASO) | 15 (14.7%) | GGIR | 6 (5.9%) |
| Sleep onset latency (SOL) | 12 (11.8%) | Sadeh | 3 (2.9%) |
| Number of awakenings | 6 (5.9%) | Tudor-Locke | 1 (1%) |
| Time in bed (TIB) | 5 (4.9%) | Proprietary algorithms | 2 (2%) |
| Other outcomes | 18 (17.6%) | Other algorithms | 18 (17.6%) |
| Not reported | 71 (69.6%) | Not reported | 71 (69.6%) |
| Reporting element | Not reported | % of studies |
|---|---|---|
| Non-wear detection method | 38 | 37.3% |
| Daily wear-time threshold | 52 | 51.0% |
| Study-level inclusion criteria | 50 | 49.0% |
| Cleaning technique | 25 | 24.5% |
| Sampling rate | 14 | 13.7% |
| Epoch length | 8 | 7.8% |
| Device placement | 4 | 3.9% |
| Study | Accelerometer device | Initial cleaning technique | Non-wear detection algorithm | Daily wear time criteria | Study level wear time inclusion criteria | Activity metrics | Physical activity cut-points |
|---|---|---|---|---|---|---|---|
| ActiGraph | |||||||
|
| |||||||
| Beale | ActiGraph | Removal of data from a specific time | Zero counts | Fixed hour requirements | Fixed minimum days | Activity counts | Custom cut-points; Troiano |
| Bellettiere | ActiGraph | LFE filter | Choi; user-reported data; other | Not reported | Fixed minimum days | Activity counts | Other (Evenson) |
| Bevier | ActiGraph; Fitbit | Not reported | Troiano | Fixed hour requirements | Fixed minimum days | Activity counts | Freedson; proprietray |
| Brønd | ActiGraph; Axivity | High pass filter; low pass filter; band pass filter; other | Not reported | Not reported | Fixed minimum days | Activity counts | Freedson |
| Christofoletti | ActiGraph | Not reported | Choi | Fixed hour requirements | Fixed minimum days | Counts (axis not specified) | Freedson |
| Chu | ActiGraph | Visual inspection | Choi | Fixed hour requirements | Fixed minimum days | Counts (axis not specified) | Kozey-Keadle; Sasaki; Other |
| Chudyk | ActiGraph | Removal of data from a specific time | Choi; Troiano; Zero counts; User-reported data | Fixed hour requirements | Fixed minimum days | Activity counts | Freedson; Matthews |
| Cook ( | ActiGraph | Removal of data from a specific time | Zero counts; other | Fixed hour requirements | Fixed minimum days | Activity counts | Custom cut-points; Other |
| Ehrlich | ActiGraph | LFE filter; Removal of data from a specific time | Choi; Troiano; temperature, light, or other sensors; user-reported data | Fixed hour requirements | Not reported | Activity counts; ENMO | Other (Hibbing |
| Farrahi | ActiGraph | Removal of data above/below threshold; visual inspection | Other | Fixed hour requirements | Fixed minimum days | Activity counts | Freedson; Matthews |
| Gafoor | ActiGraph | Not reported | Not reported | Not reported | Not reported | Activity counts | Freedson |
| Graves | ActiGraph | Removal of data from a specific time | Choi | Fixed hour requirements | Fixed minimum days | Counts (axis not specified) | Other |
| Guediri | ActiGraph | LFE filter | Not reported | Fixed hour requirements | Fixed minimum days | Not reported | Not reported |
| Hibbing | ActiGraph | Butterworth filter; low pass filter; removal of data from a specific time | Other | Not reported | Not reported | ENMO; SVM; Other | Other (Hibbing |
| Jain | ActiGraph | Not reported | Choi | Fixed hour requirements | Fixed minimum days | Counts (axis not specified); Mean of raw acceleration; SD/variance of raw acceleration; Other | Custom cut-points; Machine learning algorithms; Other |
| Jang | ActiGraph; Fitbit | Removal of data from a specific time; other | Zero counts | Fixed hour requirements | Fixed minimum days | Activity counts | Freedson; Other |
| John | ActiGraph; Other | Butterworth filter; Band pass filter; Removal of data above/below threshold; other | Not reported | Not reported | Not reported | Counts (axis not specified); ENMO; Other | Other |
| Kalisch | ActiGraph | LFE filter; removal of data from a specific time | Choi | Not reported | Not reported | Activity counts; Other | Kozey-Keadle; Proprietary |
| Karas | ActiGraph | Not reported | Choi | Percentage-based requirements | Not reported | SVM; Other | Other |
| Kerr | ActiGraph | Removal of data from a specific time; visual inspection | Manual/visual inspection; Choi | Fixed hour requirements | Fixed minimum days | Activity counts; ENMO; Other | Freedson; Matthews; machine learning algorithms; other (Hildebrand) |
| Lee and Dall ( | ActiGraph | Removal of data from a specific time; Other | User-reported data | Not reported | Fixed minimum days | Activity counts | Freedson; Sasaki; Troiano; Other (Santos-Lazano, Hanggi, Morton) |
| Leonard | ActiGraph | Other | Zero counts; User-reported data | Not reported | Not reported | Counts (axis not specified) | Freedson |
| Loyen | ActiGraph | Removal of data above/below threshold | Troiano | Fixed hour requirements | Fixed minimum days | Activity counts | Troiano |
| Mikkelsen | ActiGraph; Fitbit | LFE filter | Choi; user-reported data; other | Fixed hour requirements | Fixed minimum days | Activity counts; other | Proprietary; Sasaki |
| Montoye | ActiGraph | Not reported | Choi; Troiano; Zero counts | Not reported | Not reported | Activity counts | Kozey-Keadle; Sasaki; Other (Montoye |
| Mueller | ActiGraph | LFE filter; other | Not reported | Not reported | Fixed minimum days | Activity counts | Freedson; Proprietary; Sasaki; Troiano; other (Williams equation, Crouter 2010) |
| Nelson | ActiGraph | LFE filter | Choi | Not reported | Not reported | Activity counts; other | Freedson; other (Copeland) |
| Ng | ActiGraph | Other | Troiano | Fixed hour requirements | Fixed minimum days | Counts (axis not specified) | Freedson |
| Nunes | ActiGraph | Other | User-reported data | Fixed hour requirements | Weekend inclusion requirement | Counts (axis not specified) | Freedson; Other |
| O’driscoll | ActiGraph; Fitbit | Other | Not reported | Not reported | Not reported | SVM; mean of raw acceleration; percentiles of raw acceleration; SD/variance of raw acceleration; min/max of raw acceleration; dominant frequency of raw acceleration; other | Machine learning algorithms |
| Poitras | ActiGraph | Butterworth filter; band pass filter; removal of data above/below threshold; other | Not reported | Not reported | Not reported | Activity counts | Sasaki |
| Redenius | ActiGraph; Fitbit | Not reported | Choi; user-reported data | Not reported | Not reported | Activity counts | Freedson; proprietary; Sasaki; Troiano |
| Sheng | ActiGraph | LFE filter; high pass filter; removal of data from a specific time | Not reported | Not reported | Not reported | Mean of raw acceleration; SD/variance of raw acceleration; Min/max of raw acceleration; other | Machine learning algorithms |
| Sillanpää | ActiGraph | Removal of data above/below threshold | Not reported | Not reported | Not reported | Activity counts | Sasaki |
| Stenbäck | ActiGraph; Other | Not reported | Not reported | Not reported | Not reported | Counts (axis not specified); SVM; MAD; Other | Freedson; machine learning algorithms; other (Vaha-Ypya) |
| Thralls | ActiGraph | Not reported | Choi | Fixed hour requirements | Fixed minimum days | Activity counts; other | Custom cut-points; machine learning algorithms; other (Copeland, Evenson) |
| Tomkins-Lane | ActiGraph | Not reported | Choi | Fixed hour requirements | Fixed minimum days | Counts (axis not specified) | Freedson; Other |
| Wang | ActiGraph | LFE filter | Troiano; user-reported data | Fixed hour requirements | Fixed minimum days | Activity counts | Sasaki |
| Weber | ActiGraph | Calibration/auto-calibration; consistency checks; Other | GGIR | Fixed hour requirements | Weekend inclusion requirement | ENMO; MAD | Other (Hildebrand, Migueles, Vaha-Ypya) |
| Webster | ActiGraph | LFE filter; Other | Choi | Fixed hour requirements | Fixed minimum days | Activity counts | Other (Aguilar-Farias, Evenson, Koster) |
| Winfree and Dominick ( | ActiGraph; Fitbit | Not reported | Troiano; Zero counts | Fixed hour requirements | Not reported | Activity counts; other | Freedson; Machine learning algorithms |
| Wing | ActiGraph | Visual inspection | Choi | Not reported | Not reported | Activity counts | Proprietary |
| Xu | ActiGraph | Band pass filter | Choi | Fixed hour requirements | Not reported | Activity counts | Freedson |
| Varma and Watts ( | ActiGraph | Other | Choi; user-reported data | Fixed hour requirements | Not reported | Activity counts | Kozey-Keadle; Other |
|
| |||||||
| Hacker | ActiWatch | Visual inspection | Zero counts | Fixed hour requirements | Fixed minimum days | Counts (axis not specified) | Other |
| Kim | ActiWatch | Other | Zero counts | Exclusion-based requirements | Not reported | Activity counts | Proprietary |
| Patel | ActiWatch | Not reported | Not reported | Not reported | Fixed minimum days | Counts (axis not specified) | Proprietary |
|
| |||||||
| Doherty | Axivity | Butterworth filter; low pass filter; calibration/auto-calibration; Other | Other | Hourly distribution requirements | Fixed minimum days | ENMO | Other (van Hees |
| Liang | Axivity | Butterworth filter; low pass filter; calibration/auto-calibration; Other | Other | Hourly distribution requirements | Fixed minimum days | ENMO | Other |
|
| |||||||
| Alinia | Fitbit; Other | Butterworth filter; low pass filter | Not reported | Not reported | Not reported | Mean of raw acceleration; percentiles of raw acceleration; other | Other |
| Clevenger | Fitbit | Removal of data from a specific time | User-reported data | Not reported | Fixed minimum days | Not reported | Proprietary |
| Meng | Fitbit | Removal of data above/below threshold | Other | Not reported | Fixed minimum days | Not reported | Proprietary |
|
| |||||||
| Dutta | GENEActiv | Not reported | Other | Fixed hour requirements | Fixed minimum days | SVM, mean of raw acceleration; SD/variance of raw acceleration; Other | Machine learning algorithms |
| Jones | GENEActiv; other | Removal of data from a specific time | Not reported | Not reported | Not reported | ENMO; mean of raw acceleration; percentiles of raw acceleration; SD/variance of raw acceleration; min/max of raw acceleration; dominant frequency of raw acceleration; other | Machine learning algorithms |
| Lin | GENEActiv | Calibration/auto-calibration | Temperature, light, or other sensors; other | Fixed hour requirements | Not reported | ENMO; other | Other (Migueles) |
| Montoye | GENEActiv | Removal of data from a specific time | Not reported | Not reported | Not reported | Mean of raw acceleration; percentiles of raw acceleration; SD/variance of raw acceleration; min/max of raw acceleration; dominant frequency of raw acceleration; other | Machine learning algorithms |
| Spulber | GENEActiv; ActiWatch | High pass filter; other | Manual/visual inspection | Not reported | Fixed minimum days | Counts (axis not specified); Other | Other |
| Tsanas | GENEActiv | Calibration/auto-calibration; visual inspection; other | Other | Not reported | Fixed minimum days | Other | Other |
| Vert | GENEActiv | Removal of data from a specific time; visual inspection | Manual/visual inspection; GGIR | Not reported | Not reported | SD/variance of raw acceleration | Not reported |
|
| |||||||
| Chuang | Other | Band pass filter | Threshold-based methods | Fixed hour requirements | Not reported | Activity counts | Other |
| Farrahi | Other | Not reported | Not reported | Fixed hour requirements | Weekend inclusion requirement | Other | Proprietary; machine learning algorithms |
| Filippou | Other | Butterworth filter | Not reported | Not reported | Not reported | SVM; mean of raw acceleration; SD/variance of raw acceleration; dominant frequency of raw acceleration; other | Machine learning algorithms |
| Fukuoka | Other | Other | Not reported | Fixed hour requirements | Fixed minimum days | Other | Machine learning algorithms; other |
| Giurgiu | Other | High pass filter; low pass filter | Not reported | Fixed hour requirements | Not reported | SVM | Proprietary |
| Li | Other | Not reported | Zero counts | Not reported | Not reported | Activity counts | Proprietary |
| Liu | Other | Butterworth filter; removal of data from a specific time; other | Zero counts | Not reported | Fixed minimum days | Counts (axis not specified) | Other |
| Nagayoshi | Other | High pass filter | Not reported | Not reported | Not reported | Other | Other (Okhawara two-regression, Oshima 2010 equation) |
| Poli | Other | Butterworth filter; high pass filter; low pass filter; other | Not reported | Not reported | Not reported | MAD; mean of raw acceleration; SD/variance of raw acceleration; other | Machine learning algorithms |
| Rhudy and Mahoney ( | Other | Butterworth filter; low pass filter | Not reported | Not reported | Not reported | Other | Other |
| Sevil | Other | Other | Not reported | Not reported | Not reported | Mean of raw acceleration; SD/variance of raw acceleration; min/max of raw acceleration; other | Machine learning algorithms |
| Spartano | Other | Visual inspection | Choi | Fixed hour requirements | Fixed minimum days | Counts (axis not specified) | Other (Colley) |
| Tanaka | Other | High pass filter | Zero counts | Fixed hour requirements | Fixed minimum days | Mean of raw acceleration; Other | Other |
| Tylcz | Other | Low pass filter | Not reported | Not reported | Not reported | Other | Custom cut-points |
| Wen | Other | Not reported | Not reported | Fixed hour requirements | Fixed minimum days | ENMO; Mean of raw acceleration | Other |
| Xu | Other | Calibration/auto-calibration; other | Not reported | Not reported | Fixed minimum days | SVM; Mean of raw acceleration; Percentiles of raw acceleration; SD/variance of raw acceleration; Min/max of raw acceleration | Machine learning algorithms |
| Batool | Not reported | Other | Not reported | Not reported | Not reported | Other | Other |
| Lee and Gill ( | Not reported | Removal of data from a specific time | Zero counts | Percentage-based requirements | Fixed minimum days | Counts (axis not specified) | Proprietary |
| Study | Accelerometer device | Initial cleaning technique | Non-wear detection algorithm | Daily wear time criteria | Study level wear time inclusion criteria | Activity metrics | Sleep outcomes | Sleep outcome algorithms |
|---|---|---|---|---|---|---|---|---|
| ActiGraph | ||||||||
| Barreira | ActiGraph | LFE filter | Not reported | Not reported | Fixed minimum days | Activity counts | TST | Sadeh; Custom |
| Bellettiere | ActiGraph | LFE filter | Choi; User-reported data; Other | Not reported | Fixed minimum days | Activity counts | TIB | Other |
| Chase | ActiGraph | Removal of data from a specific time | Other | Not reported | Fixed minimum days | Counts (axis not specified) | WASO; SOL; SE; TST; Other | Cole–Kripke |
| Lee and Suen ( | ActiGraph; ActiWatch | Removal of data above/below threshold | User-reported data | Required during sleep period | Weekend inclusion requirement | Activity counts | WASO; SE; TST | Sadeh; Cole–Kripke; ActiWatch/Actical sleep-wake thresholds; Other |
| Liu | ActiGraph; ActiWatch | Visual inspection | Not reported | Not reported | Fixed minimum days | Activity counts; Counts (axis not specified) | Number of awakenings; WASO; SE; TST; Other | Cole–Kripke; ActiWatch/Actical sleep-wake thresholds |
| Olsen | ActiGraph; Other | Low pass filter; other | Not reported | Required during sleep period | Fixed minimum days | Activity counts; ENMO; MAD; mean of raw acceleration; SD/variance of raw acceleration; min/max of raw acceleration; other | WASO; SOL; SE; TST; other | Custom |
| Plekhanova | ActiGraph; GENEActiv; Axivity | Calibration/auto-calibration; other | GGIR | Not reported | Not reported | Counts (axis not specified); ENMO | WASO; SOL; SE; TST; Other | Sadeh; GGIR |
| Sansom | ActiGraph | Calibration/auto-calibration | GGIR | Fixed hour requirements | Not reported | Counts (axis not specified); ENMO | WASO; SOL; SE; TST; TIB; Other | Tudor-Locke; Cole–Kripke; GGIR |
| Wing | ActiGraph | Visual inspection | Choi | Not reported | Not reported | Activity counts | SE; TST | Cole–Kripke; Other |
|
| ||||||||
| Buimer | ActiWatch; Other | Removal of data from a specific time; visual inspection | Manual/visual inspection; temperature, light, or other sensors; user-reported data | Not reported | Not reported | Activity counts | WASO; TST; TIB; Other | ActiWatch/Actical sleep-wake thresholds |
| Gibson and Gander ( | ActiWatch | Other | User-reported data; other | Not reported | Not reported | Counts (axis not specified) | Other | ActiWatch/Actical sleep-wake thresholds |
| Grau | ActiWatch; Other | Not reported | User-reported data | Percentage-based requirements | Fixed minimum days | Counts (axis not specified) | WASO; SOL; SE; TST; TIB; Other | ActiWatch/Actical sleep-wake thresholds |
| Patel | ActiWatch | Not reported | Not reported | Not reported | Fixed minimum days | Counts (axis not specified) | Number of awakenings; WASO; SOL; SE; TST; TIB; Other | ActiWatch/Actical sleep-wake thresholds |
| Rani | ActiWatch | Removal of data from a specific time; other | Not reported | Fixed hour requirements | Fixed minimum days | Counts (axis not specified); Other | WASO; TST; Other | ActiWatch/Actical sleep-wake thresholds; Custom |
| Razjouyan | ActiWatch | Band pass filter | Not reported | Not reported | Not reported | Counts (axis not specified) | WASO; SOL; SE; TST | Cole–Kripke; ActiWatch/Actical sleep-wake thresholds |
|
| ||||||||
| Liang | Axivity | Butterworth filter; Low pass filter; calibration/auto-calibration; other | Other | Hourly distribution requirements | Fixed minimum days | ENMO | TST | GGIR |
|
| ||||||||
| Clevenger | Fitbit | Removal of data from a specific time | User-reported data | Not reported | Fixed minimum days | Not reported | TST | Proprietary |
| Liu | Fitbit | Not reported | Zero counts | Other | Exclusion-based criteria | Other | TST | Proprietary; other |
|
| ||||||||
| Jenkins | GENEActiv; ActiWatch | Not reported | Not reported | Not reported | Not reported | Activity counts | WASO; SOL; SE; TST; other | ActiWatch/Actical sleep-wake thresholds |
| Lavin-Gonzalez | GENEActiv | Not reported | Not reported | Exclusion-based requirements | Fixed minimum days | Not reported | TST; other | GGIR; other |
| Spulber | GENEActiv; ActiWatch | High pass filter; other | Manual/visual inspection | Not reported | Fixed minimum days | Counts (axis not specified); other | Other | Other |
| Tsanas | GENEActiv | Calibration/auto-calibration; visual inspection; other | Other | Not reported | Fixed minimum days | Other | Number of awakenings; WASO; TST; other | GGIR; custom |
| Van Hees | GENEActiv; Axivity | Calibration/auto-calibration; other | GGIR | Exclusion-based requirements | Fixed minimum days | ENMO; other | SOL; SE; TST | GGIR |
| Vert | GENEActiv | Removal of data from a specific time; visual inspection | Manual/visual inspection; GGIR | Not reported | Not reported | SD/variance of raw acceleration | Did not provide sleep outcomes | Did not provide sleep outcomes |
|
| ||||||||
| Bailey | Other | Not reported | Not reported | Fixed hour requirements | Not reported | Counts (axis not specified) | WASO; SOL; SE; TST; other | Other |
| Barouni | Other | Butterworth filter; band pass filter; other | Temperature, light, or other sensors; Other | Not reported | Not reported | Other | TST | Custom |
| Chuang | Other | Band pass filter | Threshold-based methods | Fixed hour requirements | Not reported | Activity counts | WASO; TST; other | Cole–Kripke |
| Li | Other | Not reported | Zero counts | Not reported | Not reported | Activity counts | Other | Other |
| Ryser | Other | Removal of data above/below threshold | Not reported | Not reported | Not reported | Other | WASO; SOL; SE; TST | Cole–Kripke; custom |
| Sato | Other | Butterworth filter; band pass filter | Not reported | Not reported | Not reported | Other | TST | Other |
| Wulterkens | Other | Not reported | Not reported | Required during sleep period | Nights required | Counts (axis not specified) | Number of awakenings; WASO; SOL; SE; TST; other | Other |
| Scenario | Recommended cleaning approach | Recommended pre-processing/algorithm | Rationale/supporting references |
|---|---|---|---|
| Wrist-worn free-living adults | Choi or GGIR | GGIR or Cole–Kripke for sleep scoring; 60 s epoch | Widely validated; suitable for 24 h wear and sleep–wake detection |
|
| |||
| Hip-based large cohorts | Troiano 60 min zero-count; fixed ⩾10 h d−1 rule | Freedson or Sasaki cut-points | Consistency with NHANES and UK Biobank analyses |
|
| |||
| Older-adult/clinical studies | Visual inspection or temperature/light sensors | GGIR variance algorithm | Addresses variable compliance and movement patterns |
|
| |||
| Low-resource/open-source projects | Fixed threshold (⩾90 min zero-count) | GGIR or ACTman | Requires minimal proprietary software; reproducible across devices |
|
| |||
| Short-epoch/gait analyses | High-frequency (⩾ 80 Hz) sampling; Butterworth filter | Raw ENMO or MAD metrics | Captures brief, high-intensity events with fidelity |
- —National Institute of Nursing Research10.13039/100000056
Peer Reviews
No public reviews on file for this paper yet. If you reviewed it on a platform where reviews are public (OpenReview, ICLR, NeurIPS, ICML), you can paste yours below so the community can read it here.
Videos
No videos yet. Explain this paper in a talk, walkthrough, or lecture? Add one.
Taxonomy
TopicsSleep and related disorders · Physical Activity and Health · Mobile Health and mHealth Applications
Introduction
Over the past few decades, actigraphy has become increasingly relevant for measuring patterns of physical activity (PA) and sleep over the course of hours to weeks (Strath et al 2013, Smith et al 2018). The rise in popularity is partly due to the non-invasive nature of its sensors and its ability to provide continuous assessments of motion in free-living settings (Aadland and Ylvisåker 2015). Actigraphy devices, also called actimetry sensors, are electromechanical motion-sensor detectors (accelerometers) that are encased in small units the size of a wristwatch and sense movements that can then be converted into PA measures (Sylvia et al 2014). Evidence of the shift from traditional methods like polysomnography and self-reported activity logs, and from subjective or lab-based measurement tools, towards continuous, real-world activity tracking using actigraphy is reflected in the rapidly increasing number of studies that employ actigraphy devices and new approaches of analyzing actigraphy data (Migueles et al 2017, Smith et al 2018).
The use of actigraphy for PA and sleep studies has resulted in the generation of clinically relevant variables. In PA research, the most common variables generated from actigraphy include total steps, activity counts, time spent in different intensity levels (e.g. light, moderate, vigorous), energy expenditure (EE), and sedentary time (Troiano et al 2008, Migueles et al 2017). The intensity of PA is obtained by using activity count (often per minute) cut-points to differentiate between different intensity levels such as sedentary, light PA, and moderate-to-vigorous PA (MVPA) (Treuth et al 2004, Hänggi et al 2013, Montoye et al 2020). EE, measured in metabolic equivalent of task units, is an indication of how much energy the body uses to perform its functions and can be calculated from actigraphy data using equations developed by several different groups (Crouter et al 2006, 2012, Aguilar-Farias et al 2019). More than two dozen sleep parameters can be generated from actigraphy data, but only a few are often used in sleep research (Fekedulegn et al 2020), such as time in bed (TIB), which is the duration a participant spends lying in bed; sleep onset latency (SOL), which refers to the time it takes a person to fall asleep after lying down in bed; sleep efficiency (SE) which can be calculated in different ways but refers to the percentage of time spent asleep compared to the time spent just lying in bed; total sleep time (TST), which is the total number of minutes spent asleep while lying in bed; and wake after sleep onset (WASO), which is the time a person is awake between the onset and offset of sleep (Marino et al 2013, Fekedulegn et al 2020). In addition to these variables, the number and duration of awakenings during a sleep period are also commonly used (Berger et al 2005, Fekedulegn et al 2020).
However, despite the widespread use of actigraphy, data processing practices, particularly in cleaning and pre-processing of actigraphy data, remain highly heterogeneous. Over the years, new approaches have spawned from the traditional idea of ‘activity counts,’ which were often determined from software algorithms provided by the companies that produced popular devices. The rapid proliferation of devices and custom processing methods in both commercial and research settings have introduced considerable variability in how raw actigraphy data are handled. This variability is especially problematic when device-specific processing algorithms are opaque or poorly documented. Despite the attention on actigraphy and abundance of proposed processing techniques, there is still no standardized method of preparing actigraphy data for analysis that is universally accepted or widely adopted.
For this review, cleaning was defined as the removal or correction of raw data artifacts to improve data quality such as excluding non-wear time and reducing the noise of the data. Pre-processing was defined as the transformation of data into a usable format through steps such as re-epoching, generating derived activity metrics, identification of valid sleep windows, and application of scoring algorithms. Techniques to accomplish these tasks vary greatly among studies though. For example, there are several different published algorithms that can be employed to detect non-wear such as the Choi et al (2011), Troiano et al (2008), or GGIR algorithms (Hees et al 2013). Apart from algorithms, researchers have used other techniques such as simply using self-reported logs or removing periods with zero counts (Hutto et al 2013, Vanhelst et al 2019).
Recent literature has called attention to the lack of consensus on how actigraphy data should be cleaned, filtered, and transformed for analysis (Berger et al 2008, Beechy et al 2012, Smith et al 2018). Standardized procedures for identifying non-wear time, applying filtering algorithms, re-epoching, and setting inclusion thresholds are often either inconsistently reported or not reported at all (Migueles et al 2017). These gaps reduce the reproducibility of findings and complicate cross-study comparisons, which is particularly important in large-scale PA and sleep studies. In addition, few reporting frameworks exist to guide reporting clarity for actigraphy-based research (Fekedulegn et al 2020).
Recent developments in open-source actigraphy processing pipelines, such as GGIR and ACTman, are helping to improve transparency and reproducibility in the field (Migueles et al 2019, Kunkels et al 2020, Buchan and Baker 2023). These platforms offer freely available, standardized tools for cleaning, scoring, and analyzing raw accelerometer data, reducing dependence on proprietary software and enabling consistent processes and methods across studies. As these tools become more widely used, they have the potential to support broader efforts to make data processing and reporting more consistent in PA and sleep research.
Therefore, the purpose of this scoping review was to identify and summarize the most commonly reported methods for cleaning and pre-processing raw actigraphy data to generate research variables related to PA and sleep. In doing so, we aim to provide a resource for researchers working in a variety of settings, including those with limited access to proprietary software or computational infrastructure. The findings may also help inform future development of consensus-based reporting guidelines for actigraphy-based studies.
While prior reviews have cataloged actigraphy methods within specific populations or devices (Evenson et al 2015, Clevenger et al 2019, Haghayegh et al 2019, Tazawa et al 2019, Fuller et al 2020, Huang et al 2023, Suau et al 2024, Yuan et al 2024), this scoping review uniquely measures the reporting of cleaning and pre-processing steps across a wide range of devices, populations, and research designs. By clearly separating and examining these two key steps—cleaning (removing errors) and pre-processing (organizing the data)—our review provides a structured framework for evaluating how actigraphy data is handled and identifies key areas where reporting still remains inconsistent, unclear, or missing. This broad view is important for advancing transparency, reproducibility, and eventual consensus in actigraphy-based PA and sleep research.
Methods
Methods, protocol and registration
2.1.
This scoping review was conducted under the guidelines of the Joanna Briggs Institute’s methodology (Peters et al 2015), and reported using the Preferred Reporting Items for Systematic reviews and Meta-Analyses extension for Scoping Reviews (PRISMA-ScR, see figure 1) checklist (Tricco et al 2018). The protocol was registered on Open Science Framework at the following link: https://doi.org/10.17605/OSF.IO/K8QVP.
PRISMA flow diagram.
Eligibility criteria
2.2.
Table 1 includes the eligibility criteria used for screening the titles and abstracts of articles retrieved from the database searches.
For full text screening, additional eligibility criteria were added to further specify the device location or type, activity type, and sleep or inactivity to be included (table 2).
Information sources and search strategy
2.3.
A biomedical librarian (AAL) searched three online databases: PubMed (US National Library of Medicine), Scopus (Elsevier), and Web of Science: Core Collection (Clarivate Analytics) in April 2022 and with updates in June and August 2024. Additionally, the bibliographies of the records included after full-text screening and relevant reviews were reviewed by the team members and potentially relevant citations collected. The librarian then compared these collected records against the database search results and the unique records were then added for screening using the process described below.
The librarian developed the search strategy with feedback from the review team. A combination of keywords and controlled vocabulary terms (i.e., MeSH for PubMed) were used to describe the concepts of interest (i.e., actigraphy and data cleaning). The final search strategies used are in supplemental file 1. The searches were limited to articles published between 2017 and 2024 to capture more recently used devices, written in the English language, published as original research articles (excluded editorials, letters, case studies, case reports, conference abstracts, conference proceedings, commentary, protocols, reviews, errata, and corrigenda), and utilized human subjects.
Study selection
2.4.
Covidence (Veritas Health Innovation Ltd, Melbourne, Australia) was used for study screening. Study selection occurred in two rounds with two independent reviewers screening each record. The first round involved the screening of titles and abstracts based on the eligibility criteria in table 1. The second round involved the full text screening of those articles included from round 1. Additional eligibility criteria focused on the relevance of the study to our research questions were used for round 2 (table 2). Any conflicts among reviewers were discussed with the entire review team and a consensus decision was applied.
Prior to commencing the review, two rounds of piloting the screening steps were conducted on a total of 77 records randomly selected and added to Covidence by the biomedical librarian. All reviewers participated in the screening pilot. After the pilot, all conflicts were discussed and any revisions or clarifications to the eligibility criteria were made and documented in the protocol.
Data collection and data items
2.5.
Two independent reviewers collected data from each included article based on a pre-defined collection form in Covidence (supplemental file 2). An expert third reviewer (KC) resolved any discrepancies in the collected data between the two reviewers and ensured that other questions were answered accurately before approving the extracted data.
A pilot of the data collection process was completed with all reviewers using the 8 articles included after the screening pilot. Discrepancies were discussed and resolved by the entire review team and as needed, the data collection form in Covidence was updated.
The data collected from each included article was general citation information, study population size and type, study design, type of PA studied, criteria used to categorize PA, actigraphy data collection criteria (e.g., placement, sampling frequency, epoch length, non-wear time), actigraphy cleaning method used, actigraphy algorithms used, actigraphy variables reported, non-wear/sedentary times descriptions, and other general comments. See supplemental file 2 for more details.
Risk of bias
2.6.
The risk of bias for all included studies was not examined as the research questions were focused on data cleaning and pre-processing methodology rather than the conclusions that arise from the studies themselves.
Data synthesis
2.7.
A narrative summary with tables and figures will be presented including the PRISMA flow diagram. Answers to the data extraction form were grouped into larger categories if a common theme was found.
Results
The literature searches resulted in 15 541 records of which 5826 were removed (i.e., duplicates, records not meeting criteria) and 9715 unique records underwent screening. Of these, 9103 studies were excluded and 612 proceeded to full text screening where 509 studies were further excluded. A total of 103 records underwent data collection and one record was excluded because of irrelevance to PA or sleep, resulting in 102 included articles for the final analysis.
Study selection and characteristics
3.1.
The years of publication spanned eight years, from 2017 to 2024, with the highest number of studies (21%, n = 21) published in 2020. Most studies included participants of both sexes (80.4%, n = 82). A smaller proportion focused exclusively on females (n = 12, 11.8%), while two studies enrolled male participants only (2.0%). Six studies (5.9%) did not report the sex of participants. Participants in the included studies varied in health conditions: 38 studies enrolled healthy population, 20 were disease-specific, 21 used a mix of healthy and disease-specific individuals, and 23 did not report the health status of their participants.
The average sample size was 3071 participants (range = 3–96 600 from n = 101 studies), and one study did not report its population size. The sample sizes varied widely, from small-scale studies to large cohorts: the median sample size was 78, with an interquartile range of 41–289. When excluding studies with sample sizes greater than 10 000 (n = 96), the median was 71, and the IQR narrowed to 39–181. Several studies included large-scale population datasets such as National Health and Nutrition Examination Survey (NHANES) and the UK Biobank, which contributed to the wide range and high variability in sample sizes observed across the included studies.
Most studies were for validation and method development (n = 57) followed by cross-sectional (n = 42); very few were longitudinal observational (n = 5), longitudinal interventional (n = 3), descriptive (n = 5), and experimental (n = 1). In terms of where studies were conducted, the vast majority assessed activity counts in free-living settings (n = 80), which meant participants wore the actigraphy devices as they went about their normal life. Some studies were conducted in the laboratory (n = 15), and few were conducted in a participant-chosen location (n = 1), researcher-chosen location (n = 4), clinic (n = 4), other locations not specified above (n = 2), or multiple settings (n = 8), while 4 studies did not report their study setting.
Actigraphy device characteristics: models, placement, and sampling rates
3.2.
A variety of accelerometers were used (see table 3); in fact, some studies (n = 20) employed multiple devices simultaneously (e.g., wrist + hip) to assess study outcomes. ActiGraph77ActiGraph LLC, Pensacola, Florida, USA. was the most commonly used device (n = 54), followed by ActiWatch88Philips Respironics, Murrysville, Pennsylvania, USA. (n = 13), GENEActiv99ActivInsights Ltd, Kimbolton, Cambridgeshire, UK. (n = 11), Fitbit1010Google Fitbit, San Francisco, California, USA. (n = 10), and Axivity1111Axivity Ltd, Newcastle Helix, Newcastle upon Tyne, UK. (n = 5). A number of studies (n = 28) used other unique devices not included in these categories (e.g., Garmin Vivosmart or Empatica E4 wristband)1212e.g. Garmin Vivosmart (Garmin Ltd, Olathe, Kansas, USA), Empatica E4 (Empatica Inc, Boston, Massachusetts, USA)., and two studies did not report the device type.
The primary placement of actigraphy devices was either on the non-dominant wrist (n = 45) or right hip (n = 23). Placement affects the sensitivity and interpretation of movement data, making it a key consideration in PA and sleep study design (Quante et al 2015, Wennman et al 2019, Bate et al 2023). Apart from the wrist or hip, some studies also used secondary placements (n = 20). Wrist and hip placements are favored because they balance participant comfort with reliable data collection, the wrist for continuous wear and sleep monitoring, and the hip for accurate estimation of ambulatory PA (Ellis et al 2014, Zinkhan et al 2014, Gall et al 2022).
The most common sampling rates were 30 Hz (n = 25), 100 Hz (n = 18), and 32 Hz (n = 11), with 14 studies not reporting on their sampling rates. The remaining studies used various other sampling rates such as 80 Hz (n = 6), 60 Hz (n = 3), 64 Hz (n = 3), 50 Hz (n = 3), 1 Hz (n = 2), 200 Hz (n = 1), 25 Hz (n = 1), and 20 Hz (n = 1). Eleven of the studies also used multiple sampling rates. Sampling rates are an important consideration in actigraphy studies because higher frequencies (e.g., 100 Hz) provide higher sampling resolution and more detailed motion capture, which can improve the accuracy of the processed variables (Lettink et al 2024). However, higher sampling rates also increase data volume, which can place greater demands on device storage, battery life, and post-processing resources (Sasaki et al 2016). For most free-living adult studies, sampling frequencies of 30–100 Hz balance temporal resolution with battery life. Higher frequencies (⩾80 Hz) are advisable for short-epoch or gait analyses, whereas lower frequencies (<30 Hz) may miss micro-movements and are not recommended for high-intensity or sleep-fragmentation research.
Cleaning and pre-processing
3.3.
Cleaning refers to the removal or correction of raw data artifacts to ensure data integrity before further analysis (Broeck et al 2005). The techniques used by the reviewed studies included removal of non-wear time (n = 62), exclusion of invalid time periods (e.g. device removal or artifact-prone intervals, n = 21), calibration or auto-calibration (n = 9), visual inspection (n = 10), threshold-based exclusions (n = 8), and consistency checks (n = 1). Previous studies have highlighted a range of cleaning techniques commonly used in actigraphy research, such as removal of non-wear time, exclusion of artifact-prone periods, and application of threshold-based rules (Migueles et al 2017). In our review, we found that while some of these techniques—like visual inspection (n = 10), calibration (n = 9), and threshold-based exclusions (n = 8)—were used across studies, others such as consistency checks (n = 1) were rare or under reported. Additionally, removal of specific time periods (n = 21), often related to known non-wear or artifacts, was one of the most common cleaning steps in the reviewed studies. A substantial number of studies employed custom or study-specific approaches (n = 31), such as interpolation or unclassified filters, while 25 studies did not report their cleaning procedures. This lack of clear reporting shows a widespread gap in how cleaning methods are described across studies.
Pre-processing involves transforming the cleaned data into formats suitable for analysis, such as re-epoching, data aggregation, and feature extraction (Gabriel et al 2010, Fuster-Garcia et al 2015, Ortiz et al 2024). Signal filtering methods, often referred to as ‘cleaning’ in some literature, are technically pre-processing steps that shape the data for further analysis (Hees et al 2013). As listed in table 4, the filtering approaches used by the reviewed studies included Butterworth filters (n = 37), low-frequency extension (LFE) filters (n = 11), low-pass filters (n = 10), band-pass filters (n = 8), and high-pass filters (n = 7). These filters reduce noise or isolate specific frequency bands in the acceleration signal to help interpretation.
Epoch length and aggregation
3.4.
Following cleaning and filtering, accelerometer data were commonly re-epoched into standardized time intervals to facilitate comparison across studies and participants. This is a core pre-processing step aimed at summarizing continuous acceleration data into consistent, time-binned measures (Migueles et al 2017). Of the included studies, 22 used short epochs between (1–15 s), five used moderate epochs (30–60 s), 56 articles used either 60 s or daily epochs, 11 used combinations of short and long epochs, and eight studies did not report their epoch length. Shorter epochs allow for finer resolution of activity patterns and may better detect brief bouts of movement compared to longer intervals (Dorsey et al 2009, Ayabe et al 2013).
Non-wear detection methods
3.5.
Accurately identifying and characterizing non-wear time is essential for ensuring the valid interpretation of actigraphy data in PA and sleep studies (Choi et al 2011). Misclassified non-wear periods—such as when a participant removes the device—can be mistaken for sleep or sedentary behavior, which can lead to overestimating inactivity or underestimating PA and sleep time (Zhou et al 2015, Draper et al 2020, Vert et al 2022). This is especially critical in free-living studies, where the participants’ compliance and behavior are not directly observed (Vert et al 2022). Applying transparent and consistent non-wear detection methods improves data quality, reduces misinterpretation, and enhances reproducibility across studies (Knaier et al 2019). It also helps set clear rules for wear-time, which makes results more consistent and ensures that the data accurately reflects real behavior or PA (Draper et al 2020).
Approaches to identifying non-wear time varied considerably across studies (see table 5). Many researchers (n = 38) did not report the method used. Among those that did, the Choi algorithm was the most applied (n = 23); it determines non-wear based on three criteria: (1) non-zero count thresholds, (2) time windows for consecutive zero/non-zero counts, and (3) the presence of artifactual movements (Choi et al 2011). Other commonly used methods included self-reported activity logs (n = 17), and zero-count detection (n = 15), which classifies sustained low or no movement as non-wear (Choi et al 2011, Hutto et al 2013, Vanhelst et al 2019). Fifteen studies applied alternative or study-specific methods, such as the DETACH algorithm, which uses temperature and motion signatures to detect device removal (Vert et al 2022).
Additional non-wear detection methods included the Troiano algorithm (n = 10), which identifies non-wear as 60 consecutive minutes of zero counts, allowing brief interruptions of minimal activity (Troiano et al 2008), and sensor-based detection (n = 6), using temperature or light signals to infer removal. The GGIR z-angle algorithm (n = 5) uses variation in arm angle to detect non-wear (Hees et al 2011, 2013). Less frequently reported methods included manual inspection (n = 4) and threshold-based rules (n = 1).
Comparative strengths and limitations of non-wear algorithms: The Choi algorithm offers validated count-based detection but may miss brief removals. Troiano is ideal for large-scale datasets but less sensitive to short interruptions. GGIR z-angle integrates raw acceleration (and, when available, additional signals such as temperature), enhancing accuracy for wrist-based wear. Sensor- or light-based detection can improve precision but requires multi-channel devices. Manual inspection remains a useful reference but is impractical for high-volume data.
Daily and study-level wear-time criteria
3.6.
Once non-wear time was identified using these methods, studies applied specific thresholds to determine whether a day or participant met criteria for inclusion in the analysis. The amount of wear time required to include a day or participant in analysis has important implications for data quality. If thresholds are too strict, valid data may be excluded; if too lenient, periods of non-wear or inactivity may be misclassified as valid, reducing accuracy (Knaier et al 2019).
After identifying non-wear time, 39 studies applied fixed-hour requirements to define a valid day (e.g., requiring a minimum number of hours worn per day). A few studies used alternative daily criteria, including percentage of the day worn (n = 3), hourly distribution across the day (n = 2), sleep-specific requirements (n = 3), or exclusion-based rules (n = 4). However, more than half of the studies (n = 52) did not report any daily wear-time threshold. For study-level inclusion, 50 studies also did not report the minimum number of valid days required. Among those that did, 46 studies used a fixed number of days as an inclusion threshold, while others required weekday and weekend representation (n = 4), a certain number of nighttime recordings (n = 1), or used additional exclusion criteria (n = 1). In summary, wear-time criteria varied widely across studies, and many failed to report them altogether, limiting comparability and replication across actigraphy-based research.
Activity metrics derived from acceleration data
3.7.
Reviewed actigraphy studies used a range of metrics derived from accelerometer data, broadly falling into two categories: device-specific processed outputs and raw acceleration-derived metrics (see table 6). Activity counts, which are the most commonly used metric, were reported in 39 of the 102 reviewed studies. They refer to device-specific units calculated over time intervals using proprietary algorithms provided by the manufacturer. These counts quantify acceleration within a fixed epoch and may differ in calculation between devices. Another 28 studies reported using general activity counts without specifying the axis measured. In contrast, metrics derived from raw acceleration data, which are typically device-independent and reproducible across platforms, included Euclidean Norm Minus One (ENMO, n = 14), the mean of raw acceleration (n = 14), and the standard deviation or variance of raw acceleration (n = 12). Less frequently used metrics in this category included signal vector magnitude (SVM, n = 8), minimum/maximum acceleration (n = 7), percentiles of raw acceleration (n = 5), mean amplitude deviation (MAD, n = 4), and dominant frequency (n = 4). Four studies did not report the specific metrics used. Additionally, 39 studies used other unique or study-specific metrics. For example, one study used a modified ENMO formula, another used a modified activity count formula, and a third study applied a directional change metric.
PA outcomes and processing
3.8.
The methods used to generate PA variables from actigraphy data varied greatly. In fact, many studies (n = 45) used techniques that appeared only once or twice across the 102 reviewed articles. For example, some used Montoye’s 2020 cut-points (n = 1, sedentary <2860 counts/min, light 2860–3940 counts/min, and MVPA ⩾3941 counts/min) (Montoye et al 2020) or developed custom cut-points specific to their population (n = 3). The most-applied standardized methods to process PA outcomes were Freedson cut-points or equations (n = 19) (Freedson et al 1998), followed by proprietary algorithms (n = 14), and other machine learning techniques (n = 16). Other named standards included Sasaki cut-points (n = 9) (Sasaki et al 2011), Troiano (n = 5) (Troiano et al 2008), Kozey-Keadle (n = 4) Kozey-Keadle et al 2011), and Matthews (n = 3) (Matthew 2005), while only one study did not report its method.
The use of such diverse and often study-specific cut-points limits direct comparability across studies, particularly when similar intensity labels (e.g., ‘moderate activity’) may correspond to widely different count thresholds. Only 27% of studies (n = 28) used commonly accepted and well-documented thresholds such as Freedson, Sasaki, or Troiano, which further challenges comparisons. These differences mean that the same raw acceleration data can yield different interpretations of PA intensity depending on the cut-point system applied. This directly influences PA summary variables such as minutes per day in MVPA or time spent sedentary and ultimately impacts comparisons across studies. Although some studies applied machine learning approaches to classify PA intensities (n = 6), these methods were not validated or compared against established cut-point systems in the studies we reviewed. As our review focused on identifying common cleaning and pre-processing approaches used to generate actigraphy-derived PA and sleep variables, the validation of the classification methods was outside the scope of our analysis. Table 9a summarizes cleaning and pre-processing practices used in PA research, including device type, non-wear detection approaches, daily/study-level wear criteria, and cut-point selection.
Sleep outcomes and scoring algorithms
3.9.
Most articles (n = 71) did not report any sleep-related outcomes. As listed in table 7, among the 31 studies that did, the most reported variables were TST (n = 26), SE (n = 16), WASO (n = 15), and SOL (n = 12). Less frequently reported were number of awakenings (n = 6) and TIB (n = 5). The remaining studies (n = 18) generated other sleep-related variables that appeared too infrequently to categorize. For example, a few studies reported measures such as interdaily stability (n = 2), intradaily variability (n = 2), or average awakening length (n = 2), which may reflect attempts to capture more complex aspects of sleep-wake patterns.
A total of 18 studies applied algorithms or computational techniques to generate sleep-related variables. These included custom algorithms or deep learning methods developed specifically for the study. Table 9b summarizes methods in sleep-focused actigraphy research, including device placement, wear-time criteria, cleaning approaches, and sleep outcome algorithms. Among the standardized tools, the most used were ActiWatch or Actical sleep-wake thresholds (n = 9), followed by the Cole–Kripke algorithm (n = 8), which is widely used for sleep-wake classification and validated in adult populations (Cole et al 1992). Other methods included the GGIR algorithm (n = 6), which estimates sleep using the variance in the z-axis angle derived from raw acceleration data (Van Hees et al 2018), and the Sadeh algorithm (n = 3), originally developed for children but later validated for adolescents and adults (Sadeh et al 1994). Additionally, proprietary algorithms provided by commercial vendors were used in two studies, while one study applied the Tudor-Locke algorithm, which identifies ‘bedtime’ and ‘wake time’ and can integrate multiple sleep episodes across a 24 hour period (Tudor-Locke et al 2014).
Discussion
Across the 102 included studies, there was substantial variability in devices, data cleaning, pre-processing, and algorithmic approaches used to generate PA and sleep variables (see table 6). Although actigraphy remains a widely adopted tool for non-invasive monitoring of free-living behaviors, the field is challenged by a lack of consensus on standard protocols and inconsistent reporting practices. These inconsistencies undermine the comparability, reproducibility, and interpretability of actigraphy-derived findings across studies, as has been previously noted in the literature (Morgenthaler et al 2007, Berger et al 2008, Beechy et al 2012, Smith 2015, Smith et al 2018). Given the central role these thresholds play in ensuring data validity, their omission significantly hinders reproducibility. This variability highlights the urgent need for standardized reporting and consensus-based protocols in actigraphy data cleaning and pre-processing.
A prior systematic review by Migueles et al (2017) classified studies using the ActiGraph GT3X/+ to assess sedentary time, PA, EE, and sleep, and evaluated data collection and processing methods by age group (Migueles et al 2017). While that work offered valuable practical considerations, it was limited to studies published between 2010 and 2015 and focused exclusively on one type of device. Similarly, Gorman et al (2014) reviewed accelerometry studies in older adults to examine variation in cut-points for MVPA and sedentary behavior, demonstrating how different processing thresholds can yield markedly different activity estimates (Gorman et al 2014). However, their review was restricted to waist-worn ActiGraph devices and did not explore cleaning, non-wear detection, or sleep processing methods. In contrast, our scoping review captured a broader swath of the actigraphy literature from 2017 to 2024, including multiple device types (e.g. ActiGraph, GENEActiv, Fitbit) and analytical approaches. Our review builds on and extends these earlier findings by identifying substantial underreporting of important processing steps such as non-wear detection methods (unreported in 37% of studies), daily wear-time criteria (51% not reported), and cleaning procedures (24% not reported). To provide scenario-driven guidance, we developed a decision tree (figure 2) illustrating conditional workflows for actigraphy data. The tree links study design choices to recommended cleaning and pre-processing decisions, beginning with device calibration and raw data availability and progressing through non-wear detection, variable generation, and final data export.
Proposed decision tree for cleaning and pre-processing of actigraphy data for physical activity and sleep research. The tree incorporates conditional branches for (a) device type and wear location, (b) data availability (raw vs proprietary), and (c) study population. Each terminal node references recommended algorithms and corresponding rows in table 10, providing step-by-step guidance from data acquisition to derived metrics.
We also summarize actigraphy processing practices across a broader range of study designs, populations, and device settings. Importantly, we highlight low-resource-compatible methods that can be implemented without proprietary software, making our findings particularly relevant for settings with limited resources. Recognizing the critical need for transparent reporting, we also created a reproducibility checklist (supplementary file 1) that outlines essential reporting elements for actigraphy studies. The checklist covers device specifications, data acquisition parameters, cleaning methods, wear-time criteria, handling of missing data, sleep/wake identification, and software/code availability. This structured tool complements existing reporting guidelines and supports reproducibility across diverse study designs.
Another major finding was the inconsistent application of non-wear detection and wear-time thresholds. Over half of the reviewed studies did not report daily wear-time criteria, and nearly half omitted study-level wear-time inclusion criteria altogether. The diversity in PA cut-points further complicates the synthesis of findings across studies. While Freedson cut-points were the most frequently used, fewer than one-third of studies applied established methods such as Freedson, Sasaki, or Troiano. Many opted for proprietary or machine learning-derived approaches that lacked clear documentation or validation. These inconsistencies can yield conflicting interpretations of activity intensity, even when analyzing the same raw data. It is also important to note that many widely used cut-points were originally developed in younger, generally healthy adults. For studies in older adults or those with chronic illness, these thresholds may not adequately capture true activity intensity, and alternative or population-specific methods may be more appropriate.
Unclear or missing reporting was common across studies. For example, 37% of studies did not mention a non-wear detection method, 51% left out daily wear-time rules, and nearly one-quarter did not explain any cleaning steps. These gaps directly make it harder to repeat the research and combine findings across studies. To enhance future reporting, table 8 shows the most commonly missing details. These missing details show that clear reporting guidelines that match existing efforts to make studies easier to repeat and help combine data across research projects is needed.
Although ActiGraph was the most frequently used device, considerable variation existed even within studies using this brand such as considerable variation in sampling rates, epoch lengths, and wear locations. Similarly, preprocessing techniques varied widely. For example, filtering methods ranged from Butterworth to LFE and band-pass filters, and cleaning approaches included everything from manual inspection to algorithmic thresholding. Notably, 24 studies did not report any cleaning method, underscoring a pervasive gap in clearly reported methods. The major implication of variability in actigraphy cleaning and preprocessing methods is a reduction in cross study comparisons and reproducibility of study findings across research settings. Inconsistent or undocumented approaches make it difficult to replicate analyses, compare outcomes across studies (even when using similar devices or populations), synthesize data for meta-analyses, or draw reliable conclusions about the effects of interventions or exposures due to the added methodological noise (Migueles et al 2017).
A few cleaning and pre-processing techniques used in some of the reviewed articles can be used in low resource research settings. With cleaning, visual inspection and fixed non-wear thresholds (e.g., Choi algorithm) can be implemented without proprietary tools or advanced programming knowledge. For pre-processing, the use of open-source algorithms such as GGIR and epoching to standard intervals (e.g., 60 s) provides a replicable foundation that is not resource-intensive and is broadly supported in the literature.
Each set of cut-points (e.g. Freedson, Sasaki, Troiano, Kozey-Keadle and Matthews) were derived from different calibration studies and used different methods and assumptions, which leads to variation in how they are applied. For example, the Freedson cut-points were developed from hip-worn ActiGraph data in young adults using treadmill-based EE and classify moderate activity at 1952–5724 counts/min (Freedson et al 1998). Sasaki cut-points also come from treadmill-based studies but focus on vector magnitude data rather than a single axis, shifting the thresholds slightly higher for equivalent intensities (Sasaki et al 2011). Troiano cut-points are based on the NHANES and include broader age ranges, offering thresholds like 2020–5999 counts/min for moderate activity (Troiano et al 2008). Kozey-Keadle cut-points were developed using overweight, inactive office workers in free-living conditions, with lower sedentary thresholds (<150 counts/min) that reflect minimal movement (Kozey-Keadle et al 2011). Matthews cut-points are among the more conservative, classifying moderate activity at ⩾760 counts/min, often leading to higher estimates of time spent in MVPA (Matthew 2005).
Sleep scoring was even less commonly reported, with only 31 of 102 studies including sleep outcomes. Among these, Cole–Kripke and GGIR were the most commonly used algorithms. The small number of studies reporting sleep-related metrics, and the variety of algorithms applied, shows the lack of standardization in actigraphy-based sleep research.
Building upon our synthesis, we provide scenario-driven guidance that connects common study designs to recommended cleaning and pre-processing choices (table 10). For wrist-worn, free-living adult studies, validated non-wear approaches (e.g. Choi or GGIR z-angle) paired with diary-based sleep-window alignment and standardized sleep scoring can improve comparability across studies. For hip-based large cohort studies, established wear-time rules (e.g., Troiano-style criteria) and widely used cut-points (e.g., Freedson or Sasaki) are consistent with established surveillance approaches.
In older-adult or clinical samples, where compliance may be intermittent and movement patterns atypical, visual inspection or sensor-assisted detection (e.g. temperature/light when available) may reduce misclassification, and sensitivity analyses are encouraged when alternative thresholds materially change inclusion. In low-resource or open-source settings, fixed non-wear thresholds combined with reproducible approaches (e.g. GGIR or ACTman) can reduce reliance on proprietary software. Finally, for short-epoch or gait-focused analyses, higher sampling rates with appropriate filtering help preserve transient features, and raw-metric outputs (e.g., ENMO/MAD) are preferred when comparability across-devices is required.
Altogether, these findings reveal both the flexibility and the fragmentation of actigraphy data cleaning and pre-processing practices. There is an urgent need for consensus-driven guidelines that promote standardization without limiting adaptability across research settings. Emerging efforts to develop standardized accelerometry reporting recommendations (e.g., Welk et al 2019) may help ensure that actigraphy methods are fully described and replicable. Additionally, publicly available code libraries (e.g., GGIR in R, ACTman) and method-sharing platforms can help standardize methods and reduce barriers to high-quality actigraphy analysis, especially in settings with limited computational infrastructure (Kunkels et al 2020, Gao et al 2021, Suarez et al 2024).
Future directions
4.1.
To help make actigraphy research more consistent, future efforts should focus on creating guidelines that clearly outline essential reporting requirements for cleaning data, preparing it for analysis, and creating outcome measures. These guidelines could be modeled after established frameworks such as STROBE (Cuschieri 2019) or CONSORT (Hopewell et al 2025), with adaptations for device-based data. Ideally, these guidelines would be created together by a group of experts from different backgrounds, including researchers, data specialists, software developers, and journal editors, with input from teams working in both well-funded and limited-resource settings. Professional organizations, funding groups, and public health agencies could help lead these efforts. Journals could also play an important role by asking authors to follow clear reporting checklists or by encouraging the use of open-source tools and shared data. Over time, these steps would help others repeat studies more easily, allow for better comparisons between studies, and support larger reviews that combine data from multiple projects.
Limitations
4.2.
This scoping review has several limitations. First, although our search strategy was comprehensive and guided by a biomedical librarian, we limited inclusion to articles published in English between 2017 and 2024, which may have excluded relevant studies published earlier or in other languages. Second, because we focused on studies that explicitly described actigraphy cleaning and preprocessing methods, articles that used such methods but did not report them in sufficient detail may have been excluded, potentially underestimating usage patterns. Third, due to the scoping nature of the review, we did not assess the quality of study design or risk of bias of the included studies, as our objective was to map the range and variability of methods rather than evaluate study outcomes. Fourth, while we attempted to capture both PA and sleep variables, the relatively small number of studies reporting sleep outcomes limited our ability to summarize findings in that area. Finally, given variation across studies in how methods were reported, including differences in terminology, level of detail, and documentation, as well as differences in device brands and algorithm labels, some categorization decisions (e.g. grouping filters or thresholds) may have introduced minor inconsistencies, despite the use of independent reviewers and group decision-making.
Additionally, while we aimed to categorize data processing methods consistently, some studies provided limited or unclear descriptions of their approaches. This may have led to interpretation or classification differences, especially when distinguishing between cleaning, filtering, and scoring steps. Differences in terminology used by authors (e.g., equating ‘cleaning’ with ‘pre-processing’ or using ‘filtering’ inconsistently) may have influenced how methods were grouped, despite our use of predefined definitions and consensus coding. Moreover, some techniques may be more commonly reported simply due to concentration among high-publishing groups or well-known datasets, which we did not stratify by region or institution. Lastly, we did not report interrater reliability statistics for the full review but calculated agreements during the initial abstract screening phase, where interrater reliability exceeded 85%. All data extraction discrepancies were resolved through team consensus
Still, this scoping review offers a useful overview of how actigraphy data are currently cleaned and pre-processed in research. By covering a wide range of published work, reviewing many studies across different fields, we were able to find common patterns, gaps in reporting, and areas where more consistent methods could help. As is typical for a scoping review, our aim was to describe what is out there, not to evaluate which methods are best. This broad approach can serve as a helpful starting point for researchers looking to improve and standardize actigraphy methods in the future.
Conclusions
This review contributes to the field by identifying areas where standardization would be most impactful, such as non-wear detection, cleaning transparency, and the selection of PA cut-points. Future reporting guidelines should prioritize transparency in key data processing steps, including cleaning, pre-processing, and algorithm selection. Establishing minimum reporting standards would enable better cross-study comparisons, support secondary analyses, and accelerate reproducibility in PA and sleep research.
The reference list from the paper itself. Each links out to its DOI / PubMed record.
- 1Aadland E Ylvisåker E 2015 Reliability of the actigraph GT 3X+ accelerometer in adults under free-living conditions P Lo S One 10e 013460610.1371/journal.pone.013460626274586 PMC 4537282 · doi ↗ · pubmed ↗
- 2Aguilar-Farias N Peeters G M E E G Brychta R J Chen K Y Brown W J 2019 Comparing Acti Graph equations for estimating energy expenditure in older adults J. Sports Sci.3718895188–9510.1080/02640414.2018.148843729912666 PMC 6298850 · doi ↗ · pubmed ↗
- 3Alinia P Fallahzadeh R Connolly C P Ghasemzadeh H 2020 Para Label: autonomous parameter learning for cross-domain step counting in wearable sensors IEEE Sens. J.20138677913867–7910.1109/JSEN.2020.3009231 · doi ↗
- 4Ayabe M Kumahara H Morimura K Tanaka H Ayabe M Kumahara H Morimura K Tanaka H 2013 Epoch length and the physical activity bout analysis: an accelerometry research issue BMC Res. Notes 62010.1186/1756-0500-6-2023331772 PMC 3558345 · doi ↗ · pubmed ↗
- 5Bailey G A Matthews C Szewczyk-Krolikowski K Moore P Komarzynski S Davies E H Peall K J 2023 Use of remote monitoring and integrated platform for the evaluation of sleep quality in adult-onset idiopathic cervical dystonia J. Neurol.2701759691759–6910.1007/s 00415-022-11490-436414751 PMC 9971061 · doi ↗ · pubmed ↗
- 6Barouni A Ottenbacher J Schneider J Feige B Riemann D Herlan A Hardouz D E Mclennan D 2020 Ambulatory sleep scoring using accelerometers—distinguishing between nonwear and sleep/wake states Peer J 8e 828410.7717/peerj.828431915581 PMC 6942683 · doi ↗ · pubmed ↗
- 7Barreira T V Redmond J G Brutsaert T D Schuna J M Mire E F Katzmarzyk P T Tudor-Locke C 2018 Can an automated sleep detection algorithm for waist-worn accelerometry replace sleep logs?Appl. Physiol. Nutr. Metab.431027321027–3210.1139/apnm-2017-086029701486 · doi ↗ · pubmed ↗
- 8Bate G L et al 2023 The role of wearable sensors to monitor physical activity and sleep patterns in older adult inpatients: a structured review Sensors 23488110.3390/s 2310488137430796 PMC 10222486 · doi ↗ · pubmed ↗