Evaluation of a machine learning system for genomic antimicrobial susceptibility determination on a clinically representative test set
Jason D. Wittenbach, Arolyn Conwill, Hayden Sansum, Alison Gassett, Adam Gardner, Allison Brookhart, Talia Hollowell, Paul Knysh, Nicholas B. Worley, Nicole Billings, Ian C. Herriott, Julie A. Shimabukuro, Kathleen A. Quan, Keith M. Madey, Susan S. Huang, Mohamad R. A. Sater

TL;DR
A new machine learning system accurately predicts antibiotic resistance from bacterial genomes, outperforming traditional methods.
Contribution
The paper introduces Keynome gAST, a machine learning system for genomic AST with high accuracy across diverse species-drug combinations.
Findings
Keynome gAST achieved 96.9% categorical agreement with phenotypic AST results across 97 species-drug combinations.
Keynome gAST outperformed ResFinder with 96.0% binary accuracy versus 83.5%.
ResFinder's limitations were due to low sensitivity and specificity in identifying resistance markers.
Abstract
Next-generation sequencing is anticipated to transform infectious disease treatment by enabling faster diagnosis, yet a clinical-grade method for genomic AST determination is still lacking. We assessed the accuracy of Keynome gAST, a k-mer based machine learning system for genomic AST, on 956 clinical bacterial isolates. We compared 7,801 predictions of susceptible (S), intermediate (I), and resistant (R) across 97 species-drug combinations against phenotypic AST results. Across the full data set, the Keynome gAST Qualified panel achieved a categorical agreement of 96.9% with very major and major error rates of 1.4% and 0.8%, respectively. At the level of individual species-drug combinations with sufficient data to assess, performance was comparable to the aggregate, with median categorical agreement of 97.4%. We also compared the performance of Keynome gAST to ResFinder, a simple…
Genes, proteins, chemicals, diseases, species, mutations and cell lines named across the full text — each resolved to its canonical identifier and authoritative record.
Click any figure to enlarge with its caption.
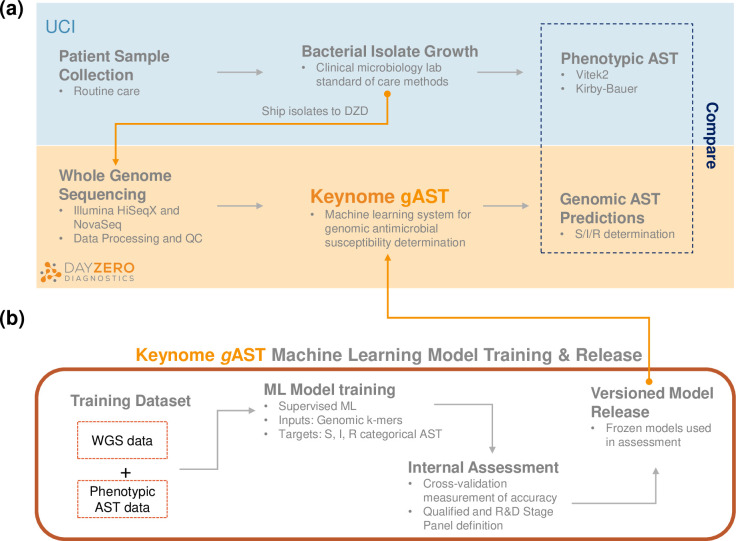 Fig 1
Fig 1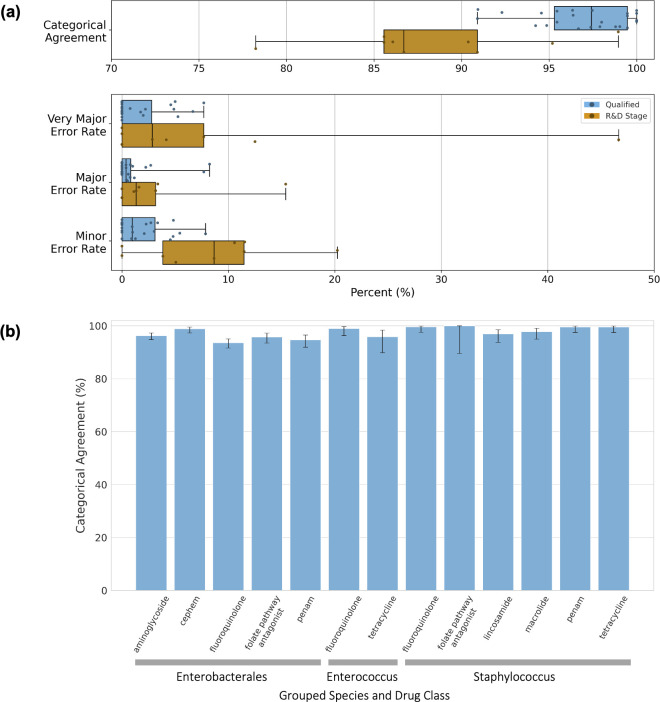 Fig 2
Fig 2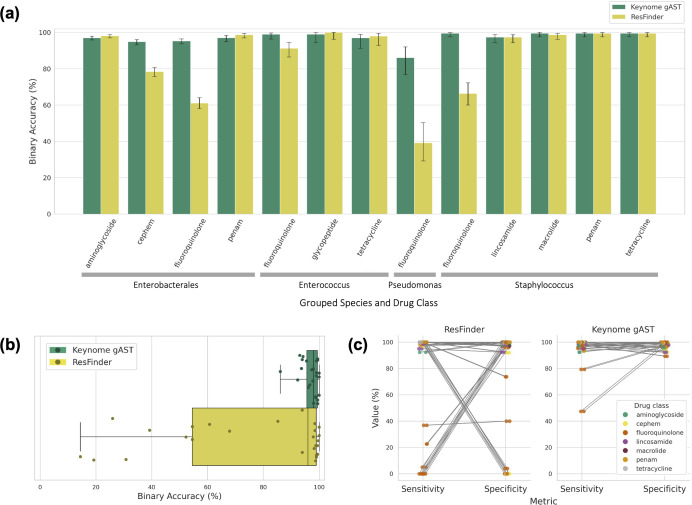 Fig 3
Fig 3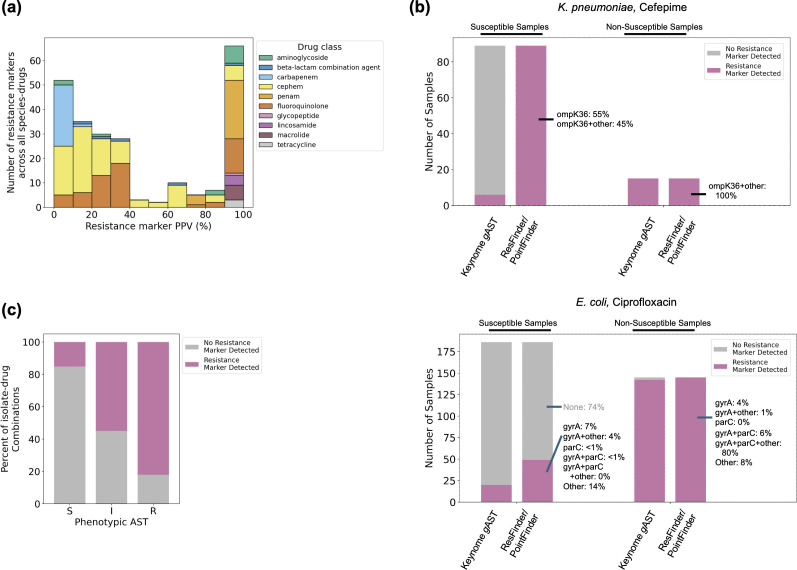 Fig 4
Fig 4| Species | # Isolates | # Antibiotics | # ASTs predicted |
|---|---|---|---|
|
| 7 | 11 | 71 |
|
| 12 | 3 | 36 |
|
| 17 | 5 | 85 |
|
| 79 | 5 | 385 |
|
| 18 | 5 | 90 |
|
| 333 | 14 | 3,840 |
|
| 9 | 1 | 9 |
|
| 104 | 12 | 1,126 |
|
| 10 | 2 | 20 |
|
| 11 | 4 | 44 |
|
| 44 | 6 | 264 |
|
| 79 | 3 | 237 |
|
| 191 | 7 | 1,336 |
|
| 33 | 7 | 231 |
|
| 3 | 3 | 9 |
|
| 3 | 3 | 9 |
|
| 1 | 3 | 3 |
|
| 2 | 3 | 6 |
| Analysis level | Aggregate | Species-drug | |||
|---|---|---|---|---|---|
| Qualified panel | R&D stage panel | Qualified panel | R&D stage panel | ||
|
|
| ||||
| # models | 52 | 45 | # models | 24 | 9 |
| # species | # drugs | 15 | 17 | 17 | 19 | # species | # drugs | 6 | 11 | 5 | 5 |
| # isolates | 925 | 921 | # isolates | N/A | N/A |
| # ASTs | 5118 | 2683 | # ASTs | N/A | N/A |
| # S | # I | # R | 3576 | 98 | 1444 | 2187 | 123 | 373 | # S | # I | # R | N/A | N/A |
|
|
| ||||
| Estimate | 96.9% | 88.5% | Median | 97.4% | 86.7% |
| 95% CI | 96.3%–97.3% | 87.2%–89.6% | IQR | 95.3%–99.5% | 85.6%–90.9% |
|
|
| ||||
| Estimate | 1.4% | 4.6% | Median | 0.0% | 2.9% |
| 95% CI | 0.90%–2.1% | 2.9%–7.2% | IQR | 0.0%–2.8% | 0.0%–7.7% |
|
|
| ||||
| Estimate | 0.8% | 1.0% | Median | 0.4% | 1.3% |
| 95% CI | 0.5%–1.1% | 0.6%–1.5% | IQR | 0.0%–0.8% | 0.0%–3.2% |
|
|
| ||||
| Estimate | 2.2% | 10.1% | Median | 1.0% | 8.7% |
| 95% CI | 1.8%–2.7% | 9.0%–1.3% | IQR | 0.0%–3.1% | 3.8%–11.5% |
| Panel | Species | Drug | Categorical | Very major error rate | Major error | Minor error |
|---|---|---|---|---|---|---|
| Qualified Panel |
| Tetracycline | 97.5% | 2.0% | 0.0% | 1.3% |
|
| Ampicillin | 94.6% | 0.0% | 0.0% | 5.4% | |
| Ceftriaxone | 98.8% | 0.0% | 0.4% | 0.9% | ||
| Ciprofloxacin | 90.9% | 2.2% | 0.5% | 7.9% | ||
| Gentamicin | 96.3% | 0.0% | 0.4% | 3.4% | ||
| Levofloxacin | 94.9% | 0.8% | 0.0% | 4.8% | ||
| Tobramycin | 96.4% | 4.9% | 0.4% | 2.7% | ||
| Trimethoprim/sulfamethoxazole | 96.7% | 4.6% | 2.7% | 0.0% | ||
|
| Ceftriaxone | 99.0% | 0.0% | 0.0% | 1.0% | |
| Gentamicin | 98.0% | 7.7% | 0.0% | 1.0% | ||
| Tobramycin | 94.2% | 0.0% | 1.2% | 4.8% | ||
| Trimethoprim/sulfamethoxazole | 92.3% | 5.3% | 8.2% | 0.0% | ||
|
| Ampicillin | 95.5% | 6.7% | 0.0% | 2.3% | |
| Ciprofloxacin | 100.0% | 0.0% | 0.0% | 0.0% | ||
| Levofloxacin | 95.5% | 0.0% | 0.0% | 4.5% | ||
|
| Clindamycin | 97.9% | 1.8% | 2.2% | 0.0% | |
| Erythromycin | 97.4% | 0.0% | 1.0% | 2.1% | ||
| Levofloxacin | 99.5% | 0.0% | 0.8% | 0.0% | ||
| Oxacillin | 99.5% | 0.0% | 0.8% | 0.0% | ||
| Tetracycline | 99.5% | 0.0% | 0.6% | 0.0% | ||
|
| Clindamycin | 90.9% | 5.0% | 7.7% | 3.0% | |
| Levofloxacin | 100.0% | 0.0% | 0.0% | 0.0% | ||
| Oxacillin | 100.0% | 0.0% | 0.0% | 0.0% | ||
| Trimethoprim/sulfamethoxazole | 100.0% | 0.0% | 0.0% | 0.0% | ||
| R&D Stage Panel |
| Ampicillin/sulbactam | 78.2% | 0.0% | 3.2% | 20.2% |
| Cefepime | 86.7% | 2.9% | 1.6% | 11.5% | ||
|
| Ampicillin/sulbactam | 85.6% | 12.5% | 1.3% | 10.6% | |
| Cefepime | 85.6% | 0.0% | 3.4% | 11.5% | ||
| Ciprofloxacin | 95.2% | 4.2% | 0.0% | 3.8% | ||
| Levofloxacin | 90.4% | 7.7% | 0.0% | 8.7% | ||
|
| Trimethoprim/sulfamethoxazole | 90.9% | 0.0% | 15.4% | 0.0% | |
|
| Ciprofloxacin | 86.1% | 46.7% | 0.0% | 5.1% | |
|
| Trimethoprim/sulfamethoxazole | 99.0% | 0.0% | 1.1% | 0.0% |
| AST phenotype | Resistance marker(s) present | Resistance marker concordance with phenotype | # Predictions | Keynome | Keynome | Keynome |
|---|---|---|---|---|---|---|
| R | True | Concordant | 1,219 | 93.4% | N/A | 1.1% |
| False | Discordant | 267 | 92.5% | N/A | 5.2% | |
| I | True | Concordant | 83 | 81.9% | N/A | N/A |
| False | Discordant | 68 | 58.8% | N/A | N/A | |
| S | True | Discordant | 744 | 89.7% | 2.69% | N/A |
| False | Concordant | 4,172 | 96.98% | 0.072% | N/A |
- —Combating Antibiotic-Resistant Bacteria Biopharmaceutical Acceleratorhttp://dx.doi.org/10.13039/100019590
Peer Reviews
No public reviews on file for this paper yet. If you reviewed it on a platform where reviews are public (OpenReview, ICLR, NeurIPS, ICML), you can paste yours below so the community can read it here.
Videos
No videos yet. Explain this paper in a talk, walkthrough, or lecture? Add one.
Taxonomy
TopicsBacterial Identification and Susceptibility Testing · Antimicrobial Resistance in Staphylococcus · Antibiotic Resistance in Bacteria
INTRODUCTION
Using next-generation sequencing (NGS) of microbial genomes to infer the antimicrobial susceptibility test (AST) profile of an infecting pathogen offers a powerful opportunity to improve current infectious disease diagnostics. While the potential for NGS to provide faster results than current standard-of-care AST diagnostics and to thereby reduce the time to appropriate antibiotics has been recognized for over a decade (1, 2), there are currently no FDA approved NGS-based AST diagnostics. A major obstacle for clinical-grade diagnostics is the algorithmic challenge of genomic AST: reliably determining the phenotypic antimicrobial resistance pattern from the microbial genomic data for a comprehensive set of species and drugs. Traditional bioinformatics methods for performing genomic AST rely almost exclusively on the detection of known resistance markers annotated in published resistance marker databases (3–6), such that the simple presence of any markers in a pathogen genome predicts a non-susceptible phenotype. These databases are limited both by the extent and depth of investigation that has been conducted by the scientific community, often using focal data sets, and the challenge of hand curation of the results into a structured, standardized database (7). Moreover, such resistance marker approaches fall short in cases of complex multi-locus mechanisms where determining the presence or absence of a resistance marker is insufficient. They can provide false negative results if the database lacks determinants of resistance that are currently unknown or uncharacterized and, conversely, can provide false positive results if a resistance gene is present but not expressed or is insufficient to confer resistance alone. Lastly, they cannot distinguish between intermediate and resistant AST phenotypes, limiting their applicability in clinical contexts.
Machine learning (ML) methods offer a promising, conceptually distinct alternative to traditional genomic AST determination (8). In this approach, an algorithm is trained on a data set comprising the whole genome sequencing (WGS) data of clinically relevant pathogens matched to their phenotypically derived AST results to learn the genomic associations predictive of resistance and susceptibility. The use of ML to perform genomic AST presents multiple advantages over the traditional resistance marker approach: (1) the model can discover regions in the genome that are predictive of AST rather than being constrained to only previously annotated markers; (2) complex, nonlinear interactions can be captured by the model where simple presence/absence is insufficient, and (3) the model can predict susceptible (S), intermediate (I), and resistant (R) phenotypes using a large-scale data-driven approach to learn how to distinguish between signatures associated with each phenotype from the entirety of the genome. Various ML methods for genomic AST have been developed to date (9–13) though most do not distinguish between intermediate and resistant phenotypes.
In this study, we assessed Keynome gAST (genomic AST), an ML system that predicts S, I, and R AST phenotypes from pathogen WGS data. We trained Keynome gAST on a large-scale data set containing the WGS data of >40,000 bacterial isolates paired with their corresponding phenotypic AST results. We evaluated Keynome gAST accuracy on a separate test set of nearly 1,000 clinical bacterial isolates from the UC Irvine Medical Center collected over 3 months, comparing Keynome gAST predictions to the phenotypic AST results from routine care in the hospital lab. We further compared Keynome gAST performance to a traditional resistance marker approach (ResFinder).
MATERIALS AND METHODS
Isolate collection, phenotyping, and WGS
The University of California Irvine (UCI) Microbiology Lab collected a total of 1,536 clinical bacterial isolates previously processed for routine clinical care from patients treated in the Emergency Department or inpatient units between 4/20/2023-8/12/2023. In the final test data set (see Test Set Data Exclusion below), 39.5% of isolates were from patients seen in the Emergency Department, 23.5% from surgical inpatient units, 7.1% non-surgical ICU units, and 29.3% from various other units (oncology, labor and delivery, neuro, etc). The UCI Microbiology Lab performed phenotypic testing using routine procedures. Species identification was performed using MALDI-TOF (Vitek MS v3 with MYLA v4.5, bioMérieux, Marcy l'Etoile, France) or Vitek 2 (bioMérieux) if MALDI-TOF was unable to identify the isolate. Phenotypic AST was performed using Vitek 2 (bioMérieux), except for Streptococcus agalactiae and Streptococcus pneumoniae which were tested by Kirby-Bauer (Becton Dickinson, Sparks, MD), Etest (bioMérieux), and MTS (Liofilchem, Roseto degli Abruzzi, TE, Italy). Day Zero Diagnostics (DZD) re-interpreted all raw Minimum Inhibitory Concentration (MIC)/disk diameter values to S/I/R categories using CLSI M100 (32nd edition) where possible. If there were multiple breakpoints for different indications, parenteral breakpoints or those most relevant to bloodstream infections were preferentially selected.
Isolates were collected from purity or subculture plates and then shipped to DZD, where they were processed for short-read WGS. Genomic DNA was isolated using organic aqueous-phase, bead-beating, crude extraction followed by a QIAamp 96 DNA QIAcube HT Kit (Qiagen, Venlo, Netherlands) purification. Sequencing libraries were prepared with Nextera tagmentation (Illumina, San Diego, CA) using unique, dual-indexed primers and 2 × 150 bp paired-end reads sequencing was performed on Illumina HiSeqX or NovaSeqX by the commercial provider Psomagen (Rockville, MD).
Bioinformatics processing
Illumina paired end sequencing data underwent quality and adapter trimming using Trimmomatic v0.38. Taxonomic identification was performed using Kraken v1.1.1 and a custom reference database. K-mers (subsequences of integer length k) of length 20 were derived from sequencing reads and used for clonality assessment and for generating machine learning model features. A depth-based analysis was used to exclude low-confidence k-mers (e.g., sequencing errors) and k-mer presence/absence vectors were generated for each sample. Genome assemblies were generated independently from trimmed reads using shovill (14). Multi-Locus sequence typing (MLST) from assemblies was determined with ARIBA v2.14.6 and MLST definitions obtained from PubMLST (15).
To provide a comparison to traditional resistance marker detection strategies, the tool ResFinder (ResFinder/PointFinder v4.3.0; ResFinder database v2.1.0; PointFinder mutation database v3.0.0) was used to identify resistance markers in genome assemblies and to infer resistance phenotype (3). Default parameters were used for both ResFinder and PointFinder; PointFinder output was merged with ResFinder output via a custom script. ResFinder’s built-in logic predicts “Resistant” for a drug if a relevant gene or point mutation was detected (which we interpreted as non-susceptible), otherwise “Not Resistant” (which we interpreted as susceptible). ResFinder’s database is species-agnostic, as are its phenotypic predictions based on presence/absence genes. The PointFinder point mutation databases are taxa-specific, including E. faecalis, E. faecium, E. coli, Klebsiella, and S. aureus. An antibiotic was considered covered by ResFinder/PointFinder if it or its drug class (e.g., quinolone) was included at least once in database annotations. 14 of the 97 species-drug combinations analyzed by Keynome gAST in this data set were considered not covered by ResFinder, corresponding to the drugs trimethoprim/sulfamethoxazole and ampicillin/sulbactam.
Test set data exclusion
Isolates were excluded if the phenotypic AST or genomic sequencing data did not meet quality control (QC) criteria, including failed sequencing data checks for species identity and contamination, sequencing quality, and assembly quality (see Supplementary Methods). Isolates from the test data set that were determined to be clonal with any from the training data set, identified based on genomic relatedness (measured using a k-mer based similarity method; Supplementary Methods), were also excluded. Finally, isolates that lacked relevant phenotypic AST for any species-drug combinations on the Keynome gAST panels were also excluded from the test data set. A total of 956 isolates passed all QC metrics and were used in the remainder of the study.
Machine learning methods
The Keynome gAST system is a set of machine learning models, one for each relevant species-drug combination, that are trained to learn microbial genomic features predictive of AST phenotype in an unbiased fashion. Briefly, these supervised learning models are trained to predict AST results—in the form of susceptible (S), intermediate (I), or resistant (R) categories—from short read WGS sequencing data inputs featurized via k-mers. The model for each species-drug combination assessed was assigned to either the “Qualified” or “R&D Stage” panel based on an internal assessment of model performance. More detailed information on training data set, model architecture, training procedure, and panel definitions can be found in the Supplementary Methods.
Based on these criteria, the Keynome gAST (v0.7.5.0) release used in this study comprised 70 species-drug combinations in the Qualified panel and 74 species-drug combinations in the R&D Stage panel. Insufficient training data set size was a significant factor limiting model accuracy and preventing their inclusion in the Qualified panel; >80% of R&D Stage models had <500 resistant or susceptible samples in the training data set.
Data analysis
Keynome gAST predictions were assessed wherever both predictions and phenotypes were available. Though 144 species-drug combinations were available from both Keynome gAST panels, only those with at least one isolate in the test data set with a relevant phenotypic AST result were assessed. Conversely, any phenotypic AST results without matching Keynome gAST predictions were not evaluated.
Accuracy metrics were computed both in aggregate, combining all predictions across all species-drug combinations, and individually, for each species-drug combination tested. Genomic AST predictions were compared to phenotypic AST measurements to assess accuracy, using the following metrics:
Categorical agreement (CA): Percent of genomic AST predictions that agreed with the phenotypic AST results (in terms of interpretive category: S/I/R).Very major error (vME) rate: Percent of phenotypically R cases with an incorrect genomic AST prediction of S.Major error (ME) rate: Percent of phenotypically S cases with an incorrect genomic AST prediction of R.Minor error (mE) rate: Percent of cases with an incorrect genomic AST prediction where either the phenotypic AST or the genomic AST prediction is I.
For an analysis of resistance marker-based predictions and direct comparison to those from Keynome gAST, intermediate and resistant ground truth phenotypes and predictions were grouped into a joint non-susceptible (NS) category, and performance metrics were calculated as follows:
Binary accuracy: Percent of genomic AST predictions that agreed with the phenotypic AST results (at the level of binary prediction: S/NS)Sensitivity: Percent of phenotypically NS cases with a correct genomic AST prediction of NS.Specificity: Percent of phenotypically S cases with a correct genomic AST prediction of S.Positive predictive value (PPV): Percent of cases with a genomic AST prediction of NS that are phenotypically NS.Negative predictive value (NPV): Percent of cases with a genomic AST prediction of S that are phenotypically S.
Positive predictive value (PPV) was also calculated for each individual resistance marker and marker combination detected in a given species-drug data set, restricted to those found in at least 10 isolates across the entire data set. PPV is equal to the percent of samples in which the marker was detected that are phenotypically NS.
Binomial proportion confidence intervals (CIs, Wilson score interval) for all the above metrics are reported at the 95% confidence level. Statistical significance of performance differences between Keynome gAST and ResFinder was evaluated using McNemar’s test with false discovery rate correction for each metric analyzed (Benjamini-Hochberg correction, α = 0.05). A two-tailed binomial test (α = 0.05) was used to determine if a given CA or ME rate was statistically above/below and the corresponding FDA thresholds of 90%/3%, respectively. For the vME rate, the FDA criteria directly specify an upper bound on the upper/lower 95% confidence interval bounds of 1.5%/7.5%. The 95% vME rate confidence interval was compared directly to these bounds, and the test was deemed inconclusive if the measured confidence interval contained the target FDA confidence interval.
RESULTS
Of the isolates collected at the UCI Medical Center, 956 met the requirements for inclusion in the test data set for this study. WGS data from the isolates were processed by Keynome gAST, with phenotypic AST results available for 52 species-drug combinations from the Qualified panel and 45 species-drug combinations from the R&D Stage panel. Keynome gAST predicted 7,801 AST results across 18 distinct species and 23 distinct drugs (Fig. 1; Table 1; Table S1). Representation by species was strongly biased toward a small number of species, with the top three species*—E. coli*, S. aureus, and K. pneumoniae—comprising roughly two-thirds of the data set (65.7%), while many other species were only represented by a small number of samples; e.g., S. agalactiae (n = 1), S. pneumoniae (n = 2), and S. lugdunensis (n = 3).
Experiment outline. (a) UCI collected bacterial isolates from routine care and shipped them to Day Zero Diagnostics. Isolates were sequenced and then processed with Keynome gAST, a ML system for genomic AST that predicts S/I/R phenotype for relevant drugs. Predicted ASTs were compared to phenotypic AST obtained in the clinical microbiology laboratory at UCI. (b) Keynome gAST underwent training prior to the assessment. After model training, internal accuracy assessment categorized each model as Qualified or R&D Stage. The models and Qualified/R&D Stage panels were frozen in a versioned release.
In aggregate across the entire data set, the Keynome gAST Qualified panel displayed categorical agreement (CA) of 96.9% (Table 2). Major error (ME, phenotypic S predicted as R) and very major error (vME, phenotypic R predicted as S) rates were <2% with the majority of errors being minor errors (mE, any error with prediction or phenotype of I). Notably, these aggregate accuracy metrics would meet the FDA criteria (16) for phenotypic AST systems of CA > 90%, mE rate <3%, and vME rate <1.5%–7.5% (CA, mE rate: binomial test, ɑ = 0.05; vME rate: 95% confidence interval thresholds). The R&D Stage panel had expectedly lower aggregate accuracy, with CA of 88.5% and ME/vME rates < 5%, again with most errors being mEs, and would not meet the FDA criteria due to higher vME and mE rates.
We examined the performance of Keynome gAST on individual species-drug combinations with sufficient data set size for meaningful evaluation. On species-drug combinations with at least 10 R and 10 S samples, the Qualified panel had a median CA of 97.4% (IQR: 95.3%–99.5%), while the R&D Stage panel had a median CA 86.7% (IQR: 85.6%–90.9%) ([Tables 2 and 3](#T2 T3); Fig. 2a). Comparing performance at the species-drug level to the FDA criteria, a small number of combinations would pass (3 from the Qualified panel) or fail (5 from the Qualified panel, 10 from the R&D Stage panel), but the large majority (81.4%, 79/97) have insufficient data set sizes to make a conclusion with statistical significance (Table S2). Looking only at CA, where the sample sizes are largest due to including both R and S samples, all Qualified panel combinations that achieved statistical significance passed the >90% threshold (22 of 52 species-drugs); for the 45 R&D Stage combinations, 3 pass and 6 fail (with the remainder not reaching statistical significance).
Keynome gAST performance. (a) Keynome gAST per model performance metrics across the 33 of 97 species-drugs with at least 10 R and 10 S samples in the test data set. Boxes represent interquartile range, the line within the box represents the median, and whiskers represent range of all data points. (b) Keynome gAST categorical agreement aggregated across Qualified models by species group and drug class with at least 10 R and 10 S samples. Error bars represent 95% binomial proportion confidence intervals.
To strike a balance between sample size and the level of similarity among aggregated samples, we also assessed performance at a mid-level of aggregation by grouping both species and drugs into clinically relevant classes (Fig. 2b; Table S3). At this level of analysis over half (13/23) of combinations on the Qualified panel met the FDA > 90% CA criterion and none failed, with the rest still having sample sizes too small to make a statistically significant determination.
We compared the prediction accuracy of Keynome gAST with that of a resistance marker approach, ResFinder. We restricted the analysis to the 83 of 97 species-drug combinations where ResFinder has annotations for relevant markers, comprising 947 isolates with 6,553 ASTs (Table S4). Since ResFinder does not distinguish intermediate from resistance phenotypes, we grouped intermediate and resistant AST phenotypes and predictions into a non-susceptible (NS) category. On this binary S/NS task, Keynome gAST achieved 96.0% aggregate accuracy, significantly outperforming ResFinder’s 83.5% (a 12.5 percentage point difference; P < 0.001, McNemar’s test). This performance gap was also evident across major drug and species classes (Fig. 3a; Table S5), including significant differences in: Enterobacterales/carbapenem (P < 0.001), cephem (P < 0.001), and fluoroquinolone (P < 0.001); Enterococcus/fluoroquinolone (P = 0.003); Pseudomonas/fluoroquinolone (P < 0.001); Staphylococcus/fluoroquinolone (P < 0.001).
Keynome gAST vs ResFinder performance. (a) Keynome gAST and ResFinder binary accuracy aggregated across models within the same species group and drug class with at least 10 R and 10 S samples in the test data set. Error bars represent 95% binomial proportion confidence intervals. (b) Per model S/NS binary accuracy of Keynome gAST and ResFinder across the 26 of 83 species-drugs with at least 10 R and 10 S samples in the test data set and predictions from both methods. Boxes represent interquartile range, the line within the box represents the median, and whiskers represent range of all data points. (c) Per model sensitivity and specificity trade-off of Keynome gAST and ResFinder across the same set of species-drugs shown in (b).
Evaluating the individual species-drug combinations (for those with at least 10 S and R samples), the median binary accuracy of Keynome gAST (98.0%) was comparable to ResFinder (96.1%). However, ResFinder’s performance was far more variable (IQR: 50.1%–99.0%) than Keynome gAST’s (IQR: 95.7%–99.5%), with many combinations performing at or near chance (50% accuracy) (Fig. 3b). This variability stemmed from a stark trade-off in ResFinder between sensitivity and specificity, with one metric high while the other is low, a phenomenon Keynome gAST largely avoided (Fig. 3c).
This trade-off between sensitivity and specificity is a consequence of ResFinder’s database-driven method. Low sensitivity arose from an incomplete marker database, particularly for fluoroquinolones due to a systematic lack of point mutations annotated as relevant to levofloxacin. Conversely, low specificity resulted from the inclusion in the database of markers with low positive predictive value (PPV), whose presence did not reliably confer a non-susceptible phenotype.
Many markers had a PPV between 0% and 50% (Fig. 4a; Table S6), driving down specificity. Examples of such low-PPV markers include particular mutations in the K. pneumoniae outer membrane porins ompK36 and ompK37 linked by ResFinder to beta-lactam resistance (Fig. 4b, upper panel); and a variety of markers linked to ciprofloxacin resistance in Gram-negative species, such as certain mutations in DNA gyrase and topoisomerase genes (gyrA, parE) (17) (Fig. 4b, lower panel), mutations in the efflux pump repressor gene AcrR (18, 19), efflux pump genes (OqxA/B) (20), and the Pseudomonas ciprofloxacin-modifying enzyme crpP (21, 22). Although many of these markers are known to be insufficient for causing resistance on their own, ResFinder’s rigid approach predicts non-susceptibility based on the presence of any single marker. While using marker combinations could theoretically improve accuracy, this approach is practically challenging due to the vast number of combinations and their variable predictive values (Fig. S1; Table S7).
Resistance marker limitations analysis. (a) Histogram of positive predictive value (PPV) of individual ResFinder resistance markers. PPV was computed for each marker in each relevant species-drug, restricted to resistance marker combinations found in at least 10 samples in the species-drug data set. (b) Upper: Keynome gAST and ResFinder predictions on the K. pneumoniae—cefepime data set. ResFinder exhibited 0% specificity due to ubiquitous presence of ompK porin gene mutations in susceptible samples. Lower: Keynome gAST and ResFinder predictions on the E. coli—ciprofloxacin data set. ResFinder exhibited a specificity of 72.2% due to the high number of annotated mutations in DNA gyrase and topoisomerase genes gyrA and parE in susceptible samples. (c) The presence of resistance markers as determined by ResFinder in phenotypically susceptible (S), intermediate (I), and resistant (R) samples; percent of all isolate-drug combinations with or without a marker is shown for each phenotypic group.
The inflexibility of this marker-based approach is highlighted by the discordance between phenotypes and marker presence. ResFinder detected a resistance marker in only 82.0% of resistant and 55.0% of intermediate isolates, while detecting markers in 15.1% of susceptible isolates (Fig. 4c). Keynome gAST performance was notably better when the phenotype was concordant with resistance marker presence or absence but still had reliable performance in the discordant cases (Table 4). For instance, its vME rate was 1.1% on concordant samples and 5.2% on discordant samples. By its nature, ResFinder is unable to resolve these discordant cases and cannot make intermediate predictions.
DISCUSSION
In this study, we assessed the performance of Keynome gAST, a machine learning genomic AST system, on a clinically representative collection of over 900 bacterial isolates with over 7,000 ground truth AST results from a single US medical center. Across the entire data set, the Keynome gAST Qualified panel achieved >96% categorical agreement (CA), with very major error (vME; phenotypic R predicted as S) rate 1.4%, and major error (ME; phenotypic S predicted as R) rate 0.8% (Table 2; Fig. 2). Across individual species-drug combinations with suitable representation in the data set (≥10 R and ≥10 S samples), performance of this panel was consistently high, with a median categorical agreement of 97.4%. The Keynome gAST R&D Stage panel demonstrated expectedly lower performance, driven by increases in both very major error and minor error rates.
We also compared Keynome gAST to ResFinder, a baseline resistance marker approach, using a susceptible/non-susceptible binary prediction task. Across the full data set, Keynome gAST performed significantly better than ResFinder, with an overall accuracy of 96.0% compared to 83.5%. When investigated at the level of individual species-drug combinations, this difference was attributed to ResFinder frequently making poor sensitivity/specificity trade-offs (Fig. 3c). This was driven by the presence of resistance markers that were insufficient to imply resistance (low specificity) or a lack of relevant markers annotated for a particular combination (low sensitivity). Across the full data set, ResFinder detected a resistance marker in 15.1% of phenotypically susceptible samples and failed to detect a resistance marker in 18.0% of phenotypically resistant samples (Fig. 4c). In contrast, Keynome gAST still achieved good performance on both phenotypically susceptible samples with a marker (89.7% CA, 2.7% ME rate) and phenotypically resistant samples without a marker (92.5% CA, 5.2% vME rate; Table 4).
While ResFinder is an invaluable tool for understanding determinants of resistance in a research setting, its predictive logic—classifying an isolate as resistant if any single marker is detected—is too simplistic for many cases of more complex resistance mechanisms. A more robust strategy for genomic AST involves assessing combinations of resistance markers (Table S7). However, such an approach is challenging due to the combinatorial explosion of possible cases, and hand-designing rule sets requires deep expertise resulting in solutions siloed by species (23–27).
Alternatively, machine learning (ML) offers a flexible, data-driven approach for genomic AST prediction capable of learning complex resistance mechanisms by incorporating interactions between genetic loci. Furthermore, an ML approach such as Keynome gAST need not be constrained to relying on known resistance markers, which are limited by previous scientific characterization and database curation. Instead, it can flexibly characterize the entire genome in order to discover the most predictive features de novo for each species-drug combination. ML genomic AST solutions have been investigated (28–33), but unfortunately, no comprehensive models are readily available at this time. For these reasons, users frequently default to tools like ResFinder for genomic AST predictions despite their limitations. It is also important to note that ResFinder only explicitly supports a subset of the species in the data set (78% of isolates), but a similar analysis restricted to these species-drug pairs yielded similar qualitative conclusions (see Fig. S2 and S3; Methods).
Other ML methods for genomic AST have been developed that vary in terms of featurization of the WGS data, ML model, training algorithm, and prediction targets and have been thoroughly reviewed elsewhere (8, 34). Most ML genomic AST methods predict categorical AST, though predicting MIC is an area of active investigation with some promising results on limited species (33, 35–37). There are other categorical genomic AST prediction methods similar to Keynome gAST that also employ k-mers as input features for boosted regression and classification trees (9–13) though Keynome gAST differs from these approaches in two key ways. First, it predicts intermediate and resistant phenotypes separately, as opposed to a combined non-susceptible phenotype. Second, it was trained on an expansive and highly curated data set which contained 418,218 AST measurements from 42,976 unique isolates, spanning 265 species-drug combinations across 24 distinct species. While many studies use training data based exclusively from public aggregators such as BV-BRC or NDARO (33, 38) and/or focus on only a single pathogen species (39, 40), almost 2/3 of the ASTs in the Keynome gAST training data set were generated through sourcing from clinical collaborators and biobanks, targeting breadth and diversity of clinically important pathogens, with all samples undergoing extensive quality control and data harmonization.
In this assessment of Keynome gAST, the composition of the test data set is both a strength and a weakness. As isolates were broadly collected across departments within a single clinical site over a relatively short timeframe, the collection is naturally representative of what would be encountered in this clinically relevant setting—in terms of species, drugs tested, and AST phenotypes observed—and aggregate performance results can be interpreted in this light. However, this also means that the species and phenotypes represented are strongly biased toward those most often encountered in this particular setting and aggregate performance measures are correspondingly biased toward those combinations. In spite of this, we found a high level of within-species heterogeneity with a diversity of sequence types represented for the most common species (Fig. S4; Table S8). Other limitations of the data set include a general lack of challenging genotypes and/or phenotypes (only 26.1% overall non-susceptible) and the reliance of a non-gold-standard reference method (Vitek 2) for ground truth phenotypic AST (41, 42).
An important aspect when considering the clinical utility of genomic AST systems such as Keynome gAST is the ability to be integrated into systems that operate directly from clinical samples. While this study applied genomic AST to sequenced isolated strains, it would be more impactful to integrate the method with direct-from-sample pathogen DNA enrichment and sequencing, thereby enabling rapid predictive AST to guide therapeutic selection in hours rather than days by bypassing the need for traditional culturing and subculturing. Recent work, such as references 43, 44, and 45, have begun to demonstrate the feasibility of applying Keynome gAST along with other bioinformatics pipelines directly to sequenced bloodstream and respiratory samples.
One future direction of this work is improving the breadth and accuracy of Keynome gAST to expand the representation of clinically significant species-drug combinations on the Qualified panel. Particularly notable omissions include vancomycin for many gram positive species and beta-lactam/inhibitor combination therapies for gram negative species. Some of the missing species-drug combinations currently lack sufficiently large training data sets, particularly for rare resistant phenotypes (e.g., S. aureus/vancomycin), suggesting that improved performance may result from data sourcing. Other cases, such as many of the beta-lactam/inhibitor combination therapies, currently do not meet internal testing thresholds to qualify for the Keynome gAST panels. These combinations have proven challenging even with larger data sets, indicating that the method may require further innovations in the machine learning models or in additional genomic features such as gene copy number (46).
In summary, this study demonstrates the feasibility of a genomic AST ML system to provide high accuracy and extensive AST profiles on a wide set of species and drugs representative of those encountered in a US clinical microbiology lab.
The reference list from the paper itself. Each links out to its DOI / PubMed record.
- 1Didelot X, Bowden R, Wilson DJ, Peto TEA, Crook DW. 2012. Transforming clinical microbiology with bacterial genome sequencing. Nat Rev Genet 13:601–612. doi:10.1038/nrg 322622868263 PMC 5049685 · doi ↗ · pubmed ↗
- 2Zankari E, Hasman H, Kaas RS, Seyfarth AM, Agersø Y, Lund O, Larsen MV, Aarestrup FM. 2013. Genotyping using whole-genome sequencing is a realistic alternative to surveillance based on phenotypic antimicrobial susceptibility testing. J Antimicrob Chemother 68:771–777. doi:10.1093/jac/dks 49623233485 · doi ↗ · pubmed ↗
- 3Bortolaia V, Kaas RS, Ruppe E, Roberts MC, Schwarz S, Cattoir V, Philippon A, Allesoe RL, Rebelo AR, Florensa AF, et al.. 2020. Res Finder 4.0 for predictions of phenotypes from genotypes. J Antimicrob Chemother 75:3491–3500. doi:10.1093/jac/dkaa 34532780112 PMC 7662176 · doi ↗ · pubmed ↗
- 4Feldgarden M, Brover V, Gonzalez-Escalona N, Frye JG, Haendiges J, Haft DH, Hoffmann M, Pettengill JB, Prasad AB, Tillman GE, Tyson GH, Klimke W. 2021. AMR Finder Plus and the reference gene catalog facilitate examination of the genomic links among antimicrobial resistance, stress response, and virulence. Sci Rep 11:12728. doi:10.1038/s 41598-021-91456-034135355 PMC 8208984 · doi ↗ · pubmed ↗
- 5Alcock BP, Huynh W, Chalil R, Smith KW, Raphenya AR, Wlodarski MA, Edalatmand A, Petkau A, Syed SA, Tsang KK, et al.. 2023. CARD 2023: expanded curation, support for machine learning, and resistome prediction at the comprehensive antibiotic resistance database. Nucleic Acids Res 51:D 690–D 699. doi:10.1093/nar/gkac 92036263822 PMC 9825576 · doi ↗ · pubmed ↗
- 6Gupta SK, Padmanabhan BR, Diene SM, Lopez-Rojas R, Kempf M, Landraud L, Rolain J-M. 2014. ARG-ANNOT, a new bioinformatic tool to discover antibiotic resistance genes in bacterial genomes. Antimicrob Agents Chemother 58:212–220. doi:10.1128/AAC.01310-1324145532 PMC 3910750 · doi ↗ · pubmed ↗
- 7Papp M, Solymosi N. 2022. Review and comparison of antimicrobial resistance gene databases. Antibiotics (Basel) 11:339. doi:10.3390/antibiotics 1103033935326803 PMC 8944830 · doi ↗ · pubmed ↗
- 8Kim JI, Maguire F, Tsang KK, Gouliouris T, Peacock SJ, Mc Allister TA, Mc Arthur AG, Beiko RG. 2022. Machine learning for antimicrobial resistance prediction: current practice, limitations, and clinical perspective. Clin Microbiol Rev 35:e 0017921. doi:10.1128/cmr.00179-2135612324 PMC 9491192 · doi ↗ · pubmed ↗