Yeast enzyme hydrolysis slurry supplementation improves growth, intestinal health, and metabolic responses in juvenile largemouth bass (Micropterus salmoides) fed soybean meal-based diets with partial fishmeal replacement
Jun Wen, Xinpeng Wang, Haiqing Wu, Chuyi Cui, Qianyu Zhou, Xue Fu, Shuqing Shen, Shunying Xiao, Yongjun Chen, Shimei Lin, Qinghui Ai, Guangjun Lv, Yuanfa He

TL;DR
Adding yeast enzyme hydrolysis slurry to fish diets improves growth and gut health in largemouth bass by enhancing digestion and reducing harmful bacteria.
Contribution
This study demonstrates the effectiveness of yeast enzyme hydrolysis slurry in improving fish health and growth when replacing fishmeal with soybean meal.
Findings
YS supplementation increased growth rates and digestive enzyme activities in largemouth bass.
YS reduced harmful gut bacteria and improved antioxidant defenses in fish.
Metabolomics showed enhanced amino acid metabolism and protein digestion with YS.
Abstract
Yeast enzyme hydrolysis slurry (YS) has the potential to optimize feed utilization efficiency and improve the health of farmed animals, as it contains abundant bioactive components like small-molecule peptides and amino acids. However, its function and application effects in juvenile largemouth bass (Micropterus salmoides) are unclear. Three hundred and twenty largemouth bass (8.20 ± 0.05 g) were randomly divided into four groups (4 replicates of 20 fish). Four isonitrogenous (52%) and isolipidic (10%) diets were formulated: FM group (positive control), SBM group (soybean meal replaced 30% of fish meal protein, negative control), and the SBM group supplemented with 1% YS (SBM + 1% YS) and 2% YS (SBM + 2% YS), respectively. After a 56-day feeding period, the fish were assessed for growth, intestinal health, and metabolic regulation-related indices. Our study found that weight gain rate…
Genes, proteins, chemicals, diseases, species, mutations and cell lines named across the full text — each resolved to its canonical identifier and authoritative record.
Click any figure to enlarge with its caption.
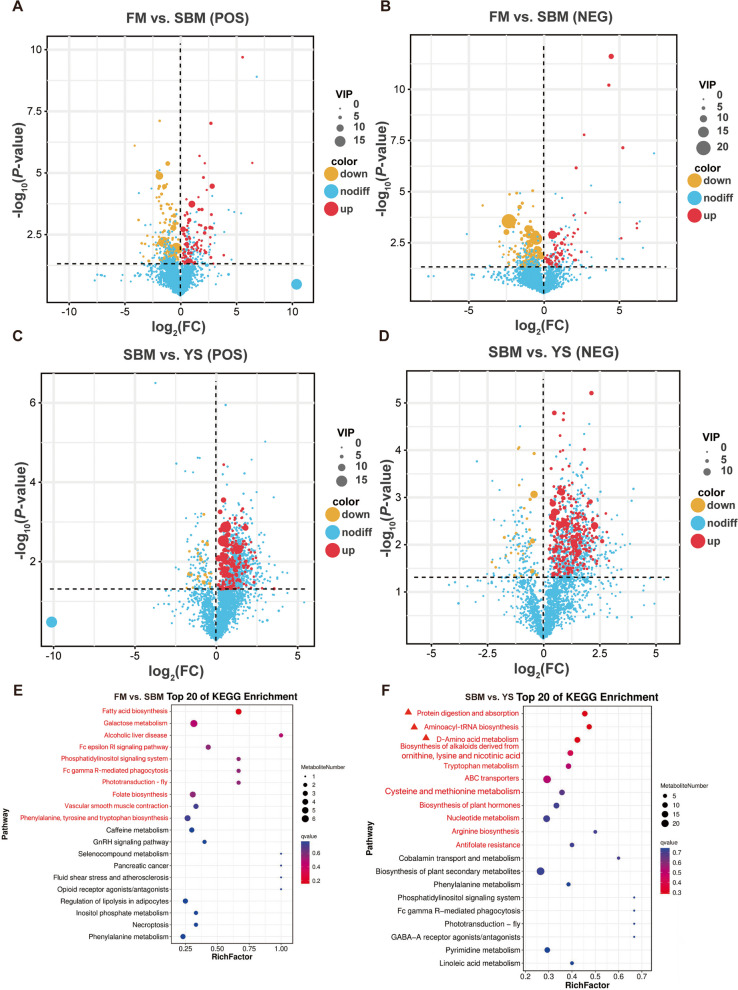 Figure 10
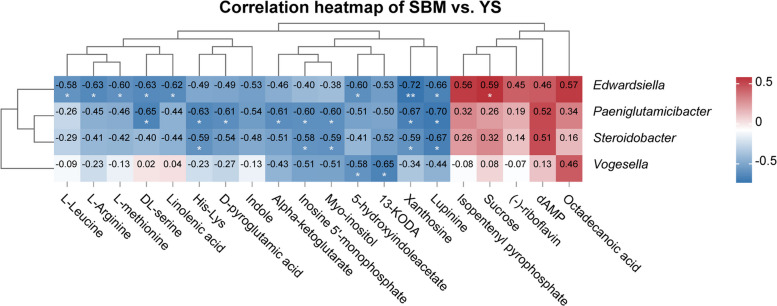 Figure 11
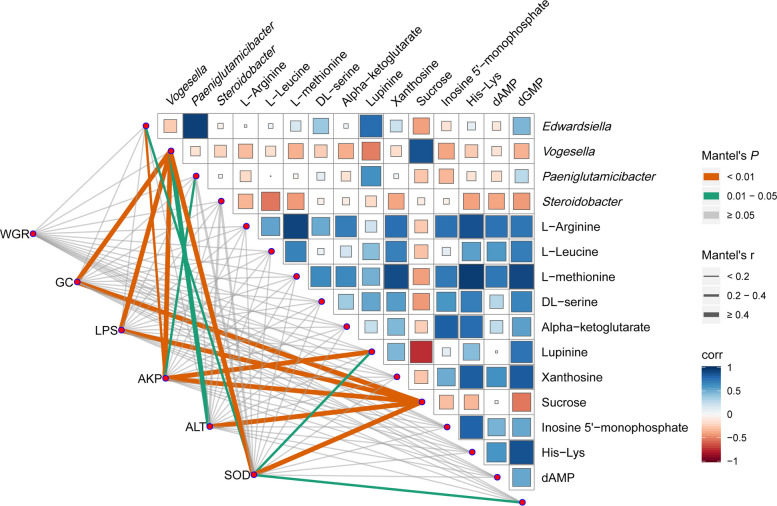 Figure 12
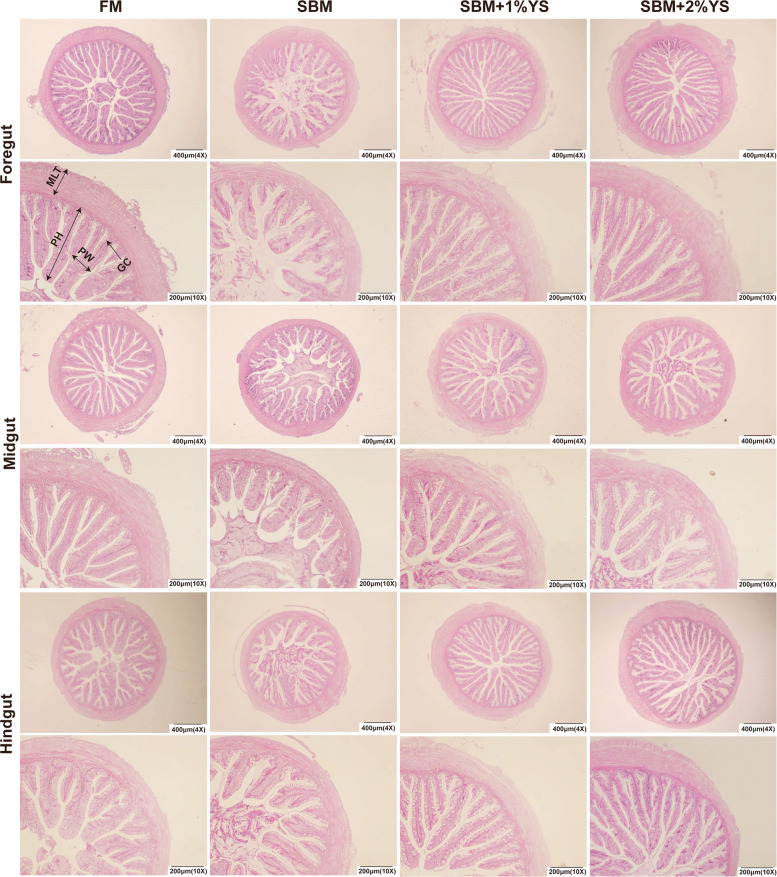 Figure 1
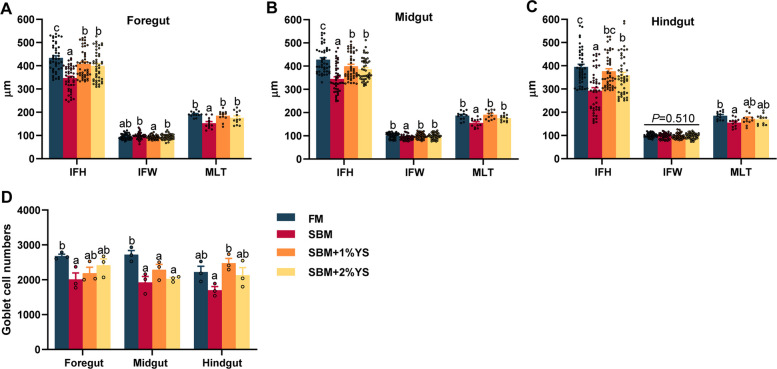 Figure 2
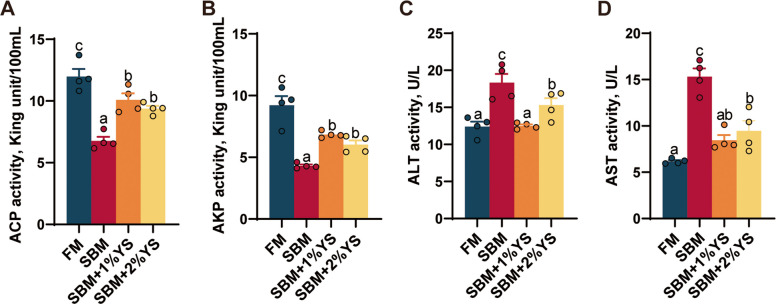 Figure 3
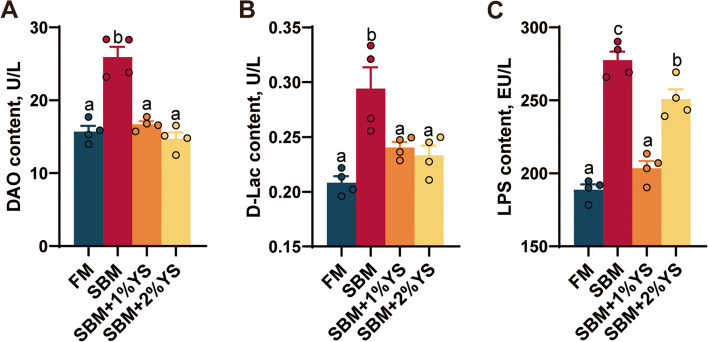 Figure 4
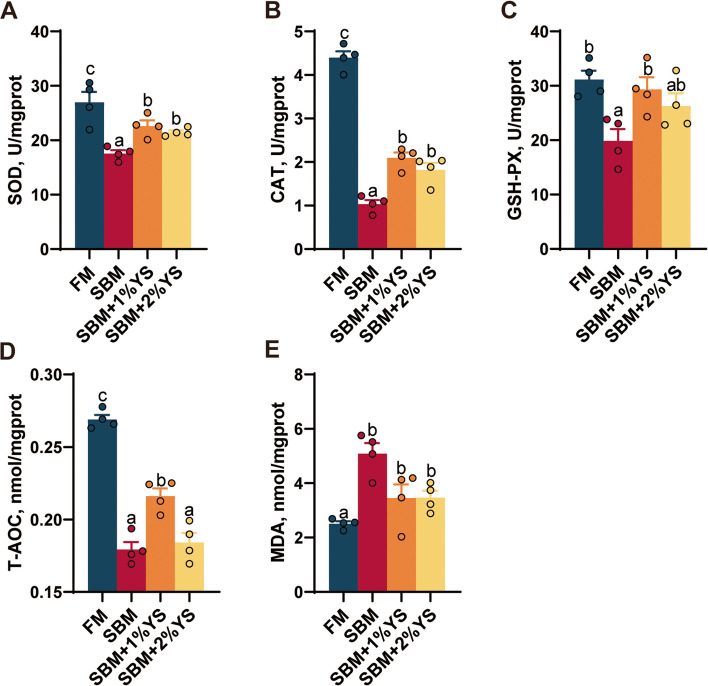 Figure 5
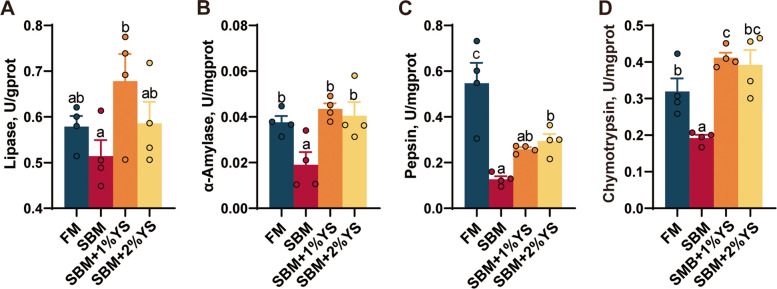 Figure 6
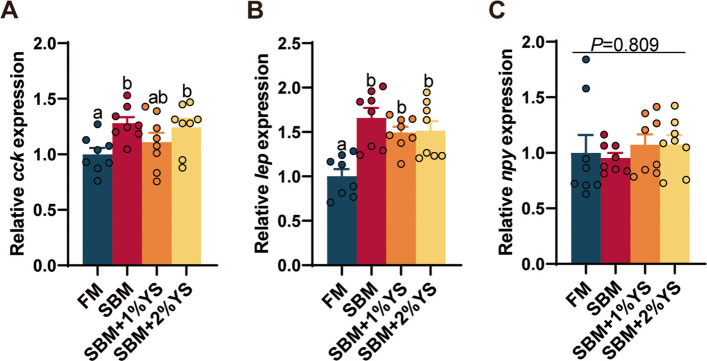 Figure 7
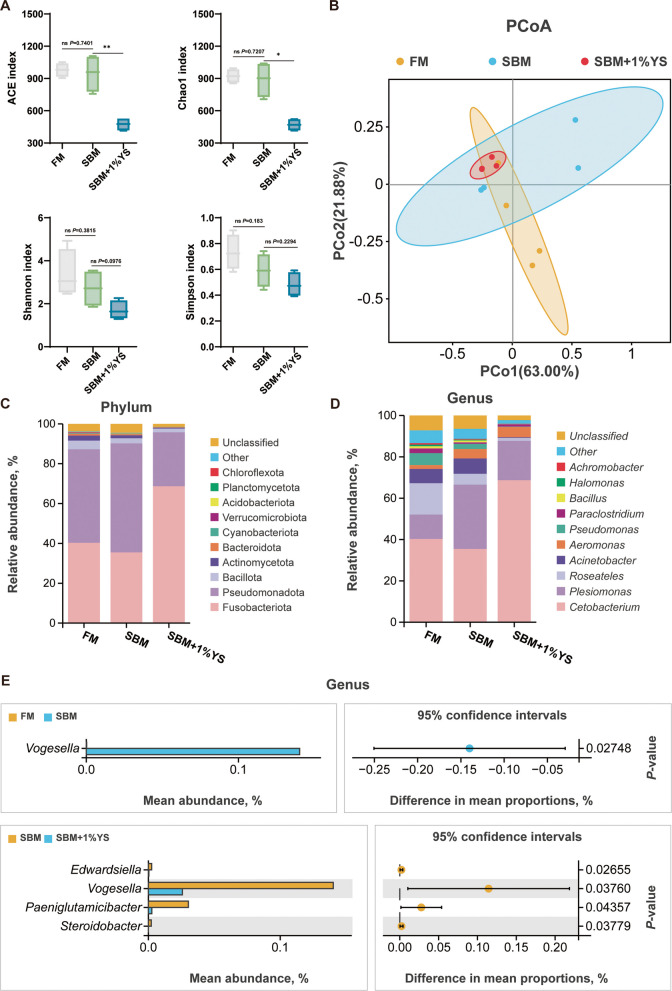 Figure 8
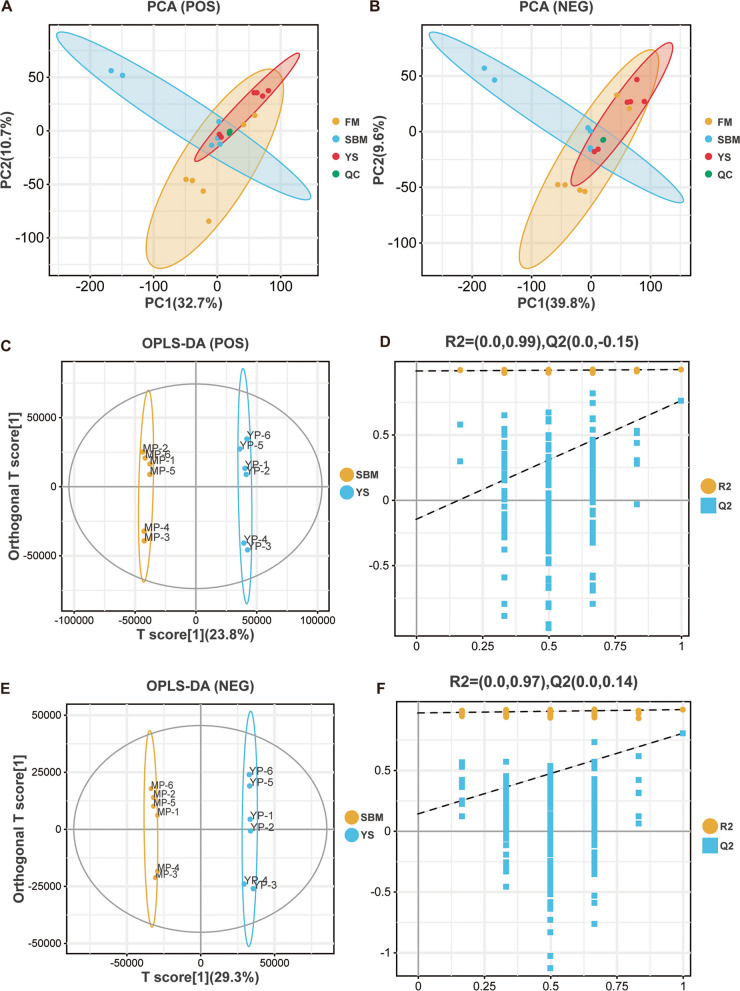 Figure 9
- —National Natural Science Foundation of China
- —Fundamental Research Funds for the Central Universities
Peer Reviews
No public reviews on file for this paper yet. If you reviewed it on a platform where reviews are public (OpenReview, ICLR, NeurIPS, ICML), you can paste yours below so the community can read it here.
Videos
No videos yet. Explain this paper in a talk, walkthrough, or lecture? Add one.
Taxonomy
TopicsAquaculture Nutrition and Growth · Protein Hydrolysis and Bioactive Peptides · Aquaculture disease management and microbiota
Background
Fish meal, characterized by its high protein content, palatability, digestibility, and favorable nutritional profile, is generally considered to be the primary source of protein in formulated diets for aquatic animals [1]. However, constraints in fish meal supply, coupled with escalating costs, have intensified research into alternative protein sources. Plant-based protein ingredients have gained significant interest due to their cost-effectiveness and ready availability [2]. However, the application of plant protein-based feeds in carnivorous fish diets is often limited by inherent challenges; these include imbalanced amino acid profiles and the occurrence of antinutritional factors [3, 4]. Consequently, developing functional additives to enhance the utilization efficiency of plant proteins has emerged as a key research focus.
Yeast-derived products (including yeast hydrolysate, yeast extract, yeast culture, and yeast cell wall extract) have demonstrated potential for improving feed palatability, modulating intestinal microbiota, and enhancing immunity because of their high levels of bioactive components, including nucleotides, small peptides, and B vitamins [5–7]. For instance, supplementation of 1%−5% yeast hydrolysate in plant protein diets enhanced the digestive and antioxidant capacities of the midgut and hindgut, as well as improved intestinal health in juvenile yellow catfish (Pelteobagrus vachelli ♂ × Pelteobagrus fulvidraco ♀) [8, 9]. Additionally, adding 2% yeast hydrolysate in soybean meal-based diets enhanced the feed utilization and mitigated the adverse effects on liver function and immune responses in pikeperch (Sander lucioperca) [10]. The inclusion of 3% yeast extract in fish meal-free diets improved feed quality and growth performance for rainbow trout (Oncorhynchus mykiss) [11]. Furthermore, adding yeast cell wall extract to mycotoxin-contaminated feed not only mitigated the toxic effects of the feed and improved growth performance and immune capability but also optimized intestinal health in fish [12, 13]. Similarly, supplementing yeast culture in low-fish meal diets enhanced the intestinal barrier function and modulated the intestinal microbial community in aquatic animals [14, 15]. Yeast enzymatic hydrolysis slurry (YS) is produced from specific fresh Saccharomyces cerevisiae through a series of processes: washing, enzymatic hydrolysis for 4 h, low-temperature concentration to a moisture content of 50%, enzyme deactivation and sterilization at 95 °C, cooling to room temperature, packaging into ton barrels, and final storage at room temperature [16, 17]. Compared with products like yeast enzymatic hydrolysis powder, yeast enzymatic hydrolysis slurry has advantages such as lower cost, less loss of functional peptides caused by high temperature, and avoidance of toxic and harmful substances generated by high temperature. The amino acids and small peptides it contains can stimulate the sensory perception of aquatic animals, activate liver function, and promote intestinal repair, thereby enhancing feed palatability, supplementing nutrients, boosting disease resistance, and improving growth performance [18]. However, there are relatively few research reports on yeast enzymatic hydrolysis slurry in aquatic animals.
As an important economic fish species in China, the largemouth bass (Micropterus salmoides) achieved an aquaculture output of 938,509 tons in 2024 [19]. Renowned for its delicate flesh and the absence of intermuscular bones, it has become a pillar species in the aquaculture industry [20]. Although the beneficial effects of yeast-based products in largemouth bass have been documented, including improvements in growth performance, muscle quality, immune function, and intestinal health, the application of yeast enzymatic hydrolysis slurry in feed for this species remains understudied [9, 21, 22]. Therefore, this research was designed to assess the influences of supplementing YS in soybean meal-based diets with partial fishmeal replacement on growth performance, intestinal health, and metabolic regulation of largemouth bass. By integrating analysis of physiological indices, 16S rRNA gene sequencing, and untargeted metabolomics, this study further elucidates the potential mechanisms by which YS alleviates the negative effects associated with plant protein utilization.
Materials and methods
Animals, experimental design, and diet
The juvenile largemouth bass employed in this experiment were purchased from a single farm (Chongqing Xiaoxiao Agriculture Co., Ltd., China). Before the feeding experiment was initiated, the fish were disinfected and acclimated in 400-L circular tanks for two weeks by filtered city tap water. During acclimation, the fish were fed to satiation twice daily with a commercial diet (Guangzhou Jieda Feed Co., Ltd., China). Following acclimation, a total of 320 healthy fish of consistent size (8.20 ± 0.05 g) were arbitrarily assigned to 16 blue circular fiberglass tanks, each having a capacity of 210 L. There were 20 fish per culture tank, with four replicate tanks assigned to each of the four experimental groups. The rearing period lasted for 8 weeks. Artificial fish feeding at 08:30 and 17:30 daily. A photoperiod of 12L:12D was maintained. Culture water, which was filtered city tap water, was partially exchanged daily, and waste feed and feces were removed via siphoning. Throughout the experimental period, water quality parameters were regulated as follows: dissolved oxygen > 6 mg/L, total ammonia nitrogen concentration < 0.2 mg/L, and water temperature in the range of 28–30 °C.
Four isonitrogenous (52% crude protein) and isolipidic (10% crude lipid) diets were formulated as follows: fish meal group (FM, positive control), soybean meal group (soybean meal replaced 30% of fish meal, SBM, negative control), and the soybean meal group supplemented with 1% YS (SBM + 1% YS) and 2% YS (SBM + 2% YS), respectively. Peruvian fishmeal was used as the fishmeal resource, and dehulled soybean was adopted as the soybean meal. The processing of soybeans involves cleaning and crushing, followed by n-hexane extraction, desolventization, drying, crushing, and classification to obtain the finished dehulled soybean meal. The experimental feed formulations are shown in Table 1. In line with the specified formula, all protein-based raw materials were sieved using a 60-mesh screen to ensure accurate weighing of each component. A step-by-step mixing approach was employed to add ingredients in smaller amounts to the feed mixture. Add 30% water and oil sources to the mixture, then thoroughly mix them in an Automatic S-type Single-paddle Trough Mixer (Model: CT-C-200, Jiangyin Xiangda Machinery Manufacturing Co., Ltd., China). The mixture was then processed into 2 mm pellets via cold extrusion using a feed pelletizer (Model: SG-YPYS-76, Xiamen Xinyunfa Machinery Equipment Factory, China) to produce 2 mm diameter pellets. The feed prepared in this experiment was stored in a refrigerator at −20 °C for later use, and subsequent to feed preparation, the proximate composition of each experiment feed was determined using the AOAC method [23]. Table 1. Composition of experimental diets and nutrient contentIngredients, %GroupsFMSBMSBM + 1%YSSBM + 2%YSPeruvian fishmeal^a^42.0029.4029.4029.40Chicken meal^a^15.0015.0015.0015.00Plasma protein powder^a^5.005.005.005.00Rapeseed meal^a^3.803.803.803.80Cottonseed protein concentrate^a^8.408.408.408.40Dehulled soybean meal^a^0.0016.9716.9716.97Yeast enzyme hydrolysis slurry^b^0.000.001.002.00Wheat flour10.0010.0010.0010.00Fish oil2.002.002.002.00Soybean oil1.502.002.002.00Microcrystalline cellulose7.282.461.660.86Ca(H_2_PO_4_)_2_1.501.501.501.50Choline chloride0.500.500.500.50Vitamin C0.100.100.100.10Mineral and vitamin premixes2.002.002.002.00Ethoxyquinoline0.050.050.050.05Lysine^c^0.000.140.140.14Methionine^c^0.170.280.280.28Non-essential amino acids0.700.400.200.00Proximate composition Crude protein52.9952.5452.3052.70 Crude lipid10.069.859.919.94 Crude ash15.0113.9213.8914.08 Moisture10.1910.1610.4010.53^a^Purchased from Chongqing Citico Biotechnology Co., Ltd. (Chongqing, China). Peruvian fishmeal: crude protein 65.22%, crude lipid 10.37%. Chicken meal: crude protein 62.77%, crude lipid 12.50%. Plasma protein powder: crude protein 87.01%, crude lipid 1.00%. Rapeseed meal: crude protein 36.00%, crude lipid 1.97%. Cottonseed protein concentrate: crude protein 60.00%, crude lipid 4.61%. Dehulled soybean meal: crude protein 48.43%, crude lipid 3.18%^b^Purchased from Chongqing Changnuo Biotechnology Co., Ltd. (Chongqing, China), crude protein 22.30%, moisture 59.00%, crude ash 2.60, amino acid nitrogen 2.29%, mannan 3.01%^c^Purchased from Shanghai Sanjie Biotechnology Co., Ltd. (Shanghai, China). Levorotatory amino acid with purity ≥ 98%
Sample collection
Before sampling, the experimental fish need to be fasted for 24 h and anesthetized using a 0.1% MS-222 solution (Sigma-Aldrich, USA) at the time of sampling. Each fish was individually weighed and counted for the calculation of growth performance. Subsequently, a random sample of nine fish per tank was taken for comprehensive analysis, including body length measurement, blood collection from the caudal vein, and dissection. The weights of the viscera, liver, and intestine were measured to evaluate the physiological parameters. The freshly drawn blood was kept at 4 °C for 24 h, then centrifuged at 3,500 r/min for 15 min. The supernatant was collected and stored at −80 °C for subsequent analysis of serum biochemical indicators and intestinal permeability assessment. The foregut, midgut, and hindgut of 2 fish per tank were sampled and preserved in 4% paraformaldehyde solution to be used in follow-up hematoxylin and eosin (H&E) staining. Two fish were chosen at random from each experimental tank, and their hindguts were pooled into a composite sample for antioxidant enzyme activity assay; two foreguts were collected from each tank and mixed into one sample for digestive enzyme activity assay. In addition, the hindguts of four fish selected from each tank were pooled into composite samples for gut microbiota assay, and the hindguts of another four fish were collected and pooled into composite samples for metabolomics analysis. Four fish brains were randomly selected from each tank, pooled into composite samples, and transferred to RNase-free centrifuge tubes produced by LABBSELECT for gene expression analysis. Except for tissues designated for histological processing, the samples were quickly frozen and then stored at −80 °C for future use.
Intestinal histological analysis
Pre-fixed intestinal tissues underwent gradual dehydration through an ethanol gradient, followed by paraffin embedding and sectioning at a thickness of 4 μm. After sectioning, H&E staining was performed on the tissues. Histopathological features and goblet cell counts were examined using an optical microscope (Eclipse Ti-E, Japan) coupled with an image acquisition system (NIS Elements, Japan). Twenty intestinal segments were selected from each slice to determine the fold and muscular layer thickness. Intestinal fold width (IFW), intestinal fold height (IFH), muscular layer thickness (MLT), and goblet cell (GC) numbers were measured by Image J software (NIH, USA).
Serum biochemical parameter analysis
Serum acid phosphatase (ACP, #A060-2-2), alkaline phosphatase (AKP, #A059-2-2), aspartate transaminase (AST, #C010-2-1), and alanine transaminase (ALT, #C009-2-1) were measured to assess immune activity. Serum LPS, DAO (#A088-3-1), and D-Lac (#A019-3-1) were measured to analyze intestinal permeabilities. The detection procedures and calculations were conducted strictly following the manufacturer's protocols (Nanjing Jiancheng Bioengineering Institute, Nanjing, China). Serum LPS (YJ858127) level was determined using a fish-specific ELISA kit (Shanghai Enzyme-linked Biotechnology Co., Ltd., Shanghai, China).
Detection of intestinal digestive enzyme and antioxidant enzyme activities
Chymotrypsin (#A080-3-1), α-amylase (#C016-1-2), lipase (#A054-2-1), and pepsin (#A080-1-1) in the foregut were measured to evaluate intestinal digestive capacity. Total antioxidant capacity (T-AOC, #A015-2-1), glutathione peroxidase (GSH-PX, #A005-1), catalase (CAT, #A007-1-1), malondialdehyde (MDA, #A003-1-2), and superoxide dismutase (SOD, #A001-3-2) were assayed to reflect antioxidant capacity. All assays were conducted in accordance with the instructions of the commercial kits from Nanjing Jiancheng.
Intestinal microbiota analysis
Intestinal DNA from FM, SBM, and SBM + 1% YS groups was obtained using the HiPure DNA Kit (Magen, Guangzhou, China). DNA concentration and integrity were assessed via Qubit 3.0 Fluorometer and 2% agarose gel electrophoresis, respectively. For the bacterial 16S rRNA genes, the amplification process targeting their V3–V4 hypervariable regions was carried out with the use of specific primers. (338F: 5′-ACTCCTACGGGAGGCAGCAG-3′; 806R: 5′-GGACTACHVGGGTWTCTAAT-3′). Libraries were constructed and quality-controlled. The Illumina NovaSeq 6000 platform (PE250 mode) was used to sequence the qualified libraries.
The Illumina platform (Gene Denovo Biotechnology Co., Ltd., Guangzhou, China) was employed for paired-end sequencing. Operational taxonomic units (OTUs) were formed by clustering high-quality sequences at a 97% similarity threshold via Uparse v9.2.64. Alpha diversity indices (ACE, Chao1, Simpson, and Shannon) were performed in QIIME 1.9.1. Beta diversity analysis utilizing Bray–Curtis distance metrics, including principal coordinates analysis (PCoA), was conducted. Taxonomic abundance was visualized in Krona 2.6. Stacked bar plots of community composition were generated using the ggplot2 package (v2.2.1) in R. Welch's t-test (Vegan package v2.5.3 in R) was applied for inter-group differential abundance analysis.
Untargeted metabolomics analysis
Intestinal tissue samples (100 mg) from FM, SBM, and SBM + 1% YS groups were homogenized for metabolite extraction. Supernatants and QC samples were analyzed. Equipped with a HILIC column, an Agilent 1290 Infinity UHPLC system was used for the separation. A mass spectrometer of the AB TripleTOF 6600 model was used to gather primary and secondary mass spectra. ProteoWizard (v3.0.6428) was used to convert the raw data into the mzML format. With subsequent procedures involving peak alignment, retention time calibration, and peak area retrieval with XCMS Online (v3.7.1). To enhance metabolic coverage, positive and negative ionization modes were employed. Untargeted metabolomic analysis was entrusted to Gene Denovo Biotechnology Co., Ltd. (Guangzhou, China).
Principal component analysis (PCA) was performed using the gmodels package in R. Orthogonal partial least squares discriminant analysis (OPLS-DA) was conducted using the ropls package, and the reliability of the model was verified through cross-validation and permutation tests. Differential metabolites were identified through the integration of OPLS-DA VIP values and univariate t-test P-values (threshold: VIP ≥ 1.5 and P < 0.05). Volcano plots visualize fold-change trends of differential metabolites. Metabolites were annotated with KEGG compound IDs (C_id), and Omicsmart generated KEGG enrichment bubble plots.
Feeding-related gene expression analysis
Following the extraction of total RNA from pooled brain tissues with RNAiso Plus reagent (TaKaRa, Japan), RNA concentration and purity were subsequently assessed with a NanoDrop 2000 ultra-micro spectrophotometer. Reverse transcription kit (RR092A; TaKaRa, Japan) was used to perform reverse transcription reactions and synthesize cDNA. The design and synthesis of all primers were conducted by Sangon Biotech (Guangzhou) Co., Ltd., with specific primer details listed in Table 2. Real-time quantitative PCR was performed using the TB Green Premix Ex Taq II kit (RR820A; TaKaRa, Japan). A CFX96 Touch™ Real-Time Fluorescence Quantitative PCR Detection System (Bio-Rad, Hercules, CA, USA) was used to carry out amplification reactions. The qPCR reaction protocol comprised the following steps: an initial pre-denaturation stage at 95 °C lasting 2 min, after which 40 cycles were run, and each cycle included a 5 s denaturation step at 95 °C and a 1 min annealing/extension step at 60 °C. The relative expression levels of the target genes were quantitatively analyzed using the 2^−ΔΔCT^ method [24], with the ef1α gene serving as the internal reference. Table 2. Real-time quantitative PCR primers for feeding-related genes in largemouth bassGenesNucleotide sequence (5'→3')Accession No.ef1αF: GTTGCTGCTGGTGTTGGTGAGR: GAAACGCTTCTGGCTGTAAGGXM_038724777.1cckF: TAAAGGGAAGTCACGGCTCATACR: CGGTTATTCTCAACAGACCCTGAXM_038724067.1lepF: GACTCTCAGCCCACCTTCTGR: GGTAACCCGTCAGCGAAGAGXM_038706036.1npyF: ACTCTGGGGTTCCTGCTTTGR: GTACTTGGCTAGCTCGTCCGXM_038724667.1ef1α Elongation factor 1-alpha, cck Cholecystokinin, lep Leptin, npy Neuropeptide Y
Calculation and statistical analysis
The formulae involved in this experiment are as follows:
\documentclass[12pt]{minimal} \usepackage{amsmath} \usepackage{wasysym} \usepackage{amsfonts} \usepackage{amssymb} \usepackage{amsbsy} \usepackage{mathrsfs} \usepackage{upgreek} \setlength{\oddsidemargin}{-69pt} \begin{document}\end{document}
- $$ \documentclass[12pt]{minimal} \usepackage{amsmath} \usepackage{wasysym} \usepackage{amsfonts} \usepackage{amssymb} \usepackage{amsbsy} \usepackage{mathrsfs} \usepackage{upgreek} \setlength{\oddsidemargin}{-69pt} \begin{document}$$\mathrm{Specific}\;\mathrm{growth}\;\mathrm{rate}\;(\mathrm{SGR})=100\times\lbrack(\ln\;\mathrm{final}\;\mathrm{weight}-\ln\;\mathrm{initial}\;\mathrm{weight})/56\;(\mathrm d)\rbrack.$$\end{document}\documentclass[12pt]{minimal} \usepackage{amsmath} \usepackage{wasysym} \usepackage{amsfonts} \usepackage{amssymb} \usepackage{amsbsy} \usepackage{mathrsfs} \usepackage{upgreek} \setlength{\oddsidemargin}{-69pt} \begin{document}\end{document}
- $$ \documentclass[12pt]{minimal} \usepackage{amsmath} \usepackage{wasysym} \usepackage{amsfonts} \usepackage{amssymb} \usepackage{amsbsy} \usepackage{mathrsfs} \usepackage{upgreek} \setlength{\oddsidemargin}{-69pt} \begin{document}$$\mathrm{Protein}\;\mathrm{efficiency}\;\mathrm{rate}\;(\mathrm{PER})=(\mathrm{final}\;\mathrm{weight}-\mathrm{initial}\;\mathrm{weight})/\mathrm{protein}\;\mathrm{intake}.\;$$\end{document}\documentclass[12pt]{minimal} \usepackage{amsmath} \usepackage{wasysym} \usepackage{amsfonts} \usepackage{amssymb} \usepackage{amsbsy} \usepackage{mathrsfs} \usepackage{upgreek} \setlength{\oddsidemargin}{-69pt} \begin{document}\end{document}
- $$ \documentclass[12pt]{minimal} \usepackage{amsmath} \usepackage{wasysym} \usepackage{amsfonts} \usepackage{amssymb} \usepackage{amsbsy} \usepackage{mathrsfs} \usepackage{upgreek} \setlength{\oddsidemargin}{-69pt} \begin{document}$$\mathrm{Viscera}\;\mathrm{somatic}\;\mathrm{index}\;(\mathrm{VSI})=100\times(\mathrm{visceral}\;\mathrm{weight}/\mathrm{fish}\;\mathrm{weight}).$$\end{document}\documentclass[12pt]{minimal} \usepackage{amsmath} \usepackage{wasysym} \usepackage{amsfonts} \usepackage{amssymb} \usepackage{amsbsy} \usepackage{mathrsfs} \usepackage{upgreek} \setlength{\oddsidemargin}{-69pt} \begin{document}\end{document}
- $$ \documentclass[12pt]{minimal} \usepackage{amsmath} \usepackage{wasysym} \usepackage{amsfonts} \usepackage{amssymb} \usepackage{amsbsy} \usepackage{mathrsfs} \usepackage{upgreek} \setlength{\oddsidemargin}{-69pt} \begin{document}$$\mathrm{Intestine}\;\mathrm{somatic}\;\mathrm{index}\;(\mathrm{ISI})=100\times(\mathrm{intestinal}\;\mathrm{weight}/\mathrm{fish}\;\mathrm{weight}).\;$$\end{document}\documentclass[12pt]{minimal} \usepackage{amsmath} \usepackage{wasysym} \usepackage{amsfonts} \usepackage{amssymb} \usepackage{amsbsy} \usepackage{mathrsfs} \usepackage{upgreek} \setlength{\oddsidemargin}{-69pt} \begin{document}\end{document}
SPSS 27.0 was utilized to perform one-way ANOVA. This step was intended to examine the existence of significant inter-group differences. Results featuring *P* values less than 0.05 were deemed to have statistical significance; subsequent pairwise comparisons were carried out via Duncan’s post-hoc test. All data are shown as “mean ± standard error of the mean (SEM)”. Visual graphics were produced with GraphPad Prism 9.0 (GraphPad Software, Inc., USA). ## Results ### Growth performance and morphometric indices Among all experimental groups, the SBM group exhibited the lowest FBW, WGR, and SGR values (Table [3](#Tab3)). These values in the experimental groups, SBM+1% YS and SBM+2% YS, were notably higher compared to the SBM group (*P* = 0.037, 0.032, 0.030) but were similar to those of the FM group (*P* = 0.106, 0.0976, 0.0958). Additionally, no statistically significant differences were observed in FR, FCR, and PER in any group (*P* = 0.401, 0.573, 0.579). The SBM group exhibited the highest CF value, showing a significant difference from that observed in the FM group (*P* = 0.034). However, the SBM group showed the lowest VSI (*P* < 0.001) and HIS (*P* < 0.001) values, which differed significantly from those of other groups. ISI showed no significant variation in any group (*P* = 0.211). Table 3. Effects of dietary YS on growth performance and morphometric indices of largemouth bassItemsGroupsFMSBMSBM + 1%YSSBM + 2%YSFBW, g40.27 ± 0.92^ab^38.82 ± 0.84^a^43.12 ± 1.18^b^43.40 ± 1.46^b^WGR, %390.84 ± 11.10^ab^373.69 ± 10.15^a^426.42 ± 14.36^b^429.73 ± 17.36^b^SGR, %/d283.96 ± 3.99^ab^277.63 ± 3.76^a^296.40 ± 4.87^b^297.33 ± 5.88^b^FR, %2.77 ± 0.092.86 ± 0.032.79 ± 0.042.91 ± 0.07FCR1.19 ± 0.061.24 ± 0.021.16 ± 0.031.20 ± 0.05PER1.69 ± 0.081.62 ± 0.021.74 ± 0.041.68 ± 0.03CF, g/cm^3^2.18 ± 0.04^a^2.30 ± 0.03^b^2.25 ± 0.02^ab^2.24 ± 0.02^ab^VSI, %7.67 ± 0.22^c^6.22 ± 0.10^a^6.81 ± 0.12^b^6.70 ± 0.12^b^HIS, %2.32 ± 0.08^c^1.19 ± 0.05^a^1.58 ± 0.05^b^1.64 ± 0.06^b^ISI, %0.80 ± 0.010.76 ± 0.010.77 ± 0.010.77 ± 0.01The values of growth performances are mean ± SEM (*n* = 4), and the morphological indicators are mean ± SEM (*n* = 9). Different lowercase letters in the same row indicate statistical differences (*P* < 0.05). *FBW* Final body weight, *WGR* Weight gain rate, *SGR* Specific growth rate, *FR* Feeding rate, *FCR* Feed conversion ratio, *PER* Protein efficiency ratio, *CF* Condition factor, *VSI* Viscerosomatic index, *HSI* Hepatosomatic index, *ISI* Intestinal somatic index ### Intestinal histomorphology analysis In the foregut, the SBM group exhibited the lowest IFH, MLT, and GC numbers among all groups (Figs. [1](#Fig1) and [2](#Fig2)). For midgut indices, IFH (*P* < 0.001), IFW (*P* = 0.005), and MLT (*P* < 0.001) in the SBM group were notably lower than those in all other groups, while the numbers of GC in the FM group were notably higher than other groups (*P* = 0.011). In the hindgut, the SBM group exhibited the lowest IFH, MLT, and GC numbers. Among the indices, IFH showed a significant reduction relative to other groups (*P* < 0.001), while no statistically significant disparity in IFW was detected when comparing the various groups (*P* = 0.510).Fig. 1. Hematoxylin–Eosin staining of different intestinal segments in juvenile largemouth bassFig. 2Intestinal histomorphometric measurement in the different intestinal segments of four groups. **A** Intestinal fold height (IFH). **B** Intestinal fold width (IFW). **C** Muscular layer thickness (MLT). **D** Goblet cell numbers (GC). Values are expressed as mean ± SEM (*n* = 4). Columns with different letters represent significantly different (*P* < 0.05) ### Serum biochemical analysis The SBM group showed significantly lower ACP (*P* = 0.001) and AKP (*P* < 0.001, Fig. [3](#Fig3)) activities than all other groups. However, the SBM group exhibited notably higher ALT (*P* < 0.001) and AST (*P* < 0.001) activities than other groups. Moreover, the activities of ALT (*P* = 0.9065) and AST (*P* = 0.0508) in the FM group were comparable to those in the SBM + 1%YS group.Fig. 3. Serum biochemistry indices of juvenile largemouth bass fed with different diets. **A** Acid phosphatase (ACP). **B** Alkaline phosphatase (AKP). **C** Alanine aminotransferase (ALT). **D** Aspartate aminotransferase (AST). Values are expressed as mean ± SEM (*n* = 4). Results with significant differences were marked with different letters (*P* < 0.05) ### Intestinal permeability analysis Levels of DAO (*P* < 0.001), D-Lac (*P* = 0.001), and LPS (*P* < 0.001) were highest in the SBM group, significantly exceeding those in the FM group and the groups supplemented with varying proportions of yeast enzyme hydrolysis slurry (Fig. [4](#Fig4)).Fig. 4. Intestinal permeability parameters of juvenile largemouth bass fed with different diets*.* **A** Diamine oxidase (DAO). **B** D-Lactate (D-Lac). **C** Lipopolysaccharide (LPS). Values are expressed as mean ± SEM (*n* = 4). Results with significant differences were marked with different letters (*P* < 0.05) ### Intestinal antioxidant enzyme activity analysis The FM group had the highest levels of T-AOC, CAT, SOD, and GSH-Px, and the lowest level of MDA (Fig. [5](#Fig5)). Furthermore, compared with the SBM group, the catalase activity (*P* < 0.001) and superoxide dismutase activity (*P* = 0.005) in the 1% YS group were significantly increased, while the malondialdehyde level (*P* = 0.0419) was significantly decreased. Similarly, in the 2% YS group, the catalase activity (*P* = 0.0052) and superoxide dismutase activity (*P* = 0.0016) were significantly increased, and the malondialdehyde level (*P* = 0.0127) was significantly decreased.Fig. 5. Antioxidant enzyme activity index of the intestine of juvenile largemouth bass fed with different diets. **A** Superoxide dismutase (SOD). **B** Catalase (CAT). **C** Glutathione peroxidase (GSH-Px). **D** Total antioxidant capacity (T-AOC). **E** Malondialdehyde (MDA). Values are expressed as mean ± SEM (*n* = 4). Results with significant differences were marked with different letters (*P* < 0.05) ### Intestinal digestive enzyme activity analysis The SBM group had the lowest activities of all digestive enzymes (Fig. [6](#Fig6)). Compared to the SBM group, YS supplementation elevated all enzyme activities (lipase, α-amylase, pepsin, and chymotrypsin). Specifically, the activities of α-amylase (*P* = 0.0068) and chymotrypsin (*P* < 0.001) in the 1% YS group, and the activities of α-amylase (*P* = 0.039) and chymotrypsin (*P* = 0.0029) in the 2% YS group were significantly increased.Fig. 6. Intestinal digestive enzyme activity of juvenile largemouth bass fed with different diets. **A** Lipase. **B** α-Amylase (α-AMS). **C** Pepsin. **D** Chymotrypsin. Values are expressed as mean ± SEM (*n* = 4). Results with significant differences were marked with different letters (*P* < 0.05) ### Expression of appetite-regulating genes The mRNA expression levels of the anorexigenic factors *cck* and *lep* reached their highest levels in the SBM group, but were downregulated following YS supplementation (Fig. [7](#Fig7)). Conversely, the expression of orexigenic neuropeptides was lowest in the SBM group, whereas YS supplementation elevated their expression beyond levels observed in the FM group (*P* = 0.6992).Fig. 7. Expression of appetite-regulating hormone and neuropeptide genes of juvenile largemouth bass fed with different diets. **A** Cholecystokinin (*cck*). **B** Leptin (*lep*). **C** Neuropeptide Y (*npy*). Values are expressed as mean ± SEM (*n* = 4). Results with significant differences were marked with different letters (*P* < 0.05) ### Intestinal microbiota analysis Based on the comprehensive analysis of growth performance, histological morphology, and physiological and biochemical indicators as described above, the intestinal samples of the FM, SBM, and SBM + 1%YS groups were selected for microbial diversity analysis. The SBM + 1%YS group exhibited the lowest ACE, Chao1, Shannon, and Simpson indices, with ACE (*P* = 0.0022) and Chao1 (*P* = 0.0032) being notably lower compared with the SBM group (Fig. [8](#Fig8)A). However, there was no significant difference between the SBM and FM groups in these four indices (*P* = 0.3792, 0.1828, 0.7136, 0.7334). Principal coordinate analysis served to evaluate β-diversity (Fig. [8](#Fig8)B), and the Kruskal–Wallis test displayed that notable discrepancies between the three groups of microorganisms (*P* = 0.00968). At the phylum level (Fig. [8](#Fig8)C), Fusobacteriota, Pseudomonadota, and Bacillota dominated the intestinal microbiota of juvenile largemouth bass; among them, Fusobacteriota accounted for 68.67% in the YS group, and Pseudomonadota accounted for 54.73% in the SBM group. Dominant genera (Fig. [8](#Fig8)D) included *Cetobacterium*, *Plesiomonas*, *Roseateles*, *Acinetobacter*, *Aeromonas*, and *Pseudomonas*. Welch’s *t*-test at genus level (95% confidence interval; Fig. [8](#Fig8)E) showed: Significant differences in *Vogesella* abundance between SBM and FM groups. Marked differences in *Edwardsiella*, *Vogesella*, *Paeniglutamicibacter,* and *Steroidobacter* between the SBM and YS groups.Fig. 8. The degree of difference among the three groups was shown for the intestinal microbiota (*n* = 4). **A** Effects of three groups on the intestinal microbiota α diversity of juvenile largemouth bass. **B** Principal component analysis. The *x*-axis represents the first principal component, and the *y*-axis represents the second principal component. The different colored ellipses represent 95% confidence intervals. **C** Histogram of intestinal microbial species classification at the phylum level in the three groups. **D** Histogram of intestinal microbial species classification at the genus level in the three groups. **E** Welch's *t*-test at the genus level ### Metabolomics analysis Based on the comprehensive analysis of growth performance, histological morphology, and physiological and biochemical indicators as described above, the intestinal samples of the FM, SBM, and SBM + 1%YS groups were selected for metabolomic analysis. Multivariate analysis results revealed distinctions in intestinal metabolites across the three groups (Fig. [9](#Fig9)A and B), and the tight clustering of quality control samples confirmed the stability of the instrument. OPLS-DA yielded results that could effectively explain and forecast the disparities between the SBM and YS groups (Fig. [9](#Fig9)C and E). Specifically, the model validation parameters for positive ion mode were (R^2^X = 0.496, R^2^Y = 0.997, Q^2^ = 0.759), while those for negative ion mode were (R^2^X = 0.615, R^2^Y = 0.997, Q^2^ = 0.718). In addition, we used a permutation test to evaluate the accuracy of the OPLS-DA model (Fig. [9](#Fig9)D and F), and the results showed that the model had accurate predictability.Fig. 9. Multivariate statistical analysis in metabolomics (*n* = 6). **A** Principal component analysis for positive ions. **B** Principal component analysis for negative ions. **C** OPLS-DA score plot for positive ions. **D** OPLS-DA permutation test plot for positive ions. **E** OPLS-DA score plot for negative ions. **F** OPLS-DA permutation test plot for negative ions Based on the metabolomics results, differential metabolites were screened using the dual criteria of VIP value > 1.5 and *P*-value < 0.05. A key finding was the prevalence of downregulated metabolites in the SBM group relative to the FM group (Fig. [10](#Fig10)A and B), while after adding YS to the SBM-based diet, a large number of differential metabolites were upregulated (Fig. [10](#Fig10)C and D). In positive ion (POS) mode, 200 metabolites exhibited significant upregulation and 20 metabolites showed significant downregulation in the YS group (*P* < 0.001 to *P* = 0.049373). For the negative ion (NEG) mode, the corresponding numbers were 302 significantly upregulated metabolites and 27 significantly downregulated ones in the same group (*P* < 0.001 to *P* = 0.048656). To further explore the differential metabolites and metabolic pathways, an analysis was carried out on the top 20 pathways in terms of enrichment degree in the Kyoto Encyclopedia of Genes and Genomes (KEGG). It was found that there were significant differences in the top 10 pathways in FM vs. SBM group (Fig. [10](#Fig10)E), and significant differences in the top 11 pathways in SBM vs. YS group (*P* = 0.004097 to 0.049887) (Fig. [10](#Fig10)F). These 11 pathways are specifically as follows: protein digestion and absorption, aminoacyl-tRNA synthesis, D-amino acid metabolism, lysine, and nicotinic acid, biosynthesis of alkaloids derived from ornithine, tryptophan metabolism, ABC transporters, cysteine and methionine metabolism, biosynthesis of plant hormones, nucleotide metabolism, arginine biosynthesis, and folate resistance.Fig. 10. Analysis of differential metabolites and metabolic pathways. **A** Volcano plot of positive ion mode in FM vs. SBM groups. **B** Volcano plot of negative ion mode in FM vs. SBM groups. **C** Volcano plot of positive ion mode in SBM vs. YS groups. **D** Volcano plot of negative ion mode in SBM vs. YS groups. **E** Top 20 of KEGG Enrichment pathways for FM vs. YS. **F** Top 20 of KEGG Enrichment pathways for SBM vs. YS ### Correlation analysis between intestinal microbiota and differentially expressed metabolites For a deeper examination of the link between intestinal microbiota and metabolites with differential expression, Pearson correlation analysis was conducted on microbial genera identified by Welch's *t*-test between the SBM and YS groups, and selected differentially expressed metabolites from the top 11 enriched KEGG pathways. The results (Fig. [11](#Fig11)) showed that the pathogenic genus *Edwardsiella* was strongly linked to sucrose levels (*R* = 0.59, *P* < 0.05), while it was significantly negatively correlated with amino acids such as leucine and arginine, as well as 5-hydroxyindole, Xanthosine, and lupinine (*R* = −0.72 to −0.58, *P* < 0.05). The conditional pathogenic genera *Paeniglutamicibacter* and *Steroidobacter* showed highly similar correlation patterns, while *Vogesella* was negatively correlated with 5-hydroxyindole and 13-keto-9Z,11E-octadecadienoic acid (13-KODA) (*R* = −0.58 to −0.65, *P* < 0.05).Fig. 11. The correlation heatmap of intestinal microbiota and differentially expressed metabolites in the SBM vs. YS groups. Darker red (larger *R* value) and darker blue (lower *R* value) colors indicate stronger positive and negative correlations, respectively. Significant correlations are marked by an asterisk ### Correlation analysis of growth performance and immune indicators with multi-omics indicators The Mantel test was used to explore the associations between factors such as growth performance, immunity, gut microbiota, and differential metabolites (Fig. [12](#Fig12)). Among them, GC, LPS, AKP, and SOD were significantly correlated with *Vogesella* (*r* = 0.43 to 0.69, *P* = 0.002, 0.003, 0.01, 0.009). Similarly, GC, LPS, AKP, ALT, and SOD were significantly correlated with Sucrose (*r* = 0.49 to 0.69, *P* = 0.003, 0.002, 0.001, 0.01, 0.007).Fig. 12. Relationships between growth performance, immune indices, differential intestinal flora, and differential metabolites in juvenile largemouth bass revealed by the Mantel test. Edge width corresponds to Mantel's *r* value, and the edge color denotes statistical significance. Pairwise correlations of these variables are shown with a color gradient denoting Spearman's correlation coefficient. WGR, weight gain rate; GC, goblet cell; LPS, lipopolysaccharide; AKP, alkaline phosphatase; ALT, alanine transaminase; SOD, superoxide dismutase ## Discussion ### Effects of yeast enzyme hydrolysis slurry on growth performance and digestive ability of juvenile largemouth bass Current studies demonstrate that dietary supplementation of 1%–2% yeast enzyme hydrolysis slurry in soybean meal-based diets with partial fishmeal replacement promotes growth performance in juvenile largemouth bass. Yeast-derived additives, such as yeast hydrolysate, yeast culture, and yeast cell wall, have all been shown to enhance the growth performance of aquatic animals [[14](#CR14), [25](#CR25), [26](#CR26)]. In this study, the efficacy of the 1% YS-supplemented diet was comparable to that of the FM group. This further validates the universal application of yeast-derived products in low-fishmeal diets for aquatic species [[27](#CR27)]. The growth-promoting effect of YS is presumably closely associated with its unique nutritional composition: processed via enzymatic hydrolysis, this product is rich in functional components that are easily digested and absorbed by aquatic animals, such as free amino acids, nucleotides, and small-molecule peptides [[28](#CR28)–[30](#CR30)]. The capacity of fish to break down and absorb nutrients is directly reflected by intestinal digestive enzymes [[31](#CR31)]. In this study, YS supplementation in soybean meal-based diets with partial fishmeal replacement significantly enhanced digestive enzyme activities. YS may exert growth-promoting effects via its abundant bioactive components. Previous studies have demonstrated that yeast-derived products typically contain functional substances such as amino acids, oligosaccharides, and nucleotides [[32](#CR32)], which have been proven to enhance intestinal health and digestive function in fish. For instance, dietary supplementation of yeast β-glucan can significantly increase the intestinal fold height, muscle layer thickness, and digestive enzyme activity in coho salmon (*Oncorhynchus kisutch*) [[33](#CR33)]. Appetite and feed intake in teleosts are regulated by interactions between orexigenic factors and anorexigenic factors [[34](#CR34)]. Research indicates that downregulation of hypothalamic anorexigenic factors can enhance appetite and increase the food consumption of different types of fish [[35](#CR35)]. This research revealed that the expression levels of anorexigenic genes *cck* and *lep* in the SBM group were reduced by YS supplementation. This significant downregulation is the core mechanism underlying YS-induced improvements in appetite and feeding performance. This effect is presumably closely associated with the rich amino acid composition of YS: glutamic acid, a flavor-enhancing amino acid [[36](#CR36)], can act synergistically with aspartic acid as an excitatory neurotransmitter to directly modulate appetite signaling by targeting the hypothalamic region of the brain. Meanwhile, its degradation metabolites–glutamine, γ-aminobutyric acid (GABA), and α-ketoglutarate–may further potentiate the inhibition of anorexigenic pathways by regulating leptin secretion [[37](#CR37)]. Although previous studies have shown that leptin can suppress the mRNA expression of the orexigenic gene *npy* [[38](#CR38)], and an inverse expression trend between *npy* and *lep* was observed in this study, the changes in *npy* expression did not reach statistical significance. Thus, *npy* might not be the primary driver of YS-mediated feeding regulation. In summary, YS enhances appetite and feed intake in juvenile largemouth bass primarily by significantly downregulating the expression of *cck* and *lep* thereby inhibiting anorexigenic pathways. However, further research is needed to elucidate whether YS-mediated regulation of anorexigenic factors involves other signaling pathways, such as metabolic signaling transduction via the gut-brain axis. ### Effects of yeast enzyme hydrolysis slurry on intestinal histomorphology and antioxidant capacity in juvenile largemouth bass The morphological structure of the intestine is essential for the absorption of nutrients and sustaining intestinal functionality [[39](#CR39)]. Generally, intestinal fold height and depth reflect the nutrient absorption efficiency of the digestive system [[40](#CR40)]. Intestinal fold height increases contact surface area with nutrients, muscularis thickness indicates intestinal contraction strength, and goblet cells play key roles in maintaining epithelial integrity and regulating immune responses to exogenous antigens [[41](#CR41)]. In this study, compared to the soybean meal group, YS supplementation significantly increased intestinal fold height, muscularis thickness, and goblet cell numbers in the foregut, midgut, and hindgut. Similar studies have shown that dietary supplementation of 1% yeast culture significantly increased the intestinal fold width in the foregut and hindgut, as well as the muscularis thickness in the midgut and hindgut of *Cyprinus carpio* [[42](#CR42)]. The DAO, D-Lac, and LPS are biomarkers of damage to the intestinal mucosal layer [[43](#CR43)]. In this study, dietary YS significantly reduced DAO, D-Lac, and LPS levels, thereby decreasing intestinal permeability in largemouth bass. Intestinal barrier permeability directly reflects gut health, primarily determined by tight junction integrity [[44](#CR44)]. Tight junction damage often accompanies increased oxidative stress [[45](#CR45)], leading to ROS accumulation. Studies indicate ROS accumulation downregulates antioxidant enzymes (CAT, GSH-Px, and SOD) and elevates MDA in fish tissues [[46](#CR46)]. For example, Dietary yeast extracts enhanced CAT and SOD activity in Chinese mitten crab (*Eriocheir sinensis*) [[47](#CR47)]. Yeast products increased plasma SOD activity in *Aeromonas hydrophila*-challenged silver carp (*Hypophthalmichthys molitrix*) [[48](#CR48)]. In addition, lysozyme activity in head kidney macrophages of Atlantic salmon (*Salmo salar*) was elevated by yeast β-glucan [[49](#CR49)]. Dietary nucleotides improved lysozyme and SOD activity in whiteleg shrimp (*Litopenaeus vannamei*) [[50](#CR50)]. Thus, yeast enzyme hydrolysis slurry can ameliorate intestinal histomorphology and boost antioxidant capacity in juvenile largemouth bass. However, this study did not involve research on organelles in intestinal tissue sections. ### Effects of yeast enzyme hydrolysis slurry on intestinal microbiota in juvenile largemouth bass In the regulation of host metabolism, immunity, and intestinal health, the intestinal microbiota plays an essential role [[51](#CR51)]. Notably, dietary YS supplementation did not significantly increase microbial diversity and richness but instead showed a declining trend. At the phylum level, Fusobacteriota, Pseudomonadota, and Bacillota dominated the microbiota; this aligns with prior research on largemouth bass [[52](#CR52)]. The YS group exhibited significantly increased beneficial Fusobacteriota and decreased harmful Pseudomonadota, explaining the diversity shift. At the genus level, YS enhanced beneficial *Cetobacterium* while suppressing the abundance of pathogenic bacteria, including *Plesiomonas, Acinetobacter, *and* Pseudomonas* [[53](#CR53)–[55](#CR55)]. *Cetobacterium* aids digestion, vitamin B_12_ synthesis, and inhibits pathogenic colonization [[56](#CR56), [57](#CR57)]. Additionally, Welch's *t*-test conducted at the genus level revealed that the SBM group had notably higher *Vogesella* abundance than the FM and YS groups, and notably higher abundance of *Edwardsiella*, *Paeniglutamicibacter*, and *Steroidobacter* than the YS group. *Vogesella* is a common genus closely associated with the white discoloration syndrome in crustacean gastrointestinal tracts, and its significant increase in the SBM group reflects dysbiosis [[58](#CR58)]. *Edwardsiella*, a pathogenic bacterium of black sea bass [[59](#CR59)], showed a significant decrease in abundance after YS addition. A plausible explanation is that *Cetobacterium* enriched in the YS group produces antimicrobial peptides and lowers intestinal pH, thereby reducing the colonization and proliferation of potential pathogenic bacteria [[60](#CR60), [61](#CR61)]. The dominant putrefactive bacterium genus *Paeniglutamicibacter* and the dominant bacterium genus *Steroidobacter* during meat freezing processes were also significantly enriched in the SBM group [[62](#CR62), [63](#CR63)]. In summary, dietary YS can improve the health of largemouth bass intestines by significantly elevating the abundance level of beneficial bacterial communities and lowering that of harmful bacterial communities. However, the YS group did not directly lead to a significant increase in the abundance and diversity of intestinal microbiota. This differs from conventional yeast additives that typically enhance microbial abundance [[14](#CR14), [42](#CR42)]. A plausible explanation is that the unique processing technology of YS facilitates the enrichment of beneficial bacteria and inhibits the colonization of potential pathogenic bacteria [[64](#CR64)]. ### Effects of yeast enzyme hydrolysis slurry on metabolomics in juvenile largemouth bass In this study, PCA was applied to examine the distribution pattern of intestinal metabolites among different groups. From the PCA results, it could be observed that intestinal metabolite distribution in the YS group shared a high degree of overlap with the FM group, while differing from what was seen in the SBM group. The volcano plot showed the upregulation and downregulation of differential metabolites between the SBM and YS groups after screening. In the protein digestion and absorption pathway, differential metabolites such as L-arginine, L-tyrosine, L-leucine, and L-methionine were significantly upregulated. Among them, L-arginine, an essential amino acid for fish, and L-leucine can promote protein synthesis and improve growth performance by activating the mTOR signaling pathway [[65](#CR65)]. Yeast extract may enhance the adaptability of largemouth bass to plant proteins by improving the bioavailability of arginine in plant protein feeds [[66](#CR66)]. Arginine is also the sole substrate for nitric oxide (NO) production in the body, assisting in the generation of NO to scavenge reactive oxygen species (ROS) and enhance the antioxidant capacity of fish [[67](#CR67)]. L-Methionine has been shown to alleviate the negative effects of reduced antioxidant capacity in largemouth bass fed low-fishmeal diets [[68](#CR68)]. Additionally, some undigested and unabsorbed peptides in this metabolic pathway can produce differentially expressed metabolites such as amines and indoles through amino acid degradation and fatty acid production, which are significantly upregulated to promote digestion, absorption, and intestinal health. Protein biosynthesis is a key process in various vital activities, and aminoacyl-tRNA synthetases play a crucial role [[69](#CR69)]. In the D-amino acid metabolism pathway, differentially expressed metabolites such as 2-oxoglutarate, D-serine, D-glutamine, and L-threonine were significantly upregulated. 2-Oxoglutarate, an intermediate of the tricarboxylic acid cycle, is involved in energy metabolism and amino acid synthesis. D-Glutamine can promote the proliferation of intestinal cells, maintain the expression level of tight junction proteins, repair the mucosal barrier, reduce intestinal inflammation, and enhance the tolerance of fish to soybean meal-based diets [[70](#CR70), [71](#CR71)]. D-Serine and L-threonine jointly participate in the metabolism of glycine, serine, and threonine, which is related to microbial growth and involved in the inhibition of pathogens [[72](#CR72)]. Taken together, yeast enzyme hydrolysis slurry can improve the growth and intestinal health of juvenile largemouth bass through the regulation of the upregulation and downregulation of differentially expressed metabolites. ### Correlation analysis of intestinal microbiota and intestinal metabolomics The intestinal microbiota affects digestion and absorption, which in turn alters the metabolic activities of the organism [[73](#CR73)]. Through the analysis of variations in intestinal flora and metabolites, we can better explore the effects of enzyme hydrolysis of yeast pulp on the growth, metabolism, and intestinal health of largemouth bass. Between the metabolite sucrose and the pathogen *Edwardsiella* in largemouth bass, a positive correlation was identified through correlation analysis. Studies have shown that sucrose itself does not directly regulate the virulence genes of *Edwardsiella*, but may jointly affect the pathogenicity of *Edwardsiella* with the metabolism of other carbon sources in the intestine. For example, glycolipid metabolic disorders caused by high-starch diets may indirectly weaken host immunity and increase the risk of *Edwardsiella* infection [[74](#CR74)]. *Edwardsiella* may primarily depend on carbohydrate metabolites to carry out infection, whereas the host might activate amino acid metabolic pathways as a mean of self-defense [[75](#CR75)], so amino acids in the heat map showed a negative correlation with *Edwardsiella*, which also explains why amino acid metabolic pathways were significantly enriched after the addition of enzyme hydrolysis of yeast pulp. However, *Paeniglutamicibacter* and *Steroidobacter* have not been deeply studied in largemouth bass, and only a few studies have shown that both are dominant spoilage bacteria [[62](#CR62), [63](#CR63)]. The significant negative correlation between the *Vogesella* genus and 5-hydroxyindole, 13-keto-9Z,11E-octadecadienoic acid suggests its disruptive effect on intestinal barrier and immune homeostasis. 5-Hydroxyindole is an important metabolite of tryptophan, which promotes intestinal barrier repair by activating the aryl hydrocarbon receptor (AhR) [[76](#CR76)]. The 13-KODA, as a derivative of linoleic acid, participates in regulating intestinal inflammatory responses and epithelial cell integrity [[77](#CR77)]. The significant correlation between the *Vogesella* genus and GC, SOD, and other immune factors in the Mantel test further demonstrates that the *Vogesella* genus may be a key group triggering intestinal microbiota dysbiosis and immune suppression in largemouth bass. Additionally, the Mantel test showed a significant correlation between GC, LPS, AKP, SOD, and sucrose, indicating that the negative effects of sucrose on host physiology are not limited to serving as a carbon source for pathogenic bacteria but may also directly interfere with the immune function of juvenile largemouth bass. For example, a high-sucrose environment may induce oxidative stress in intestinal epithelial cells, reducing the antioxidant activity of SOD, while sucrose metabolic disorders may disrupt intestinal mucosal structure [[78](#CR78)]. Therefore, YS can effectively alleviate intestinal barrier damage caused by plant protein feed by reducing sucrose levels and the abundance of harmful bacteria. However, the correlation analysis lacks the association with genes. ## Conclusion In this study, the inclusion of yeast enzyme hydrolysis slurry in soybean meal-based diets with partial fishmeal replacement enhanced the digestion and antioxidant capacity, reduced intestinal permeability, altered the abundance of intestinal microbiota and associated core metabolites. These positive changes collectively contributed to improved growth performance in largemouth bass. Correlation analysis further indicated that differential metabolites such as arginine and methionine were significantly negatively correlated with *Edwardsiella*, suggesting a potential mechanism by which YS mitigates the adverse effects of high soybean inclusion. Based on our findings, we recommend supplementing 1% YS in soybean meal-based diets with reduced fishmeal as an effective strategy to enhance growth and intestinal health in largemouth bass. To further validate the practical application of YS and elucidate its underlying mechanisms, future studies should: (i) conduct a full-scale growth trial to evaluate the long-term effects of YS on growth performance, feed utilization, and overall health under practical farming conditions; (ii) perform targeted challenge tests to verify the role of YS in improving disease resistance; and (iii) integrate metabolomic and microbiome analyses to clarify the key pathways through which YS modulates host metabolism and microbiota interactions. This study provides a new perspective for understanding the host-microbiota-metabolite interactions in high-plant-protein diets and offers theoretical and practical support for developing fishmeal replacement strategies to advance sustainable aquaculture of largemouth bass.The reference list from the paper itself. Each links out to its DOI / PubMed record.
- 1Fu L, Han D, Yi J, Zhang Z, Liu H, Jin J, et al. Effects of dietary yeast hydrolysate on the growth performance, intestine health and digestion of juvenile yellow catfish (Pelteobagrus vachelli ♂ × Pelteobagrus fulvidraco ♀). Aquacult Rep. 2023;29:101496. 10.1016/j.aqrep.2023.101496
- 2Yu Z, Zhang Z, Teame T, Guan L, Wang R, Zhu R, et al. Yeast cell wall extract as a strategy to mitigate the effects of aflatoxin B 1 and deoxynivalenol on liver and intestinal health, and gut microbiota of largemouth bass (Micropterus salmoides). Aquaculture. 2025;597:741917. 10.1016/j.aquaculture.2024.741917.
- 3Bai J, Li S. Development of largemouth bass (Micropterus salmoides) culture. In: Gui JF, Tang QS, Li ZJ, Liu JS, De Silva SS, editors. Aquaculture in China: Success stories and modern trends. Wiley & Sons Ltd. 2018. p. 421–9. 10.1002/9781119120759.ch 4_5.
- 4Romaní-Pérez M, Bullich-Vilarrubias C, López-Almela I, Liébana-García R, Olivares M, Sanz Y. The microbiota and the Gut–Brain axis in controlling food intake and energy homeostasis. Int J Mol Sci. 2021;22:5830. 10.3390/ijms 22115830.10.3390/ijms 22115830 PMC 819839534072450 · doi ↗ · pubmed ↗
- 5Fang H, Xie J, Liao S, Guo T, Xie S, Liu Y, et al. Effects of dietary inclusion of shrimp paste on growth performance, digestive enzymes activities, antioxidant and immunological status and intestinal morphology of hybrid snakehead (Channa maculata ♀ × Channa argus ♂). Front Physiol. 2019. 10.3389/fphys.2019.01027.10.3389/fphys.2019.01027 PMC 669335931440171 · doi ↗ · pubmed ↗
- 6Li C, Li X, Li P, Wei B, Zhang C, Zhu X, et al. Sodium humate alters the intestinal microbiome, short-chain fatty acids, eggshell ultrastructure, and egg performance of old laying hens. Front Vet Sci. 2022. 10.3389/fvets.2022.986562.10.3389/fvets.2022.986562 PMC 959720136311664 · doi ↗ · pubmed ↗
- 7Zhao J, Xu Q. Influence of soybean meal on intestinal mucosa metabolome and effects of adenosine monophosphate-activated protein kinase signaling pathway in mirror carp (Cyprinus carpio Songpu). Front Mar Sci. 2022. 10.3389/fmars.2022.844716.
- 8Zhao J, Yang X, Qiu Z, Zhang R, Xu H, Wang T. Effects of tributyrin and alanyl-glutamine dipeptide on intestinal health of largemouth bass (Micropterus salmoides) fed with high soybean meal diet. Front Immunol. 2023. 10.3389/fimmu.2023.1140678.10.3389/fimmu.2023.1140678 PMC 1023095237266423 · doi ↗ · pubmed ↗