Structure–efficiency relationship of access group antibiotics via SK chromatic descriptors
R. Rajambigai, T. Praveen, J. Ravi Sankar

TL;DR
This paper explores how SK chromatic descriptors can predict the properties of antibiotics using graph theory.
Contribution
The novel use of SK chromatic indices to model physicochemical properties of antibiotics is introduced.
Findings
SK chromatic indices effectively predict physicochemical properties of antibiotics.
Linear regression analysis links topological indices to molecular characteristics.
The study provides a new approach for drug development using graph theory.
Abstract
In graph theory, topological indices play a significant role as numerical descriptors of a graph, helping to summarize the physicochemical properties of a molecular graph. By capturing the molecular structure, they encode various aspects, including connectivity, complexity, molecular branching, and shape. Therefore, these indices are crucial in the initial stages of drug development for identifying potential drugs. In this study, quantitative structure–property relationship (QSPR) models were designed using SK chromatic indices to predict the physicochemical attributes of some access group antibiotics. Linear regression is used to analyze the physicochemical properties and the topological indices.
Genes, proteins, chemicals, diseases, species, mutations and cell lines named across the full text — each resolved to its canonical identifier and authoritative record.
Click any figure to enlarge with its caption.
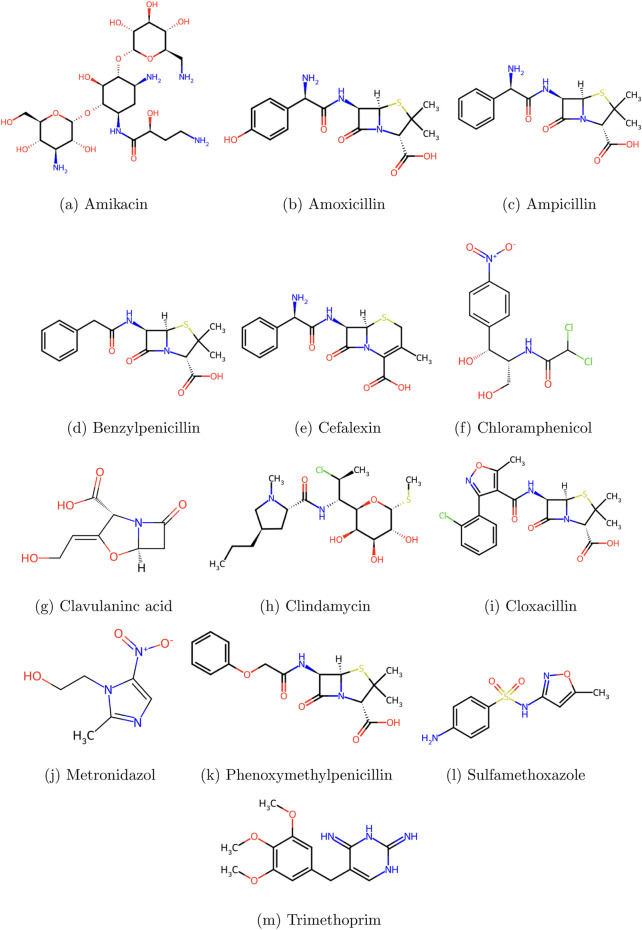 FIGURE 1
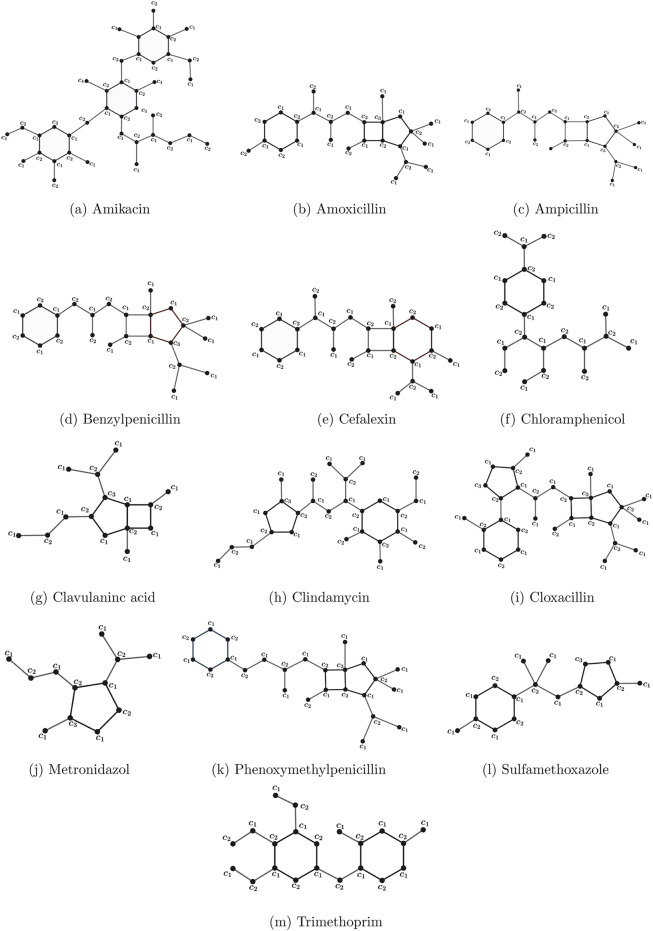 FIGURE 2
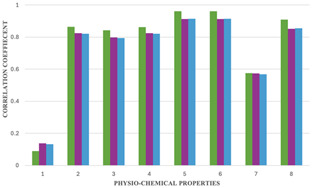 FIGURE 3
| Drug | Density | Boiling point | Enthalpy | Flash point | Molar refractivity | Polarizabiliy | Surface tension | Molar volume |
|---|---|---|---|---|---|---|---|---|
| Amikacin | 1.6 | 981.8 | 162.2 | 547.6 | 134.9 | 53.5 | 103.3 | 363.9 |
| Amoxicillin | 1.5 | 743.2 | 113.7 | 403.3 | 91.5 | 36.3 | 85.3 | 236.2 |
| Ampicillin | 1.5 | 683.9 | 105.4 | 367.4 | 89.9 | 35.7 | 74.3 | 239.3 |
| Benzylpenicillin | 1.4 | 663.3 | 102.5 | 355.0 | 86.3 | 34.2 | 67.9 | 235.2 |
| Cefalexin | 1.5 | 727.4 | 111.5 | 393.7 | 89.4 | 35.4 | 78.5 | 231.3 |
| Chloramphenicol | 1.5 | 644.9 | 100.0 | 343.8 | 72.6 | 28.8 | 66.1 | 208.8 |
| Clavulanic acid | 1.7 | 545.8 | 94.8 | 283.9 | 43.6 | 17.3 | 82.3 | 120.3 |
| Clindamycin | 1.3 | 628.1 | 106.5 | 333.6 | 107.9 | 42.8 | 56.2 | 327.2 |
| Cloxacillin | 1.6 | 689.7 | 106.2 | 370.9 | 106.2 | 42.1 | 79.2 | 279.3 |
| Metronidazole | 1.5 | 405.4 | 69.3 | 199.0 | 41.0 | 16.2 | 60.5 | 117.9 |
| Phenoxymethylpenicillin | 1.5 | 681.4 | 105.0 | 365.9 | 88.1 | 34.9 | 69.0 | 241.2 |
| Sulfamethoxazole | 1.5 | 482.1 | 74.7 | 245.4 | 62.5 | 24.8 | 70.9 | 173.1 |
| Trimethoprim | 1.3 | 405.2 | 65.7 | 198.8 | 75.5 | 29.9 | 45.7 | 220.8 |
| Chromatic topological index |
|
|
|
|---|---|---|---|
| Amikacin | 63 | 42 | 94.5 |
| Amoxicillin | 45 | 33 | 74.5 |
| Ampicillin | 41.5 | 30.5 | 68.25 |
| Benzylpenicillin | 41.5 | 30.5 | 68.25 |
| Cefalexin | 40.5 | 27 | 60.75 |
| Chloramphenicol | 30 | 20 | 45 |
| Clavulanic acid | 26.5 | 20.5 | 45.75 |
| Clindamycin | 44 | 31 | 70.5 |
| Cloxacillin | 54 | 40.5 | 91.5 |
| Metronidazole | 20 | 15 | 34.5 |
| Phenoxymethylpenicillin | 43.5 | 32 | 72.25 |
| Sulfamethoxazole | 28.5 | 20.5 | 46.25 |
| Trimethoprim | 33 | 22 | 49.5 |
| Density |
|
|
|
| Boiling point |
|
|
|
| Enthalpy |
|
|
|
| Flash point |
|
|
|
| Molar refractivity |
|
|
|
| Polarizability |
|
|
|
| Surface tension |
|
|
|
| Molar volume |
|
|
|
| Chromatic topological index | Density | Boiling point | Enthalpy | Flash point | Molar refractivity | Polarizability | Surface tension | Molar volume |
|---|---|---|---|---|---|---|---|---|
|
| 0.0882 |
|
|
|
|
| 0.5746 |
|
|
| 0.1380 |
|
|
|
|
| 0.5739 |
|
|
| 0.1322 |
|
|
|
|
| 0.5680 |
|
| Property | N | A | b |
|
| F | Indicator |
|---|---|---|---|---|---|---|---|
| Density | 13 | 1.459 | 0.001 | 0.0078 | 0.7731 | 0.087 | Non-significant |
| Boiling point | 13 | 189.2 | 11.36 | 0.7447 | 0.0001 | 32.08 | Significant |
| Enthalpy | 13 | 32.48 | 1.747 | 0.7095 | 0.0003 | 26.86 | Significant |
| Flash point | 13 | 68.23 | 6.871 | 0.7445 | 0.0001 | 32.06 | Significant |
| Molar refractivity | 13 | 0.659 | 2.109 | 0.9234 | 0.0000 | 132.5 | Significant |
| Polarizability | 13 | 0.230 | 0.836 | 0.9234 | 0.0000 | 132.6 | Significant |
| Surface tension | 13 | 44.37 | 0.707 | 0.3303 | 0.0399 | 5.425 | Significant |
| Molar volume | 13 | 17.05 | 5.411 | 0.8257 | 0.0000 | 52.17 | Significant |
| Property | N | A | b |
|
| F | Indicator |
|---|---|---|---|---|---|---|---|
| Density | 13 | 1.439 | 0.002 | 0.0191 | 0.6528 | 0.214 | Non-significant |
| Boiling point | 13 | 199.8 | 15.55 | 0.6798 | 0.0005 | 23.36 | Significant |
| Enthalpy | 13 | 34.77 | 2.368 | 0.6349 | 0.0011 | 19.13 | Significant |
| Flash point | 13 | 74.61 | 9.407 | 0.6798 | 0.0005 | 23.35 | Significant |
| Molar refractivity | 13 | 3.192 | 2.867 | 0.8311 | 0.0000 | 54.15 | Significant |
| Polarizability | 13 | 1.231 | 1.138 | 0.8314 | 0.0000 | 54.25 | Significant |
| Surface tension | 13 | 43.83 | 1.011 | 0.3286 | 0.0405 | 5.384 | Significant |
| Molar volume | 13 | 26.11 | 7.264 | 0.7249 | 0.0002 | 28.98 | Significant |
| Property | N | A | b |
|
| F | Indicator |
|---|---|---|---|---|---|---|---|
| Density | 13 | 1.441 | 0.001 | 0.0176 | 0.6662 | 0.197 | Non-significant |
| Boiling point | 13 | 200.8 | 6.885 | 0.6738 | 0.0006 | 22.72 | Significant |
| Enthalpy | 13 | 34.88 | 1.049 | 0.6303 | 0.0012 | 18.75 | Significant |
| Flash point | 13 | 75.24 | 4.164 | 0.6737 | 0.0006 | 22.72 | Significant |
| Molar refractivity | 13 | 2.890 | 1.277 | 0.8339 | 0.0000 | 55.23 | Significant |
| Polarizability | 13 | 1.112 | 0.507 | 0.8342 | 0.0000 | 55.33 | Significant |
| Surface tension | 13 | 44.05 | 0.445 | 0.3221 | 0.0431 | 5.227 | Significant |
| Molar volume | 13 | 24.99 | 3.241 | 0.7299 | 0.0002 | 29.72 | Significant |
| Drug | Density | Boiling point | Enthalpy | Flash point | Molar refractivity | Polarizability | Surface tension | Molar volume |
|---|---|---|---|---|---|---|---|---|
|
| 0.1160 | 81.7306 | 13.6715 | 49.4409 | 7.4429 | 2.9558 | 12.3310 | 30.2753 |
|
| 0.1154 | 91.2377 | 15.3054 | 55.1895 | 10.9908 | 4.3402 | 12.3372 | 38.0288 |
|
| 0.1155 | 92.1425 | 15.4069 | 55.7371 | 10.9120 | 4.3275 | 12.3989 | 37.6972 |
| Drug | Density (in |
|
|
|
|---|---|---|---|---|
| Amikacin |
| 1.51 | 1.52 | 1.52 |
| Amoxicillin |
| 1.49 | 1.50 | 1.50 |
| Ampicillin |
| 1.49 | 1.49 | 1.49 |
| Benzylpenicillin |
| 1.49 | 1.49 | 1.49 |
| Cefalexin |
| 1.49 | 1.49 | 1.49 |
| Chloramphenicol |
| 1.48 | 1.48 | 1.48 |
| Clavulanic acid |
| 1.48 | 1.48 | 1.48 |
| Clindamycin |
| 1.49 | 1.49 | 1.49 |
| Cloxacillin |
| 1.50 | 1.52 | 1.51 |
| Metronidazole |
| 1.48 | 1.47 | 1.47 |
| Phenoxymethylpenicillin |
| 1.49 | 1.49 | 1.49 |
| Sulfamethoxazole |
| 1.48 | 1.48 | 1.48 |
| Trimethoprim |
| 1.49 | 1.48 | 1.48 |
| Drug | Boiling point (at 760 mmHg) |
|
|
|
|---|---|---|---|---|
| Amikacin |
| 904.9 | 852.9 | 851.4 |
| Amoxicillin |
| 700.4 | 712.9 | 713.7 |
| Ampicillin |
| 660.6 | 674.0 | 670.7 |
| Benzylpenicillin |
| 660.6 | 674.1 | 670.7 |
| Cefalexin |
| 649.3 | 619.7 | 619.1 |
| Chloramphenicol |
| 530.0 | 510.8 | 510.6 |
| Clavulanic acid |
| 490.2 | 518.6 | 515.8 |
| Clindamycin |
| 689.0 | 681.9 | 686.2 |
| Cloxacillin |
| 802.6 | 829.6 | 830.8 |
| Metronidazole |
| 416.4 | 433.1 | 438.3 |
| Phenoxymethylpenicillin |
| 683.4 | 697.4 | 698.2 |
| Sulfamethoxazole |
| 512.9 | 518.6 | 519.2 |
| Trimethoprim |
| 564.1 | 541.9 | 541.6 |
| Drug | Enthalpy (KJ/mol) |
|
|
|
|---|---|---|---|---|
| Amikacin |
| 142.54 | 134.22 | 134.01 |
| Amoxicillin |
| 111.09 | 112.91 | 113.03 |
| Ampicillin |
| 104.98 | 106.99 | 106.47 |
| Benzylpenicillin |
| 104.98 | 106.99 | 106.47 |
| Cefalexin |
| 103.23 | 98.71 | 98.61 |
| Chloramphenicol |
| 84.89 | 82.13 | 82.09 |
| Clavulanic acid |
| 78.78 | 83.31 | 82.87 |
| Clindamycin |
| 109.35 | 108.18 | 82.09 |
| Cloxacillin |
| 126.82 | 130.67 | 130.86 |
| Metronidazole |
| 67.42 | 70.29 | 71.07 |
| Phenoxymethylpenicillin |
| 108.47 | 110.55 | 110.67 |
| Sulfamethoxazole |
| 82.27 | 83.31 | 83.39 |
| Trimethoprim |
| 90.13 | 86.87 | 86.81 |
| Drug | Flash point (in |
|
|
|
|---|---|---|---|---|
| Amikacin |
| 501.10 | 469.70 | 468.74 |
| Amoxicillin |
| 377.43 | 385.04 | 385.46 |
| Ampicillin |
| 353.38 | 361.52 | 359.43 |
| Benzylpenicillin |
| 353.38 | 361.52 | 359.43 |
| Cefalexin |
| 346.51 | 328.59 | 328.20 |
| Chloramphenicol |
| 274.36 | 262.75 | 262.62 |
| Clavulanic acid |
| 250.31 | 267.45 | 265.74 |
| Clindamycin |
| 370.55 | 366.23 | 368.80 |
| Cloxacillin |
| 439.26 | 455.59 | 456.25 |
| Metronidazole |
| 205.65 | 215.72 | 218.89 |
| Phenoxymethylpenicillin |
| 367.12 | 375.65 | 376.09 |
| Sulfamethoxazole |
| 264.05 | 267.45 | 267.83 |
| Trimethoprim |
| 294.97 | 281.56 | 281.36 |
| Drug | Molar refractivity (in |
|
|
|
|---|---|---|---|---|
| Amikacin |
| 133.53 | 123.61 | 123.57 |
| Amoxicillin |
| 95.56 | 97.80 | 98.03 |
| Ampicillin |
| 88.18 | 90.64 | 90.05 |
| Benzylpenicillin |
| 88.18 | 90.64 | 90.05 |
| Cefalexin |
| 86.07 | 80.60 | 80.47 |
| Chloramphenicol |
| 63.93 | 60.53 | 60.36 |
| Clavulanic acid |
| 56.55 | 61.97 | 61.31 |
| Clindamycin |
| 93.46 | 92.07 | 92.92 |
| Cloxacillin |
| 114.55 | 119.31 | 119.74 |
| Metronidazole |
| 42.84 | 46.19 | 46.95 |
| Phenoxymethylpenicillin |
| 92.40 | 94.94 | 95.15 |
| Sulfamethoxazole |
| 60.77 | 61.97 | 61.95 |
| Trimethoprim |
| 70.26 | 66.27 | 66.10 |
| Drug | Polarizability (in |
|
|
|
|---|---|---|---|---|
| Amikacin |
| 52.96 | 49.03 | 49.01 |
| Amoxicillin |
| 37.89 | 38.79 | 38.87 |
| Ampicillin |
| 34.96 | 35.94 | 35.70 |
| Benzylpenicillin |
| 34.96 | 35.94 | 35.70 |
| Cefalexin |
| 34.12 | 31.96 | 31.90 |
| Chloramphenicol |
| 25.34 | 23.99 | 23.92 |
| Clavulanic acid |
| 22.41 | 24.56 | 24.29 |
| Clindamycin |
| 37.05 | 36.51 | 36.84 |
| Cloxacillin |
| 45.42 | 47.32 | 47.48 |
| Metronidazole |
| 16.97 | 18.30 | 18.59 |
| Phenoxymethylpenicillin |
| 36.64 | 37.65 | 37.73 |
| Sulfamethoxazole |
| 24.08 | 24.56 | 24.55 |
| Trimethoprim |
| 27.85 | 26.27 | 26.19 |
| Drug | Surface tension (in |
|
|
|
|---|---|---|---|---|
| Amikacin |
| 88.92 | 86.29 | 86.09 |
| Amoxicillin |
| 76.19 | 77.19 | 77.19 |
| Ampicillin |
| 73.72 | 74.67 | 74.41 |
| Benzylpenicillin |
| 73.72 | 74.67 | 74.41 |
| Cefalexin |
| 73.01 | 71.13 | 71.08 |
| Chloramphenicol |
| 65.59 | 64.05 | 64.07 |
| Clavulanic acid |
| 63.11 | 64.56 | 64.40 |
| Clindamycin |
| 75.49 | 75.17 | 75.42 |
| Cloxacillin |
| 82.56 | 84.78 | 84.76 |
| Metronidazole |
| 58.51 | 58.99 | 59.39 |
| Phenoxymethylpenicillin |
| 75.13 | 76.18 | 76.19 |
| Sulfamethoxazole |
| 64.53 | 64.56 | 64.63 |
| Trimethoprim |
| 67.71 | 66.07 | 66.07 |
| Drug | Molar volume (in |
|
|
|
|---|---|---|---|---|
| Amikacin |
| 357.94 | 331.19 | 331.27 |
| Amoxicillin |
| 260.55 | 265.82 | 266.44 |
| Ampicillin |
| 241.61 | 247.66 | 246.19 |
| Benzylpenicillin |
| 241.61 | 247.66 | 246.19 |
| Cefalexin |
| 236.19 | 222.24 | 221.88 |
| Chloramphenicol |
| 179.38 | 171.39 | 170.84 |
| Clavulanic acid |
| 160.44 | 175.02 | 173.27 |
| Clindamycin |
| 255.13 | 251.29 | 253.48 |
| Cloxacillin |
| 309.24 | 320.30 | 321.54 |
| Metronidazole |
| 125.27 | 135.07 | 136.80 |
| Phenoxymethylpenicillin |
| 252.43 | 258.56 | 259.15 |
| Sulfamethoxazole |
| 171.26 | 175.02 | 174.89 |
| Trimethoprim |
| 195.61 | 185.92 | 185.42 |
Peer Reviews
No public reviews on file for this paper yet. If you reviewed it on a platform where reviews are public (OpenReview, ICLR, NeurIPS, ICML), you can paste yours below so the community can read it here.
Videos
No videos yet. Explain this paper in a talk, walkthrough, or lecture? Add one.
Taxonomy
TopicsComputational Drug Discovery Methods · Graph theory and applications · Graph Labeling and Dimension Problems
Introduction
The AWaRe classification system was introduced by the World Health Organization (WHO) to guide the appropriate use of antibiotics and to prevent the development of antimicrobial resistance in the human body (World Health Organization, 2025). This system was launched in 2017 and is revised every 2 years. Antibiotics are classified into three groups, namely, Access, Watch, and Reserve, based on the priority in which they should be used (Cook and Wright, 2022). Access group antibiotics are first-line treatments used for common infections. These antibiotics are highly accessible, widely available, affordable, and have a high success rate. Watch group antibiotics are used only for specific infections and require careful monitoring. Reserve group antibiotics are used only as a last resort to treat life-threatening infections. Among all these groups, access to antibiotics is considered an important aspect because of their safe and effective clinical use. To gain a deeper understanding of access group antibiotics, we must comprehend their molecular and structural properties.
The chemical graph is a branch of graph theory that studies the molecular structure of drugs by transforming them into a molecular graph (Chartrand and Zhang, 2009). The molecular or chemical graph of a drug is a graph in which the vertices represent the atoms, and the edges between them represent the bonds connecting the atoms in the specific drug (Gao et al., 2016). Hydrogen atoms are neglected in the construction of molecular graphs, and the chemical bonds, irrespective of the multiplicity, are represented as single edges, thus forming simple underlying hydrogen-depleted graphs that focus on connectivity-based structural features. With the help of this, different topological indices are calculated to determine diverse features of molecular topology with an encrypted numerical parameter (Hayat and Asmat, 2023). Thus, topological indices are commonly used in the QSPR and QSAR analysis of different drugs (Lučić and Trinajstić, 1997). Wiener introduced the first topological index, the Wiener index, in 1947 (Wiener, 1947). It was first used to determine the physical characteristics of paraffin. Thereafter, other dimensions of topological indices were discovered, including the Randic index, the hyper-Wiener index, the connectivity index, and the Zagreb index, which have numerous applications in various fields (Gutman, 2013).
In recent years, topological indices have played a significant role in QSPR and QSAR investigations (Arockiaraj et al., 2024; Balasubramaniyan et al., 2024; Kour and Sankar, 2025). Much research has been done to find the use of chemical graph theory in QSPR analysis. Hakeem et al. (2024) studied the QSPR relationships among heart attack drugs through simple linear regression models using degree-based topological indices (Abdul et al., 2024). Parveen et al. (2022) analyzed some diabetes treatment drugs using a regression model and degree-based indices. Hosamani et al. (2017) used certain degree-based topological indices for QSPR analysis. Adnan et al. (2022) employed some degree-based topological indices to analyze some anti-tuberculosis drugs. Zhang et al. (2023) focused on computing regression models of some anti-malarial drugs using degree-based topological indices. Simran Kour et al. discussed a selection of tricyclic antidepressant drugs and anti-cancer drugs by a range of distance-based topological indices to understand their characteristics by integrating machine learning regression techniques (Kour and J., 2024; Kour and Sankar, 2025). Pandeeswari and Ravi Sankar (2025) compared two regression techniques to find the accuracy of their prediction by insighting topological indices into breast cancer drugs. Clement Johnson et al. used a zero divisor graph to find graph energy from its adjacency matrix and the Wiener index associated with the commutative rings from the zero divisor graph (Johnson and Sankar, 2023; Rayer and Jeyaraj, 2023). Sankar and Felix (2016) proposed a developed fuzzy decision-making trial and evaluation laboratory (DEMATEL) method and examined its effectiveness through some real-life applications. QSPR analysis using chromatic topological indices is a developing topic (Bommahalli Jayaraman and Balamurugan, 2025). Waqar Ali et al*.* introduced lower and extremal bounds for the second hyper-Zagreb and atom connectivity indices in trees with a fixed Roman domination number (Ali et al., 2025; Ali et al., 2024). Our research focuses on the molecular structures of access group antibiotics, which are hydrogen-depleted simple underlying molecular graphs. We are interested in the structural and functional properties of these compounds, and chromatic SK indices are used to analyze them (Shigehalli and Kanabur, 2016). The aim of the study is to evaluate the chromatic topological SK indices using proper colorings of 13 access group antibiotics, compute regression models to derive QSPR on the basis of the physicochemical properties, and validate the reliability of the models by comparing the measured values to the real ones. We obtain the topological descriptors of chemical graphs, characterize their molecular properties and correlations, and demonstrate the efficacy of this methodology to various classes of therapeutics.
Materials and methods
Thirteen access group antibiotics were chosen for examination in this work, and their physicochemical characteristics were obtained from the PubChem (National Center for Biotechnology Information (NCBI), 2024) and ChemSpider databases (ChemSpider, 2025). Table 1 provides a comprehensive list of these medications together with their physicochemical characteristics, obtained from ChemSpider. Figure 1 displays the chemical structures of these medications, which were also obtained from ChemSpider. Figure 2 shows the proper coloring of the molecular graphs, which are constructed by treating the atoms in the molecule as vertices and the bonds between them as edges connecting their vertices using GeoGebra.
Access group antibiotics: (a) amikacin, (b) amoxicillin, (c) ampicillin, (d) benzylpenicillin, (e) cefalexin, (f) chloramphenicol, (g) clavulanic acid, (h) clindamycin, (i) cloxacillin, (j) metronidazole, (k) phenoxymethylpenicillin, (l) sulfamethoxazole, and (m) trimethoprim.
Proper coloring of molecular graphs of access group antibiotics: (a) amikacin, (b) amoxicillin, (c) ampicillin, (d) benzylpenicillin, (e) cefalexin, (f) chloramphenicol, (g) clavulanic acid, (h) clindamycin, (i) cloxacillin, (j) metronidazole, (k) phenoxymethylpenicillin, (l) sulfamethoxazole, and (m) trimethoprim.
SK chromatic indices
The formula was introduced in our earlier unpublished work (Rajambigai, 2024)1.
In the Equations 1-3, and are colors in the set of colors and denotes the edges having the colors and . Table 2 shows computed values of the SK chromatic indices of the 13 access group antibiotics by calculating the values of the respective values and substituting in the above formula.
Results
The eight physicochemical properties mentioned in Table 1 are used in this study. The resulting formula is used to determine correlations between relevant chromatic topological indices and various physicochemical characteristics of access group antibiotics. The linear regression model employed in this article is
In the above formula, represents the physicochemical properties of the listed drugs, is the calculated chromatic topological index values of the respective drugs, is a constant term, and is the regression coefficient. The values of and are computed via SPSS software and Microsoft Excel by evaluating the physicochemical properties and the chromatic topological index values across the 13 access group antibiotics. Here, the physicochemical properties of the drugs are considered as dependent values, and the chromatic topological indices of the molecular graphs of the access group antibiotics are considered as independent variables. By applying Equation 4, the linear regression model for the previously mentioned chromatic topological indices is expressed in Table 3.
Relationship between correlation coefficients and physicochemical properties of the drugs
In this study, the correlations of the chromatic SK indices and the eight physicochemical properties are listed in Table 4; the correlations that are strong are highlighted in bold, and the relationship is graphically represented in Figure 3. The correlation coefficients were generated to assess the link between molecular characteristics and chromatic topological indices. All statistical computations, including the calculation of correlation coefficients, were performed using Microsoft Excel (Microsoft Corporation).
Graphical representation between correlation coefficients and physiochemical properties of the drugs.
Assessment of statistical metrics and standard estimation error
The statistical metrics are integrated for all chromatic topological indices and physicochemical properties in Tables 5–7 to help us understand the relationship among them. The statistical parameters for all the chromatic topological indices, including the sample size , the constant term , the slope , the percentage of dependent variables , Fisher’s statistic, the significance value , and the significance of the relationship, are observed. In terms of interpretation, a -value less than 0.05 is deemed statistically significant; a -value greater than 0.05 is considered an absence of statistical significance. These metrics not only allow comparisons but also give well-informed calculations. Table 8 lists the standard estimation error for the physicochemical properties of the access group antibiotics. The calculation of standard estimation error improves the accuracy of predictions from QSPR models. Tables 9–16 show the comparison between the original and calculated values of physicochemical properties from regression models of the SK chromatic indices.
TABLE 5: Statistical metrics integrated into the QSPR modeling framework for the SKϕ index.
TABLE 6: Statistical metrics integrated into the QSPR modeling framework for the SK1ϕ index.
TABLE 7: Statistical metrics integrated into the QSPR modeling framework for the SK2ϕ index.
Discussion
In this study, we investigated the correlation between the three chromatic topological indices and eight physicochemical properties of 13 access group antibiotics. The data listed in Table 3 show the correlation coefficients, especially the strong correlations ( are highlighted in bold) noted between three chromatic topological indices and six physicochemical attributes. Upon examining all, the index illustrated the strongest correlation with the following properties: boiling point , enthalpy , flash point , molar refractivity , polarizability , and molar volume , which shows that this chromatic topological index may be an effective predictor of these molecular properties. On the other hand, all the chromatic topological indices show weak correlation with density, thus having a trivial impact on this physicochemical property.
The QSPR analysis using the statistical attributes such as , -statistic, -value, and regression coefficient are listed in Tables 5–7. Both molar refractivity and polarizability show strong dependency on the index . Notably, molar refractivity has , , and with the index, and polarizability has , , and with the index. Similarly, the molar volume, boiling point, flash point, and enthalpy show moderate dependency on . Molar volume has , , and with the index. Boiling point has , , and with the index. Flash point has , , and with the index, and enthalpy has , , and with the index. The density and surface tension show weak dependency. This analysis shows that the values of the chromatic SK index are necessary to understand the property of interest, such as polarizability, which helps elucidate the intermolecular forces and supports designing models with specific dielectric properties, thus playing a crucial role in model development.
Similarly, the values of the chromatic SK index for predicting molar refractivity and enthalpy can also be used for drug design, although the estimated error is slightly high. Because density and surface tension have a weak correlation, more advanced techniques may be needed, such as non-linear models or hybrid modeling, for more accuracy. Therefore, the study demonstrates the need to modify QSPR models to define physicochemical attributes to improve predictions and guide future work.
Conclusion
Three coloring-based topological indices have been used to characterize the structural attributes of some access group antibiotics. QSPR analysis has also been done on the spatial arrangement of atoms and the physicochemical characteristics of certain drugs. It is found that some chromatic topological indices are effective at predicting properties, such as polarizability, molar refractivity, and enthalpy. Therefore, the study shows that molecular structure plays an important role in determining the properties of certain drugs, indicating that chromatic topological indices are necessary for predicting such properties. This technique helps speed drug development by enabling efficient identification of suitable drugs, thereby minimizing the need for research facilities.
The reference list from the paper itself. Each links out to its DOI / PubMed record.
- 1Abdul H. Muhammad Katbar N. Muhammad F. Ahmed N. (2024). Qspr analysis of some important drugs used in heart attack treatment via degree-based topological indices and regression models. Polycycl. Aromat. Compd. 44 (8), 5237–5246. 10.1080/10406638.2023.2262697 · doi ↗
- 2Adnan Mr Abbas G. Iqbal T. (2022). Degree-based topological indices and qspr analysis of antituberculosis drugs. J. Chem. (1), 5748626. 10.1155/2022/5748626 · doi ↗
- 3Ali W. Husin M. N. Nadeem M. F. (2024). Extremal bounds of the atom-bond connectivity index in trees with a fixed roman domination number. Malaysian J. of Math. Sci. 19(4): 1197–1210.
- 4Ali W. Nazri Husin M. Nadeem M. F. Jabin M. (2025). Lower bound for the second hyper-zagreb index of trees with a given roman domination number. Math. Statistics 13, 12–16. 10.13189/ms.2025.130102 · doi ↗
- 5Arockiaraj M. Campena F. J. H. Greeni A. B. Ghani M. U. Gajavalli S. Tchier F. (2024). Qspr analysis of distance-based structural indices for drug compounds in tuberculosis treatment. Heliyon 10 (2), e 23981. 10.1016/j.heliyon.2024.e 23981 38293487 PMC 10827473 · doi ↗ · pubmed ↗
- 6Balasubramaniyan D. Chidambaram N. Ravi V. Siddiqui M. K. (2024). Qspr analysis of anti-asthmatic drugs using some new distance-based topological indices: a comparative study. Int. J. Quantum Chem. 124 (9), e 27372. 10.1002/qua.27372 · doi ↗
- 7Bommahalli Jayaraman B. Balamurugan B. J. (2025). Qspr graph model to explore physicochemical properties of potential antiviral drugs of dengue disease through novel coloring-based topological indices. Front. Chem. 13, 1599715. 10.3389/fchem.2025.1599715 40900986 PMC 12400515 · doi ↗ · pubmed ↗
- 8Chartrand G. Zhang P. (2009). Chromatic Graph Theory. Hoboken, NJ: Wiley-Interscience