Microbial and metabolomic profiling of the upper respiratory tract in children with asthma
Lina Xu, Qianjun Wan, Quying Yang, Wenxin Shen, Yinfang Dai, Huiquan Sun, Li Huang, Meijuan Wang, Wujun Jiang, Chuangli Hao

TL;DR
This study explores how the upper respiratory tract microbiome and metabolome differ in children with asthma compared to healthy children, and how these differences relate to lung function.
Contribution
The study identifies specific microbial genera and metabolites, such as L-carnitine, that correlate with lung function in children with asthma.
Findings
URT microbiota diversity is lower in acute asthma compared to chronic asthma and healthy controls.
L-carnitine is a potential biomarker for asthma with high accuracy (AUC > 0.9).
Metabolic pathways like arginine biosynthesis and central carbon metabolism are altered in asthmatic children.
Abstract
This study aimed to investigate characteristic changes in the upper respiratory tract (URT) microbiome and metabolome in children with asthma and explore their associations with lung function. Children with asthma aged 6 years and above admitted to the Children’s Hospital of Soochow University from December 2022 to December 2023 comprised the study group. Age-matched healthy children undergoing physical examinations in the Department of Child Health were recruited as controls. Throat swabs were collected for microbiome detection using 16S rDNA sequencing and metabolomics analysis using liquid chromatography-mass spectrometry (LC–MS). (1) Significant differences in alpha and beta diversity were observed among the control group (H), chronic persistent asthma group (CA), and acute exacerbation group (AA). In both CA and AA groups, FVC% predicted (FVC%/Pred) and FEV1% predicted…
Genes, proteins, chemicals, diseases, species, mutations and cell lines named across the full text — each resolved to its canonical identifier and authoritative record.
Click any figure to enlarge with its caption.
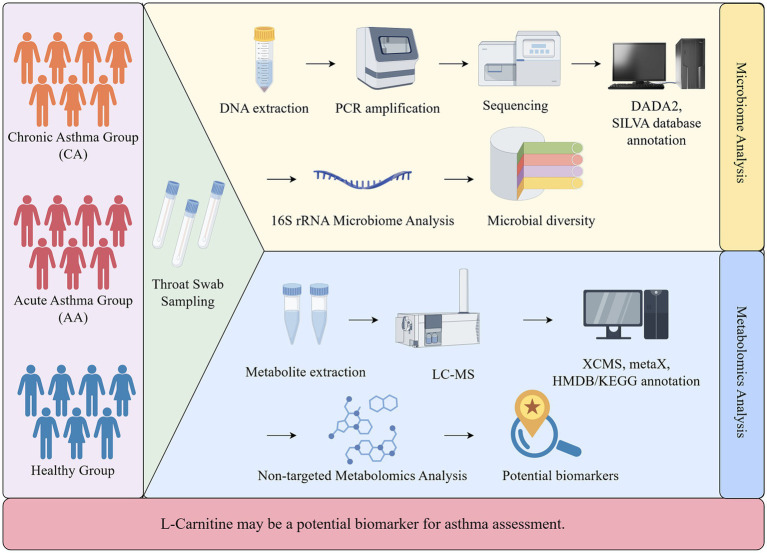 Figure 1
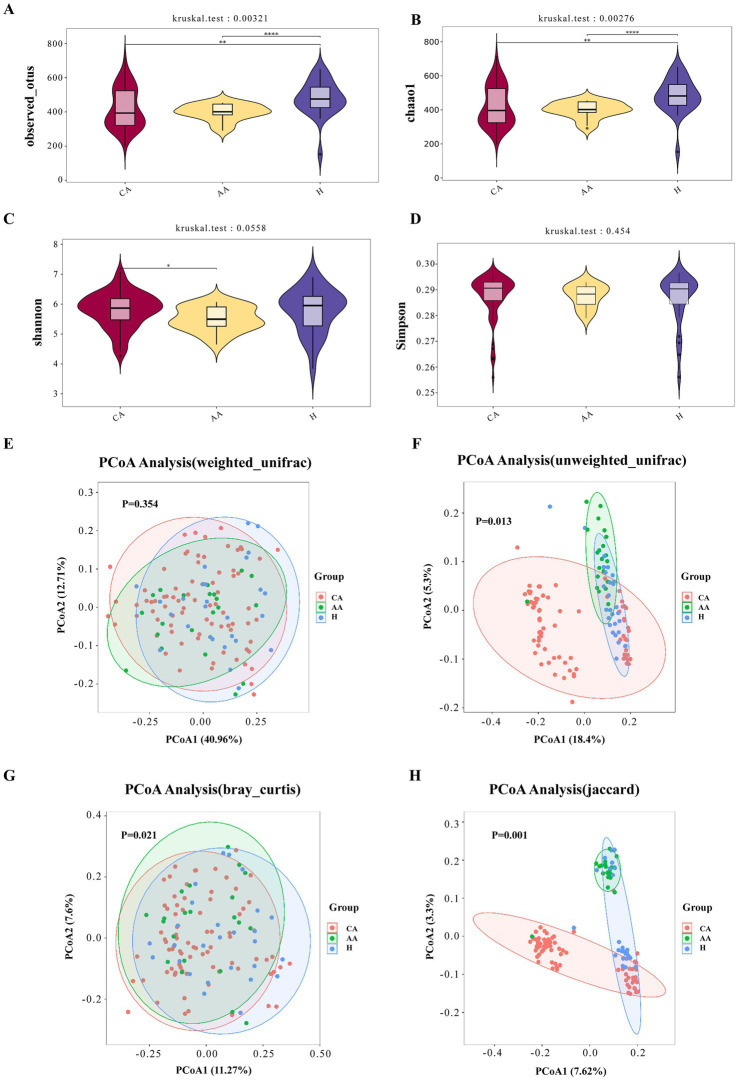 Figure 2
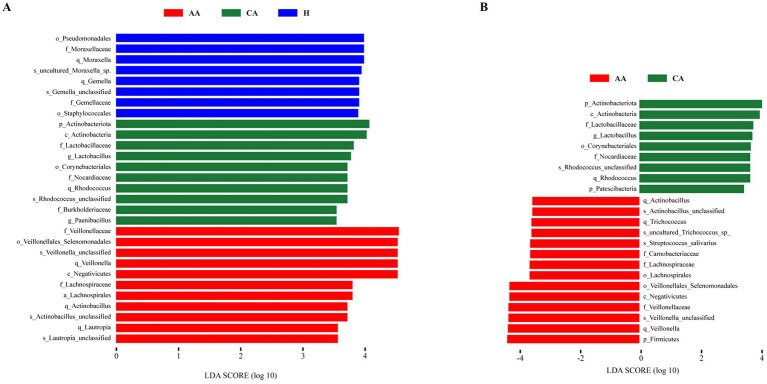 Figure 3
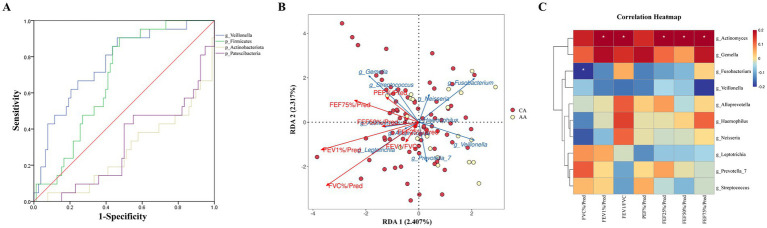 Figure 4
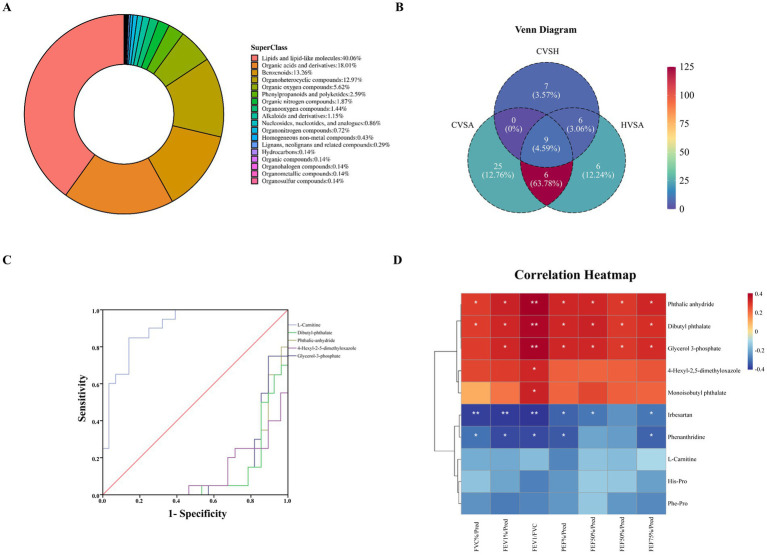 Figure 5
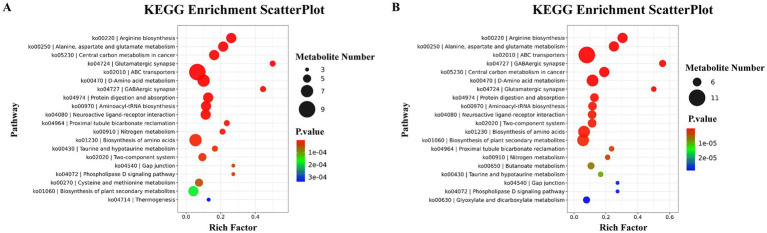 Figure 6
| Metabolite name | SuperClass | FC | Regulation |
| VIP |
|---|---|---|---|---|---|
| L-carnitine | Organic nitrogen compounds | 0.23 | Down | <0.001 | 1.41 |
| Dibutyl phthalate | Benzenoids | 11.05 | Up | <0.001 | 2.84 |
| Phthalic anhydride | – | 12.37 | Up | <0.001 | 3.02 |
| 4-Hexyl-2,5-dimethyloxazole | Organ heterocyclic compounds | 6.46 | Up | <0.001 | 1.59 |
| Glycerol 3-phosphate | Lipids and lipid-like molecules | 11.92 | Up | <0.001 | 3.01 |
| Phenanthridine | – | 0.29 | Down | <0.001 | 1.31 |
| Monoisobutyl phthalate | Benzenoids | 8.14 | Up | <0.001 | 2.27 |
| Phe-Pro | Organic acids and derivatives | 0.30 | Down | <0.001 | 1.12 |
| Irbesartan | Benzenoids | 0.42 | Down | <0.001 | 1.17 |
| His-Pro | Organic acids and derivatives | 0.11 | Down | <0.001 | 1.77 |
Peer Reviews
No public reviews on file for this paper yet. If you reviewed it on a platform where reviews are public (OpenReview, ICLR, NeurIPS, ICML), you can paste yours below so the community can read it here.
Videos
No videos yet. Explain this paper in a talk, walkthrough, or lecture? Add one.
Taxonomy
TopicsGut microbiota and health · Metabolomics and Mass Spectrometry Studies · Asthma and respiratory diseases
Introduction
Bronchial asthma, a heterogeneous respiratory disease characterized by chronic airway inflammation and reversible airflow obstruction, has shown an alarming increase in pediatric prevalence over the past three decades (Yang et al., 2024). The pathogenesis of asthma involves complex interactions among genetic susceptibility, environmental exposures, and microbial dysbiosis; however, its underlying mechanisms remain incompletely understood.
The upper respiratory tract (URT) microbiome, as an essential part of the mucosal ecosystem, plays a vital role in airway development, immune modulation, and protection against pathogens (Man et al., 2017; Lupu et al., 2023). Recent studies highlight its importance in asthma pathogenesis, yet most investigations have focused mainly on microbial composition (e.g., diversity, abundance) (Park et al., 2014), rather than functional metabolic activity. To complement taxonomic data, metabolomics, a comprehensive analysis of small-molecule metabolites, offers direct insight into host–microbe interactions and microbial function (Cobos-Uribe and Rebuli, 2023).
School-age children represent a critical population for URT microbiome studies, as their immune systems are still developing and they are typically exposed to specific environments such as schools, which together shape characteristic patterns of microbial colonization in the upper airway (Resztak et al., 2023; Rutter et al., 2025). Although the gut microbiota and adult respiratory microbiota have been studied extensively (Kullberg et al., 2021), the interplay between the URT microbiome and the metabolome in pediatric asthma remains largely unexplored, especially regarding its association with lung function.
Therefore, this study employed 16S rRNA sequencing and LC–MS–based metabolomics to comprehensively profile the URT microbial and metabolic features among children with chronic persistent asthma (CA), acute exacerbation (AA), and healthy controls (H), aiming to elucidate microbe–metabolite interactions associated with disease severity and airway dysfunction.
Methods
Patients and clinical information
School-age children (≥6 years) diagnosed with bronchial asthma according to the Global Initiative for Asthma (GINA 20221) guidelines were enrolled from the Children’s Hospital of Soochow University between December 2022 and December 2023. Asthmatic participants were stratified into chronic persistent (CA) and acute exacerbation (AA) groups based on GINA criteria. Age-matched healthy controls (H) were recruited from the Child Health Department during routine physical examinations.
The inclusion criteria were: (1) Age ≥ 6 years; (2) Confirmed asthma diagnosis per GINA guidelines; (3) Absence of systemic infectious diseases; (4) Ability to cooperate with throat swab collection.
The exclusion criteria were: (1) Respiratory infection symptoms or signs within 7 days; (2) Recent contact (≤7 days) with individuals with respiratory infections; (3) Positive etiological tests results during clinical visits; (4) Antibiotic or other treatment within 2 weeks; (5) Comorbidities (cardiac, pulmonary, hepatic, renal, thyroid, neurological, autoimmune, or malignant diseases); (6) ICU admission for asthma exacerbation within the past year.
Demographic data (gender, age, medical history), medication use, treatment duration, and lung function parameters were recorded. The study protocol was approved by the Institutional Review Board of Soochow University (approval no. 2018KS009), and written informed consent was obtained from all guardians.
Throat swab collection was performed as follows: (1) Participants fasted for ≥1 h prior to sampling; (2) Using sterile swabs, the bilateral palatine arches and posterior pharynx were firmly swabbed 2–3 times, with avoidance of the tongue or buccal mucosa; (3) Swabs were immediately placed in cryotubes and flash-frozen in liquid nitrogen.
**Due to the low-biomass nature of pediatric throat swab specimens, untargeted metabolomic profiling was feasible only for a subset of samples.
Lung function tests
Spirometry was performed using a Jaeger Masterscreen Pneumo system (CareFusion, Germany) according to ATS/ERS guidelines. Participants abstained from caffeine-containing beverages on the test day. Measurements were obtained in triplicate with the participants seated, wearing a nose clip, and using a disposable mouthpiece. Acceptability required a variation of <5% or 100 mL variation between the two highest forced vital capacity (FVC) maneuvers. The following parameters were recorded: Forced Expiratory Volume in 1 s (FEV₁), Forced Vital Capacity (FVC), FEV₁/FVC ratio, Forced Expiratory Flow at 25–75% of predicted value (FEF25–75%pred), Peak Expiratory Flow (PEF), and Maximal Expiratory Flow at 50% of FVC (MEF50%). Percent predicted values (e.g., FEV₁%pred, FVC%pred, FEF25–75%pred) were calculated based on reference equations for Chinese children. All tests were performed by trained technicians, and quality control followed ATS/ERS standards.
Microbiome detection (16S rDNA sequencing) and bioinformatic processing
Total microbial DNA from throat swabs was extracted using the CTAB method following standardized procedures. DNA integrity and purity were assessed by agarose gel electrophoresis and NanoDrop spectrophotometry (Thermo Fisher Scientific), and DNA concentrations were quantified using the Qubit dsDNA High-Sensitivity Assay (Thermo Fisher Scientific). The V3–V4 hypervariable region of the 16S rRNA gene was amplified using primers 341F (5′-CCTAYGGGRBGCASCAG-3′) and 806R (5′-GGACTACNNGGGTATCTAAT-3′). PCR products were purified with AMPure XP beads, quantified using Qubit, pooled in equimolar concentrations, and then sequenced on an Illumina NovaSeq 6000 platform (2 × 250 bp paired-end).
Raw paired-end reads were demultiplexed and processed using QIIME2 (v2021.11). Adapter and primer sequences were removed using Cutadapt. Quality filtering, denoising, and amplicon sequence variant (ASV) inference were performed using the DADA2 plugin. Based on per-base quality profiles, the first 10 low-quality bases were trimmed from both forward and reverse reads (trimLeft = 10/10), and forward and reverse reads were truncated at 240 bp and 200 bp, respectively (truncLen = 240/200). Reads with more than two expected errors (maxEE = 2), Phred quality scores below 20, or remaining length <200 bp after trimming were removed. Samples were retained only if ≥80% of bases achieved Q30. Chimeric sequences were identified and removed using the consensus-based removeBimeraDenovo method. Singleton ASVs and extremely low-abundance features were excluded according to standard practice to minimize sequencing noise.
Taxonomic classification of ASVs was conducted using the QIIME2 naïve Bayes classifier trained on the SILVA 138 reference database trimmed to the V3–V4 region (confidence threshold: 70%). Non-bacterial and unclassified ASVs were excluded before downstream analysis. Alpha diversity indices (Chao1, Shannon) were calculated from rarefied ASV tables. Beta diversity was computed using Bray–Curtis dissimilarity and weighted and unweighted UniFrac distance matrices and visualized by principal coordinates analysis (PCoA). Global community differences were assessed using PERMANOVA with 999 permutations.
Differentially enriched taxa were identified using LEfSe with an LDA score threshold of >3.5. To account for the compositional nature of sequencing data, differential analysis was further validated using ANCOM-BC with Benjamini–Hochberg false discovery rate correction (FDR < 0.05). Only taxa consistently identified across both methods were considered robust (Takai and Horikoshi, 2000; Walters et al., 2016).
Untargeted metabolomics by LC–MS
Throat-swab extracts from a subset of participants (CA n = 28; AA n = 20; H n = 27) were subjected to untargeted metabolomic profiling. Within this metabolomics-eligible sample pool, a stratified random sampling strategy was applied according to clinical groups (CA, AA, and H) to minimize potential selection bias. Sample selection was conducted prior to data analysis and was independent of microbiome profiles or clinical outcomes. After thawing on ice, 20 μL of each sample was extracted with 120 μL of pre-cooled 50% methanol, vortexed for 1 min, incubated for 10 min at room temperature, and precipitated at −20 °C overnight. Following centrifugation (4,000 × g, 20 min, 4 °C), supernatants were collected and stored at −80 °C until analysis. A pooled QC sample was prepared by mixing aliquots of all samples.
Metabolite separation was performed on an ACQUITY UPLC T3 column (100 × 2.1 mm, 1.8 μm) with a mobile-phase gradient of water (5 mM ammonium acetate + 5 mM acetic acid) and acetonitrile at a flow rate of 0.3 mL/min. Mass spectrometry was conducted on a SCIEX TripleTOF 6600 in positive and negative ESI modes (m/z 60–1,200), using information-dependent acquisition with a dynamic exclusion of 4 s. QC samples were injected every 10 runs.
Raw data were processed using XCMS for peak detection, retention-time alignment, and deconvolution (centWave; ppm = 30; peakwidth = 5–25 s; snthresh = 6). Batch effects and signal drift were corrected using QC-based robust LOESS signal correction. Features with >50% missing values in QC samples or >80% missing values within any group were excluded. Metabolite annotation was performed by accurate mass and MS/MS spectral matching against HMDB (v5.0) and KEGG compound databases, using a mass tolerance of ±10 ppm and MS/MS similarity ≥0.8.
After probabilistic quotient normalization and log transformation, PCA and PLS-DA were used to evaluate metabolic separation among groups. Differential metabolites were identified using VIP > 1.0, fold change >1.5 or <0.67, and Benjamini–Hochberg–adjusted p < 0.05. Enriched metabolic pathways were analyzed using the KEGG database (release 2023) via hypergeometric testing with FDR correction (Figure 1). PLS-DA and VIp values for metabolomic analysis were calculated using the ropls or equivalent multivariate analysis framework.
Study design and flow chart.
Statistical analysis
Clinical data were analyzed using SPSS 27.0 (IBM, United States). Continuous variables with non-normal distribution are presented as median (IQR) and compared using the Kruskal–Wallis test. Categorical variables are presented as counts (%) and compared using the χ^2^ test or Fisher’s exact test, as appropriate. A two-sided P value <0.05 was considered statistically significant. Multiple testing correction was performed using the Benjamini–Hochberg false discovery rate (FDR) where applicable.
Results
Characteristic analysis of upper respiratory microbiome
Study population
A total of 99 participants were included in the microbiome analysis: 78 with CA, 21 with AA, and 27 with H. No significant differences were observed in gender, age, or BMI across groups (p > 0.05, Supplementary Table S1). Lung function indices were significantly lower in the AA group than in the CA group (p < 0.01; Supplementary Table S2).
Microbial community composition
Analysis of the top 30 most abundant species revealed distinct compositional profiles at the phylum and genus levels across groups (Supplementary Figure S2). At the phylum level (Supplementary Figure S2A), Firmicutes, Proteobacteria, Bacteroidota, Fusobacteriota, and Actinobacteriota were the dominant phyla in all groups. Notably, the proportion of Firmicutes was significantly higher in the AA group (46.33%) compared to the H group (41.34%) (Kruskal-Wallis p < 0.05). At the genus level (Supplementary Figure S2E), Streptococcus, Neisseria, Veillonella, and Prevotella predominated. While the relative abundance of Streptococcus was similar across groups, the abundance of Veillonella was significantly higher in AA (14.74%) than in CA (8.84%) and H (7.31%; p < 0.05).
Alpha diversity analysis
Analysis of α-diversity indices revealed significant differences (Figures 2A–D). Both Observed OTUs (richness) and Chao1 (estimated richness) were significantly lower in the CA and AA groups compared to the H group (p < 0.05; Figures 2A,B). Observed OTUs (mean ± SD): H, 480.67 ± 101.51; CA, 397.33 ± 47.26; AA, 419.69 ± 116.24. Chao1: H, 483.87 ± 101.89; CA, 421.45 ± 116.98; AA, 399.09 ± 47.35. While the Shannon (diversity) and Simpson (dominance) indices did not differ significantly among all three groups (p > 0.05; Figures 2C,D), a statistically significant reduction in the Shannon index was observed in the AA group (5.49 ± 0.41) compared to the CA group (5.79 ± 0.59) (p < 0.05; Figure 2C).
*(A) Observed OTUs index among the CA, AA, and H groups. (B) Chao1 index among the CA, AA, and H groups. (C) Shannon index among the CA, AA, and H groups. (D) Simpson index among the CA, AA, and H groups. (E) PCoA based on weighted UniFrac distance of upper respiratory tract microbiota among the CA, AA, and H groups. (F) PCoA based on unweighted UniFrac distance of upper respiratory tract microbiota among the CA, AA, and H groups. (G) PCoA based on Bray–Curtis distance of upper respiratory tract microbiota among the CA, AA, and H groups. (H) PCoA based on Jaccard distance of upper respiratory tract microbiota among the CA, AA, and H groups. The P-values obtained from the rank sum test for all groups in the figure are shown above, where the significant differences between two groups are represented by *indicating p <0.05, **indicating p <0.01, and ***indicating p<0.001.
Beta diversity analysis
Using four distance metrics—weighted UniFrac, unweighted UniFrac, Bray-Curtis, and Jaccard—we compared sample distributions among the control group, chronic persistent asthma group, and acute exacerbation group. Additionally, Anosim (Analysis of similarities) was applied for similarity analysis. Significant intergroup differences (p < 0.05) were detected using unweighted UniFrac, Bray-Curtis, and Jaccard distances, but not using weighted UniFrac (p > 0.05; Figure 2).
Differential species analysis
LEfSe analysis identified taxa significantly enriched in each group (LDA score > 3.5; Figures 3A,B). Comparing all three groups (Figure 3A), the H group exhibited higher abundances of Pseudomonadales, Moraxellaceae, Moraxella, unclassified Moraxella, and Gemella. The CA group was enriched in Actinobacteriota, Actinobacteria, Lactobacillaceae, Lactobacillus, and Corynebacteriales. The AA group was characterized by higher abundances of Veillonellaceae, Veillonellales-Selenomonadales, unclassified Veillonella, Veillonella, and Negativicutes. Direct comparison between CA and AA groups (Figure 3B) confirmed the significant enrichment of Firmicutes, Veillonella, unclassified Veillonella, Veillonellaceae, and Negativicutes in AA, alongside depletion of Actinobacteriota, Actinobacteria, Lactobacillaceae, and Lactobacillus.
Panel A shows the LEfSe analysis of differential taxa among the AA, CA, and H groups, and Panel B shows the LEfSe analysis of differential taxa between the CA and AA groups.
Integration of microbiome data with clinical parameters
Using LEfSe to analyze species differences between AAand CAgroups, we selected the top 10 most abundant URT microbiota with significant differences at the phylum and genus levels to establish an asthma severity assessment model and plotted the ROC curve. Veillonella exhibited the highest diagnostic accuracy (AUC = 0.766; Figure 4A). Cross-validated ROC analysis confirmed Veillonella as a robust biomarker for asthma exacerbations (AUC = 0.76, 95% CI: 0.68–0.84).
Associations between upper respiratory tract microbiota and lung function. (A) ROC curve of upper respiratory tract microbiota with significant differences in species at the phylum and genus levels and abundance in the top 10. (B) RDA analysis chart of upper respiratory tract microbiota and lung function test results in the top 10 levels of average abundance in CA and AA groups. (C) Spearman analysis chart of upper respiratory tract microbiota and lung function test results in the top 10 levels of average abundance in the chronic duration group and acute exacerbation group of asthma.
Through species analysis, we selected the top 10 most abundant URT microbiota at the genus level in the CA and AA groups and conducted RDA analysis with lung function test results: RDA1 explained 2.41% of the variance, and RDA2 explained 2.32%. The envfit test showed that FVC%/Pred and FEV1%/Pred were negatively correlated with the abundance of URT microbiota (RDA1 = −0.88, P < 0.01; RDA1 = −0.96, P < 0.01), while other indicators showed no statistical association with URT microbiota (Figure 4B).
Likewise, species analysis of the top 10 most abundant URT microbiota at the genus level in the CA and AA groups was performed, followed by Spearman correlation analysis with lung function test results: Actinobacillus abundance was positively correlated with FEV1%/Pred, FEV1/FVC, FEF25%/Pred, FEF50%/Pred, and FEF75%/Pred (r = 0.21, p < 0.05; r = 0.21, p < 0.05; r = 0.21, p < 0.05; r = 0.24, p < 0.05; r = 0.22, p < 0.05); Fusobacterium abundance was negatively correlated with FVC%/Pred (r = −0.24, p < 0.05); no statistically significant correlations were observed between other URT genera and lung function indicators (Figure 4C).
Metabolomics characteristic analysis
Clinical characteristics
The study enrolled 48 participants: 28 in CA group (median age: 10 years; male/female ratio: 16/12), 20 in AA group (median age: 9 years; male/female ratio: 11/9), and 27 H groups (median age: 9 years; male/female ratio: 16/11). No significant differences were observed in gender, age, BMI, or living environment across groups (p > 0.05; Supplementary Table S3). Lung function indices were significantly lower in the AA group compared to the CA group (P < 0.05; Supplementary Table S4).
Metabolomics profile analysis
Untargeted metabolomics identified 803 metabolites (372 in positive ion mode; 431 in negative ion mode), 694 (86.4%) of which were annotated using the HMDB. Lipid and lipid-like molecules constituted the largest category (40.06%, 278 metabolites), followed by organic acids and derivatives (18.01%, 125 metabolites) and benzene-related compounds (13.26%, 92 metabolites) (Figure 5A).
Metabolite profiles and clinical relevance in asthma. (A) Metabolite classification proportion chart. (B) Venn plot of differential metabolites among comparison groups. (C) ROC curve of the top 5 metabolites with differences between CA and AA group. (D) Spearman analysis chart of the top 10 differential metabolites and lung function test results in the chronic duration group and acute exacerbation group of asthma.
Screening of differential metabolites and analysis of lung function results
Differential Abundance: Venn analysis of differential metabolites (p < 0.05, |log₂FC| ≥ 0.26, VIP ≥ 1.0) identified 164 differentiating H group vs. AA group, 22 for H group vs. CA group, and 159 for CA group vs. AA group, with 9 shared across all comparisons (Figure 5B; Supplementary Table S6). Among the top 5 differential metabolites, L-carnitine exhibited the highest diagnostic power for asthma assessment (AUC = 0.91, 95% CI: 0.85–0.97; sensitivity 85.7%, specificity 85%; Figure 5C).
The top 10 differential metabolites (Table 1) in the CA and AA groups of asthma were selected for Spearman analysis with lung function test results, and an analysis chart was plotted. The results are shown below (Figure 5D): Dibutyl phthalate: Strongest correlation with FEV1/FVC (r = 0.39, p < 0.01) and significant associations with six other parameters (FVC%/Pred, FEV1%/Pred, PEF%/Pred, FEF25%/Pred, FEF50%/Pred, FEF75%/Pred; r = 0.28–0.33, all p < 0.05). Glycerol 3-phosphate: Positively correlated with FEV1%/Pred (r = 0.32, p = 0.03) and FEV1/FVC (r = 0.39, p < 0.01). Phthalic anhydride: Highest correlation with FEV1/FVC (r = 0.40, p < 0.01) across seven lung function indices. Negative correlations: Irbesartan showed strong inverse associations with FEV1%/Pred (r = −0.40, p < 0.01) and FEV1/FVC (r = −0.40, p < 0.01). Phenanthridine: Negatively correlated with FEV1%/Pred (r = −0.37, p = 0.01) and PEF%/Pred (r = −0.34, p = 0.02) (Figure 5D).
Analysis of pathways for differential metabolite enrichment
KEGG pathway enrichment analysis highlighted arginine biosynthesis (p = 3.1 × 10^−9^) and alanine-aspartate–glutamate metabolism (p = 1.1 × 10^−^8) as the most significantly altered pathways in AA vs. H (Figure 6A). Between CA and AA, arginine metabolism remained the core pathway (p = 2.6 × 10^−11^, Figure 6B), suggesting its persistent role in asthma progression.
KEGG enrichment pathway analysis bubble chart. (A) KEGG pathway enrichment analysis of differential metabolites between the AA group and H group. (B) KEGG pathway enrichment analysis of differential metabolites between the CA group and AA group.
Discussion
Asthma is a heterogeneous respiratory disease characterized by chronic airway inflammation and reversible airflow obstruction (Hammad and Lambrecht, 2021; Kuruvilla et al., 2019). Despite extensive research, the functional interplay between the respiratory microbiota and host metabolism in pediatric asthma remains incompletely understood. Our study employs a dual-omics approach to characterize the upper respiratory microbiome and metabolome in school-age children across the CA, AA, and H groups.
URT microbiome alterations: reduced diversity, shifting composition, and functional correlations
In this study of the oropharyngeal microbiome in asthma, we observed distinct ecological collapse in acute asthma, evidenced by reduced microbial richness (Observed OTUs, Chao1) and destabilized community structure (decreased Shannon index in AA vs. CA), which is consistent with previous studies (Park et al., 2014; Galeana-Cadena et al., 2023). Crucially, we observed a statistically significant decrease in the Shannon diversity index in the AA group compared to CA group (p < 0.05), suggesting that the bacterial community structure is more unstable during the AA phase. The excessive proliferation of dominant bacteria (e.g., Veillonella) may outcompete symbiotic bacteria for resources, thereby exacerbating ecological imbalance (Mejias and Ramilo, 2020). Beta diversity analysis further confirmed distinct microbial community compositions among the groups, with the AA microbiota showing the least similarity to both CA and H, underscoring significant restructuring during acute episodes. Multiple studies have reported differences in the lung and gut microbiomes between individuals with established asthma and healthy subjects, with the former exhibiting lower bacterial diversity (Zheng et al., 2022; Valverde-Molina and García-Marcos, 2023).
LEfSe analysis identified Veillonella as significantly enriched in AA group and correlated with exacerbation risk (AUC = 0.76), whereas Lactobacillus was depleted in the CA group. Our combined interpretation reveals critical functional associations between specific microbial shifts and metabolic dysregulation. Veillonella spp. are known to produce short-chain fatty acids (SCFAs), including propionate (Scheiman et al., 2019; Mashima et al., 2021). Although SCFAs can exert immunomodulatory effects, elevated propionate in the context of airway inflammation has been linked to the activation of the NLRP3 inflammasome, promoting IL-1β release and potentially skewing immune responses toward a Th17 phenotype—associated with neutrophilic inflammation and steroid resistance (Wang et al., 2024). This pro-inflammatory milieu is consistent with the heightened inflammation and poorer lung function observed in our AA group. The depletion of Lactobacillus in the chronic phase may indicate a loss of beneficial commensals with known immunomodulatory properties, such as promoting regulatory T-cell (Treg) responses and maintaining epithelial barrier integrity—potentially contributing to a dysregulated pro-inflammatory/anti-inflammatory balance in AA (Shen and Wong, 2016; Zhang et al., 2025).
Building on the observed microbial dysbiosis, we identified specific genus-level associations between URT taxa and lung function parameters, directly linking URT taxa to functional impairment: Actinobacillus abundance was positively correlated with FEV1%/Pred, FEV1/FVC, and small airway indices (FEF25-75%/Pred), whereas Fusobacterium abundance was negatively correlated with FVC%/Pred. Although the precise functional roles of these genera within the pediatric URT asthmatic niche require further investigation, these correlations directly link specific microbial signatures to the degree of airway obstruction.
Metabolic dysregulation: L-carnitine depletion and arginine pathway centrality
To explore the functional significance of these microbial changes, we further characterized the metabolomic profiles. Most strikingly, L-carnitine emerged as a highly discriminatory metabolite, being significantly depleted in the AA group compared to the CA group, with exceptional diagnostic performance (AUC = 0.91). L-carnitine is essential for mitochondrial fatty acid β-oxidation (FAO), a crucial energy-generating process, and also plays a role in modulating inflammation and oxidative stress (Shumakova et al., 2022). Reduced L-carnitine levels may reflect impaired mitochondrial energetics and a metabolic shift toward glycolysis, a phenomenon commonly observed in inflammatory states, which could contribute to airway inflammation and functional impairment during acute asthma exacerbations. Intriguingly, the concurrent enrichment of Veillonella and depletion of L-carnitine raises the hypothesis that Veillonella overgrowth may influence host carnitine metabolism or compete for metabolically relevant substrates. Veillonella is known to utilize lactate and other host-derived metabolites, and its expansion may divert metabolic resources involved in carnitine synthesis or utilization. Although direct mechanistic evidence is currently lacking, this potential microbe–metabolite interaction warrants further investigation as a contributor to energy dysregulation and inflammation in acute asthma. Although the present study identified the concurrent enrichment of Veillonella and depletion of L-carnitine, a formal microbiome–metabolome integration (e.g., correlation or multivariate integrative analysis) was not performed. This was because microbiome and metabolomic data were not systematically paired across participants, and only a limited number of individuals contributed specimens to both analyses. Importantly, formal integrative modeling on non-paired datasets would be methodologically inappropriate and could lead to spurious associations. Nevertheless, the consistent co-occurrence of these microbial and metabolic alterations supports a plausible microbial–metabolic link that warrants validation in future studies employing fully paired multi-omics designs (Yuan et al., 2022; Wang et al., 2023). These interpretations should therefore be considered hypothesis-generating rather than evidence of direct causality.
Metabolomics pathway enrichment consistently highlighted arginine biosynthesis and metabolism as central and persistently dysregulated pathways (significantly enriched in AA vs. H and CA vs. AA groups). Furthermore, downstream effects of altered arginine metabolism are profound. Reduced arginine bioavailability, potentially exacerbated by dysbiotic microbiota (e.g., shifts in Streptococcus/Prevotella influencing local nitrogen cycling), can impact nitric oxide (NO) synthesis. Imbalance in NO production, mediated by inducible NOS (iNOS/NOS2) upregulation during inflammation, contributes to airway hyperreactivity, oxidative stress, and epithelial damage–key features reflected in the observed lung function impairments (e.g., reduced FEV1/FVC, FEF25-75%) (Maarsingh et al., 2009).
Furthermore, the strong correlations between environmental metabolites such as dibutyl phthalate/phthalic anhydride and diminished lung function parameters (FVC%pred, FEV1%pred, FEF25-75%pred) underscore the impact of exogenous factors. These pollutants likely induce ferroptosis and oxidative stress, synergizing with microbial and endogenous metabolic dysregulation to worsen airway obstruction and small airway function (Li et al., 2024; Lin et al., 2022). The observed negative correlation between overall microbial abundance (RDA1) and FVC%pred may reflect a loss of beneficial commensals or simple ecological collapse under severe inflammation, contributing to functional decline. Our data suggest that URT microbial dysbiosis (e.g., shifts in dominant taxa like Streptococcus/Prevotella/Veillonella, which can influence local nitrogen cycling and metabolite production) may contribute to this arginine pathway dysregulation, creating a detrimental feedback loop between microbes and host metabolism. These plasticizers are known environmental pollutants linked to asthma development and exacerbation (Mizgerd, 2006; Eales et al., 2022; Gao et al., 2022). Their mechanisms likely involve induction of oxidative stress, promotion of ferroptosis (a form of regulated cell death), and direct pro-inflammatory effects on the airway epithelium and immune cells (Lin et al., 2022). Their presence in the URT metabolome and association with worse lung function underscores the significant contribution of environmental exposures, which may synergize with endogenous microbial and metabolic dysregulation to worsen airway obstruction.
Limitations
Several limitations of this study should be acknowledged. First, the sample size for metabolomic analysis, particularly in the AA group (n = 20), was modest. Importantly, untargeted metabolomics requires substantially higher sample input and metabolite abundance than 16S rRNA gene sequencing, which limits its applicability in low-biomass specimens such as pediatric throat swabs and explains why fewer samples were available for metabolomic analysis compared with microbiome profiling. This imbalance may reduce statistical power and limit the generalizability of metabolomic findings. Second, microbiome and metabolomic data were not systematically paired across participants, which limited the feasibility of formal multi-omics integration analyses. Third, the cross-sectional design precludes causal inference. Longitudinal studies tracking microbiome and metabolome dynamics before, during, and after asthma exacerbations are needed. Finally, throat swabs primarily reflect the oropharyngeal microbiota and may not fully represent the lower airway environment; more invasive sampling approaches could provide deeper insights but are less feasible in pediatric populations.
Conclusion
- The abundance and structure of the URT microbiota in children with asthma exhibit specific alterations, with the URT microbiota diversity being lower in those with acute asthma compared to those with chronic persistent asthma.
- At the genus level, specific URT bacterial genera (Actinobacillus, Fusobacterium) showed correlations with lung function parameters, including FEV1%/Pred, FEV1/FVC, FEF25%/Pred, FEF50%/Pred, and FEF75%/Pred.
- The differential metabolite L-carnitine may serve as a potential biomarker for asthma assessment. Metabolic pathways such as arginine biosynthesis, alanine-aspartate–glutamate metabolism, and D-amino acid metabolism may be involved in the pathogenesis of asthma.
The reference list from the paper itself. Each links out to its DOI / PubMed record.
- 1Cobos-Uribe C. Rebuli M. E. (2023). Understanding the functional role of the microbiome and metabolome in asthma. Curr Allergy Asthma Rep 23, 67–76. doi: 10.1007/s 11882-022-01056-9, 36525159 PMC 12340730 · doi ↗ · pubmed ↗
- 2Eales J. Bethel A. Galloway T. Hopkinson P. Morrissey K. Short R. E. . (2022). Human health impacts of exposure to phthalate plasticizers: an overview of reviews. Environ. Int. 158:106903. doi: 10.1016/j.envint.2021.106903, 34601394 · doi ↗ · pubmed ↗
- 3Galeana-Cadena D. Gómez-García I. A. Lopez-Salinas K. G. Irineo-Moreno V. Jiménez-Juárez F. Tapia-García A. R. . (2023). Winds of change a tale of: asthma and microbiome. Front. Microbiol. 14:1295215. doi: 10.3389/fmicb.2023.1295215, 38146448 PMC 10749662 · doi ↗ · pubmed ↗
- 4Gao D. Zou Z. Li Y. Chen M. Ma Y. Chen L. . (2022). Association between urinary phthalate metabolites and dyslipidemia in children: results from a Chinese cohort study. Environ. Pollut. 295:118632. doi: 10.1016/j.envpol.2021.118632, 34906593 · doi ↗ · pubmed ↗
- 5Hammad H. Lambrecht B. N. (2021). The basic immunology of asthma. Cell 184, 2521–2522. doi: 10.1016/j.cell.2021.04.019, 33930297 · doi ↗ · pubmed ↗
- 6Kullberg R. F. J. Haak B. W. Abdel-Aziz M. I. Davids M. Hugenholtz F. Nieuwdorp M. . (2021). Gut microbiota of adults with asthma is broadly similar to non-asthmatics in a large population with varied ethnic origins. Gut Microbes 13:1995279. doi: 10.1080/19490976.2021.1995279, 34743654 PMC 8583066 · doi ↗ · pubmed ↗
- 7Kuruvilla M. E. Lee F. E. Lee G. B. (2019). Understanding asthma phenotypes, endotypes, and mechanisms of disease. Clin. Rev. Allergy Immunol. 56, 219–233. doi: 10.1007/s 12016-018-8712-1, 30206782 PMC 6411459 · doi ↗ · pubmed ↗
- 8Li X. Li Z. Ye J. Ye W. (2024). Association between urinary phthalate metabolites and chronic obstructive pulmonary disease: a cross-sectional study. Int. J. Chron. Obstruct. Pulmon. Dis. 19, 1421–1431. doi: 10.2147/COPD.S 459435, 38948906 PMC 11212814 · doi ↗ · pubmed ↗