Clinical validation of perfusion imaging with pulmonary function test data using Voronoi-based discretization
Jorge Cisneros, Caleb J Herrera, Yi-Kuan Liu, Lisa V Du, Yevgeniy Vinogradskiy, Richard Castillo, Girish Nair, Edward Castillo

TL;DR
This paper introduces a new method using Voronoi diagrams to better analyze lung perfusion images and link them to standard lung function tests.
Contribution
The novel contribution is a Voronoi-based framework that improves the correlation between perfusion imaging and pulmonary function tests.
Findings
Voronoi discretization yields stronger Spearman correlations (0.636–0.843) between perfusion maps and PFT measures.
The method reliably distinguishes normal from abnormal lung function with AUC values of 0.865–0.937.
It preserves local spatial variability, enabling meaningful comparisons between SPECT and CT-P maps.
Abstract
Objective. Accurate lung function assessment is essential for diagnosing and managing diseases like chronic obstructive pulmonary disorder, pulmonary emboli, and lung cancer. Single-photon emission computed tomography (SPECT) provides valuable 3D functional imaging of ventilation and perfusion, but is limited by low spatial resolution, availability, additional radiation, and cost. Alternative methods, including CT-based perfusion (CT-P) and deep learning models, require large datasets to validate results that are often scarce. Pulmonary function tests (PFTs) offer rapid and noninvasive global lung function measures and are clinically widely used. While ventilation correlates well with PFTs, perfusion imaging presents challenges due to complex blood flow and difficulty summarizing 3D data into one value. Additionally, commonly employed percentile scaling removes absolute quantitative…
Genes, proteins, chemicals, diseases, species, mutations and cell lines named across the full text — each resolved to its canonical identifier and authoritative record.
Click any figure to enlarge with its caption.
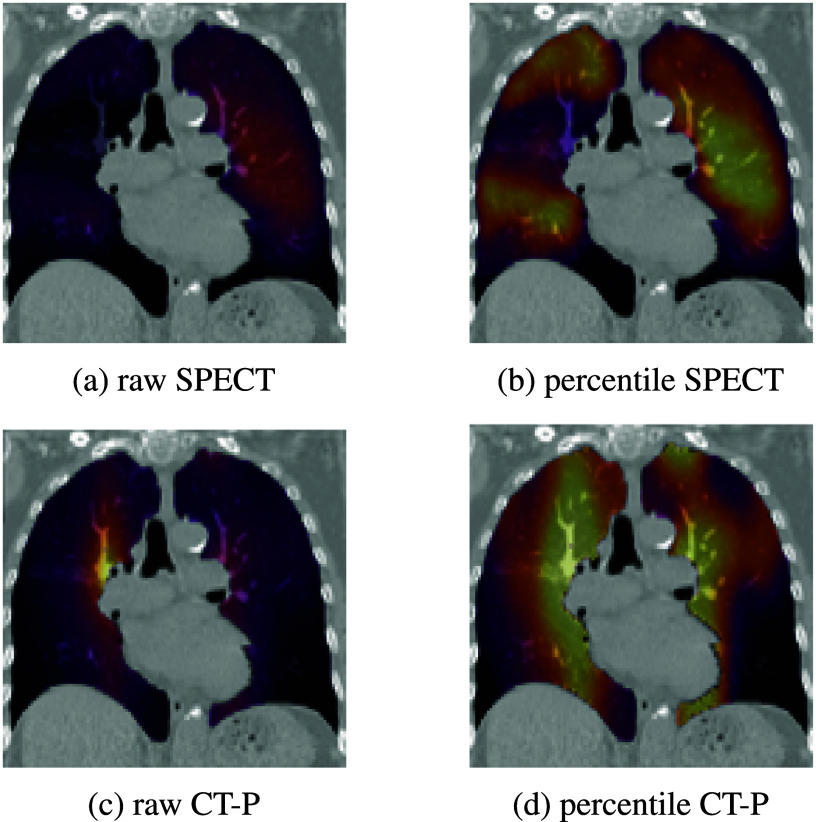 Figure 1
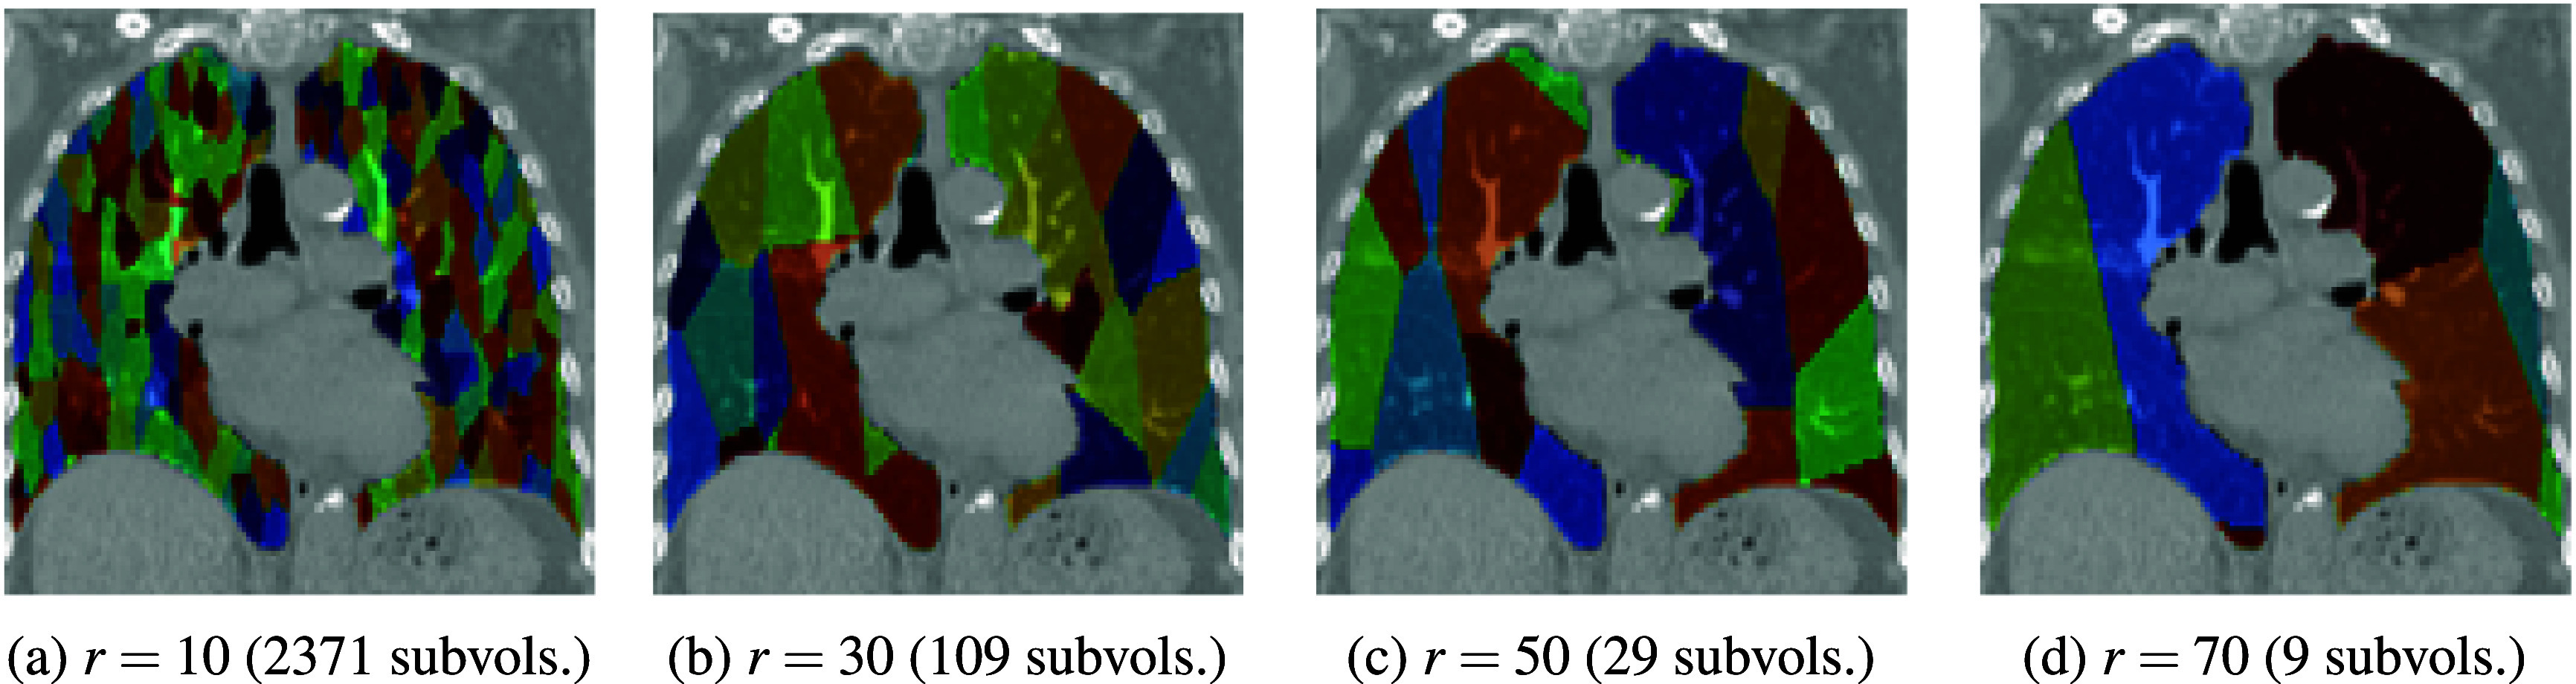 Figure 2
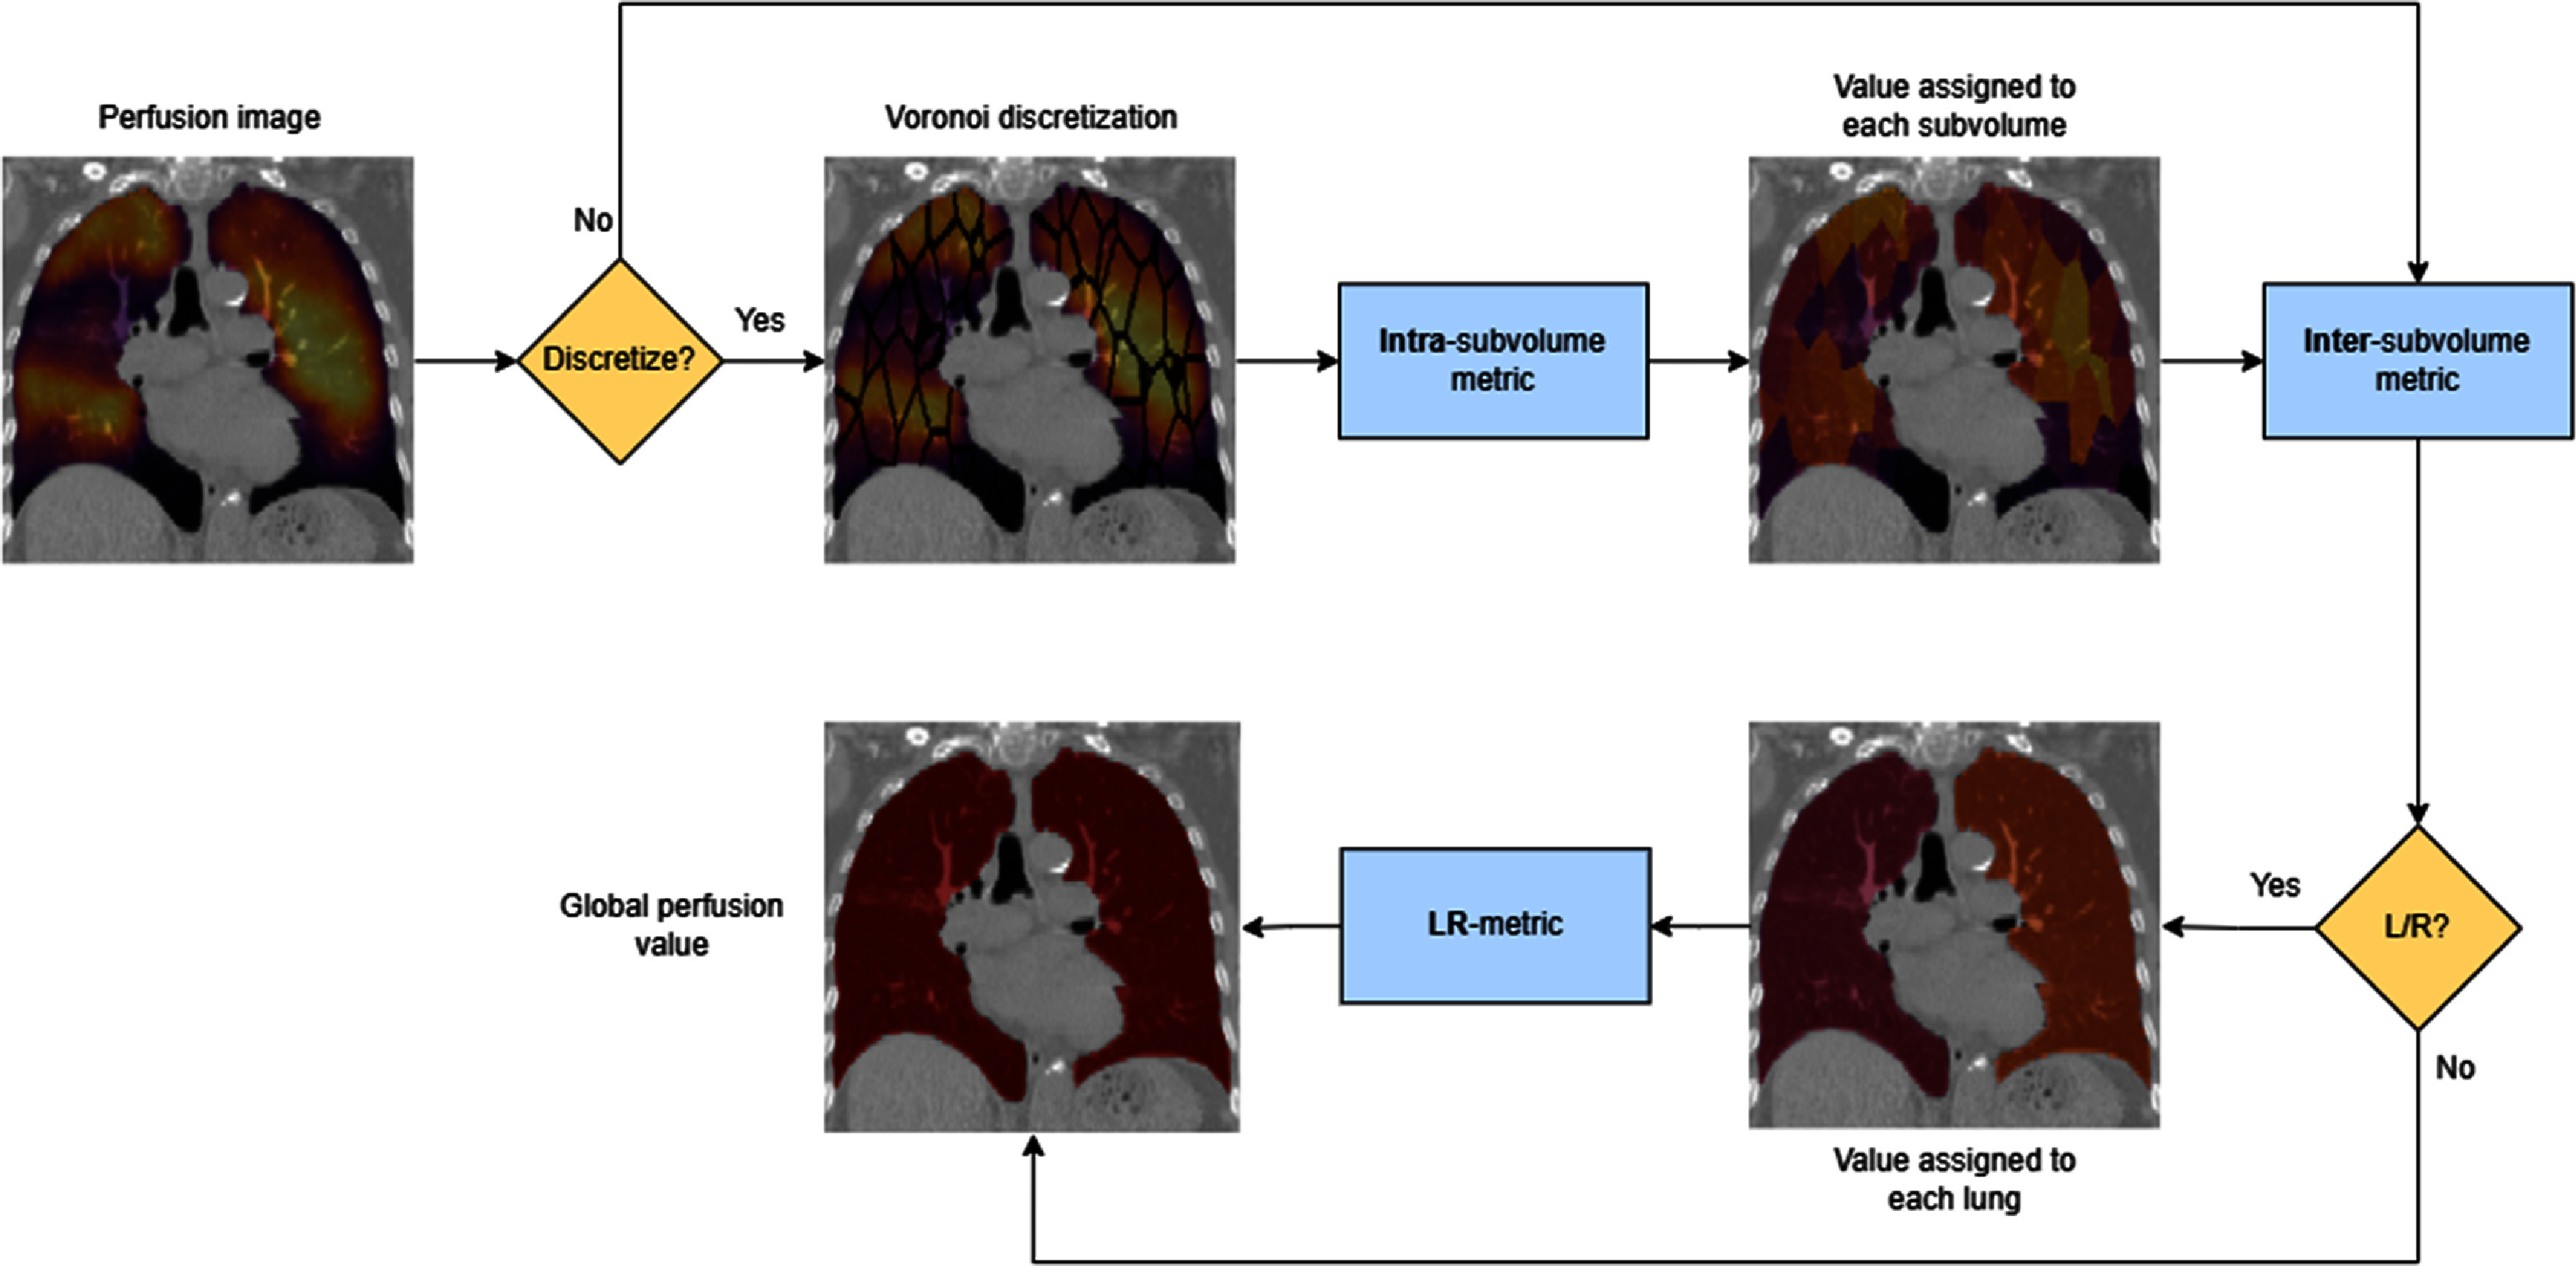 Figure 3
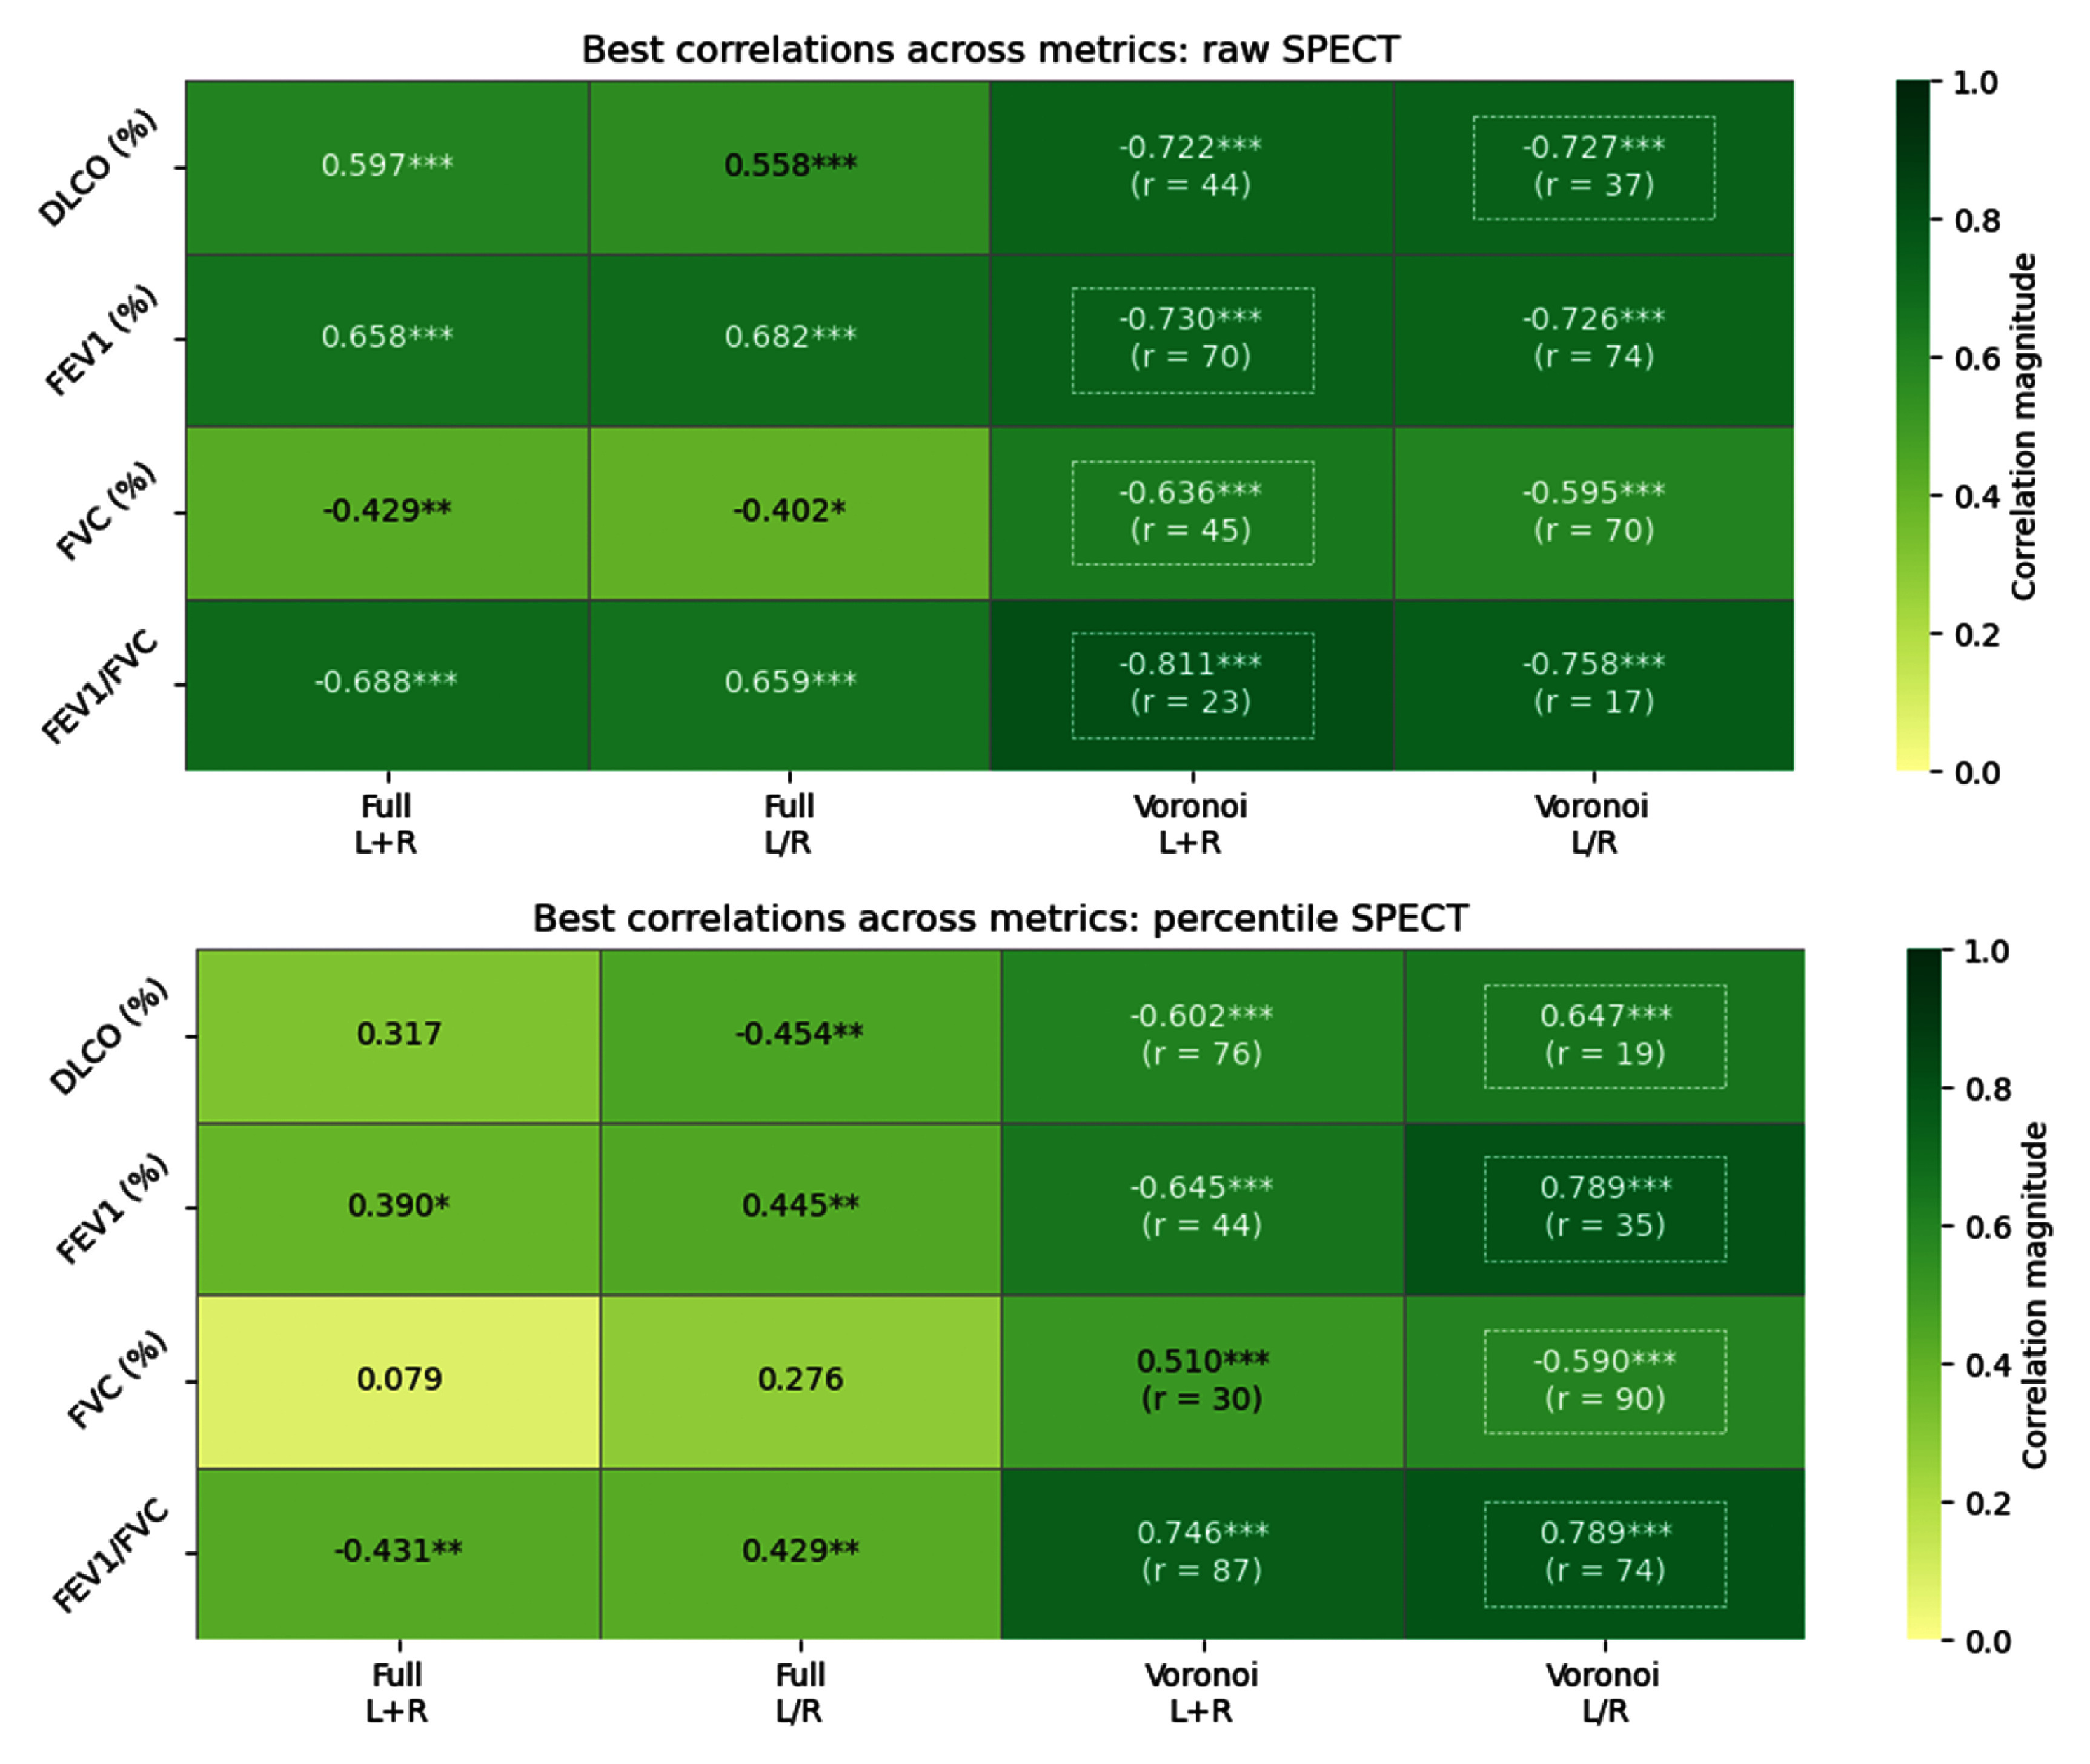 Figure 4
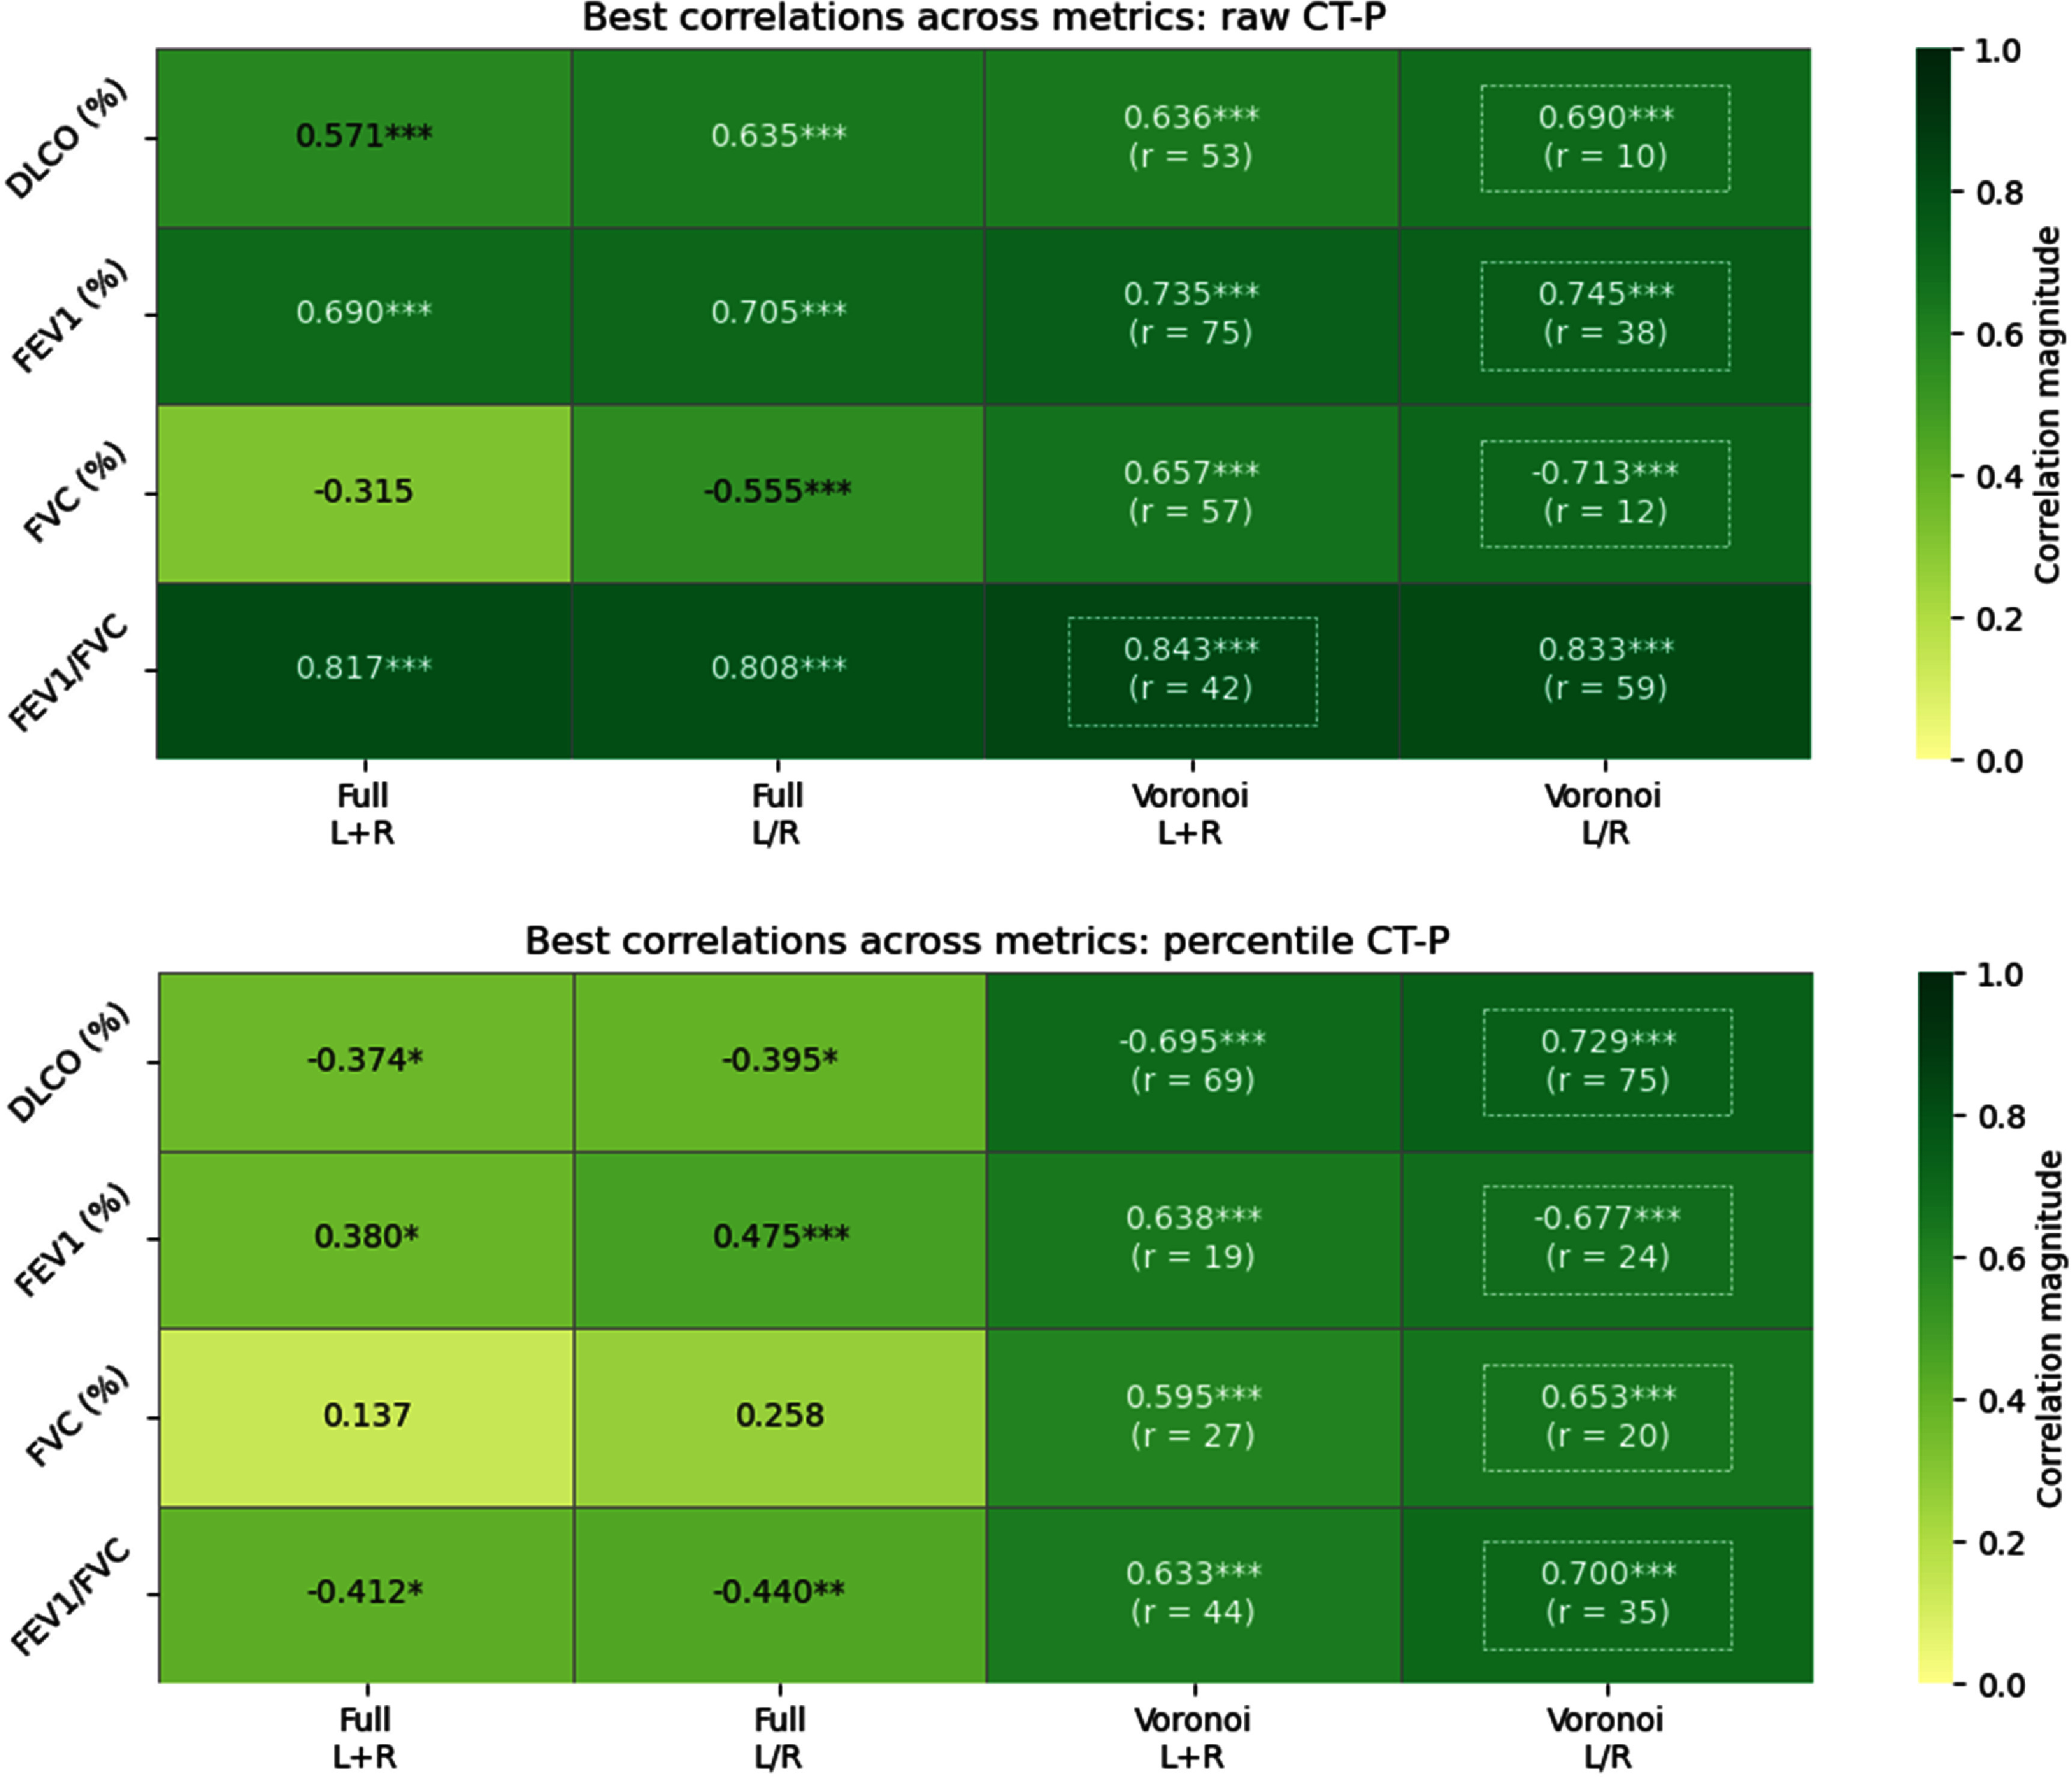 Figure 5
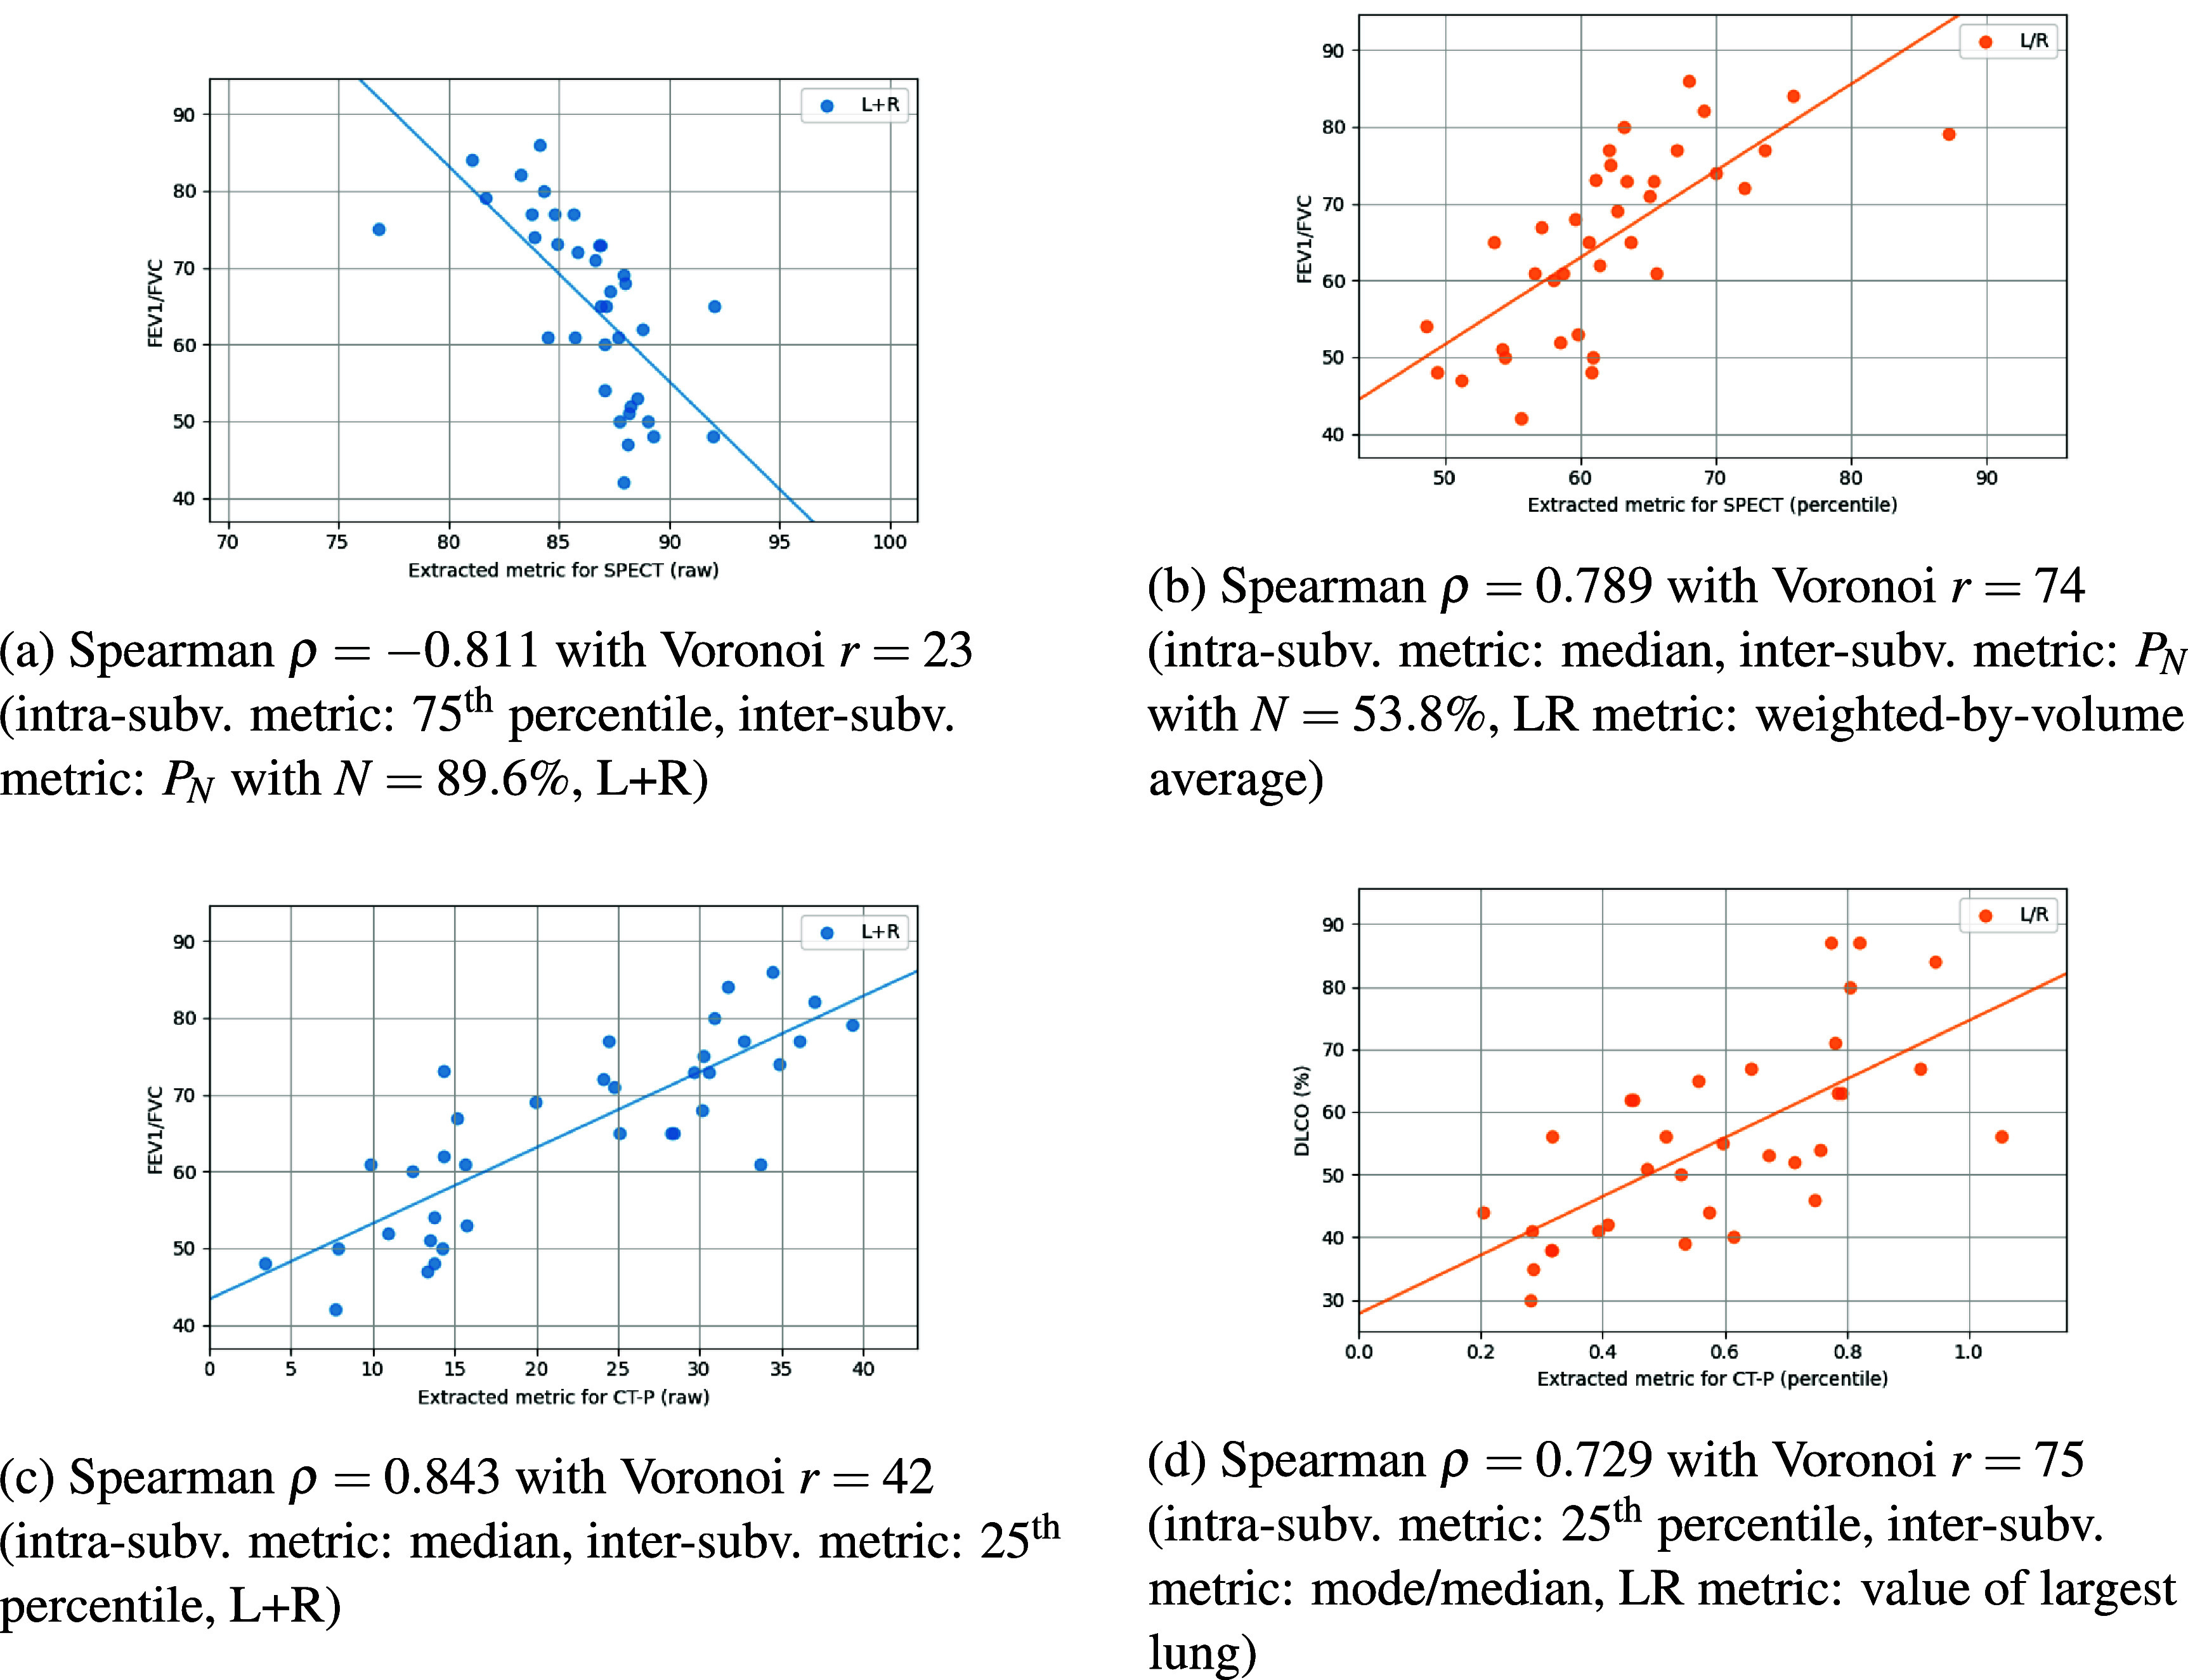 Figure 6
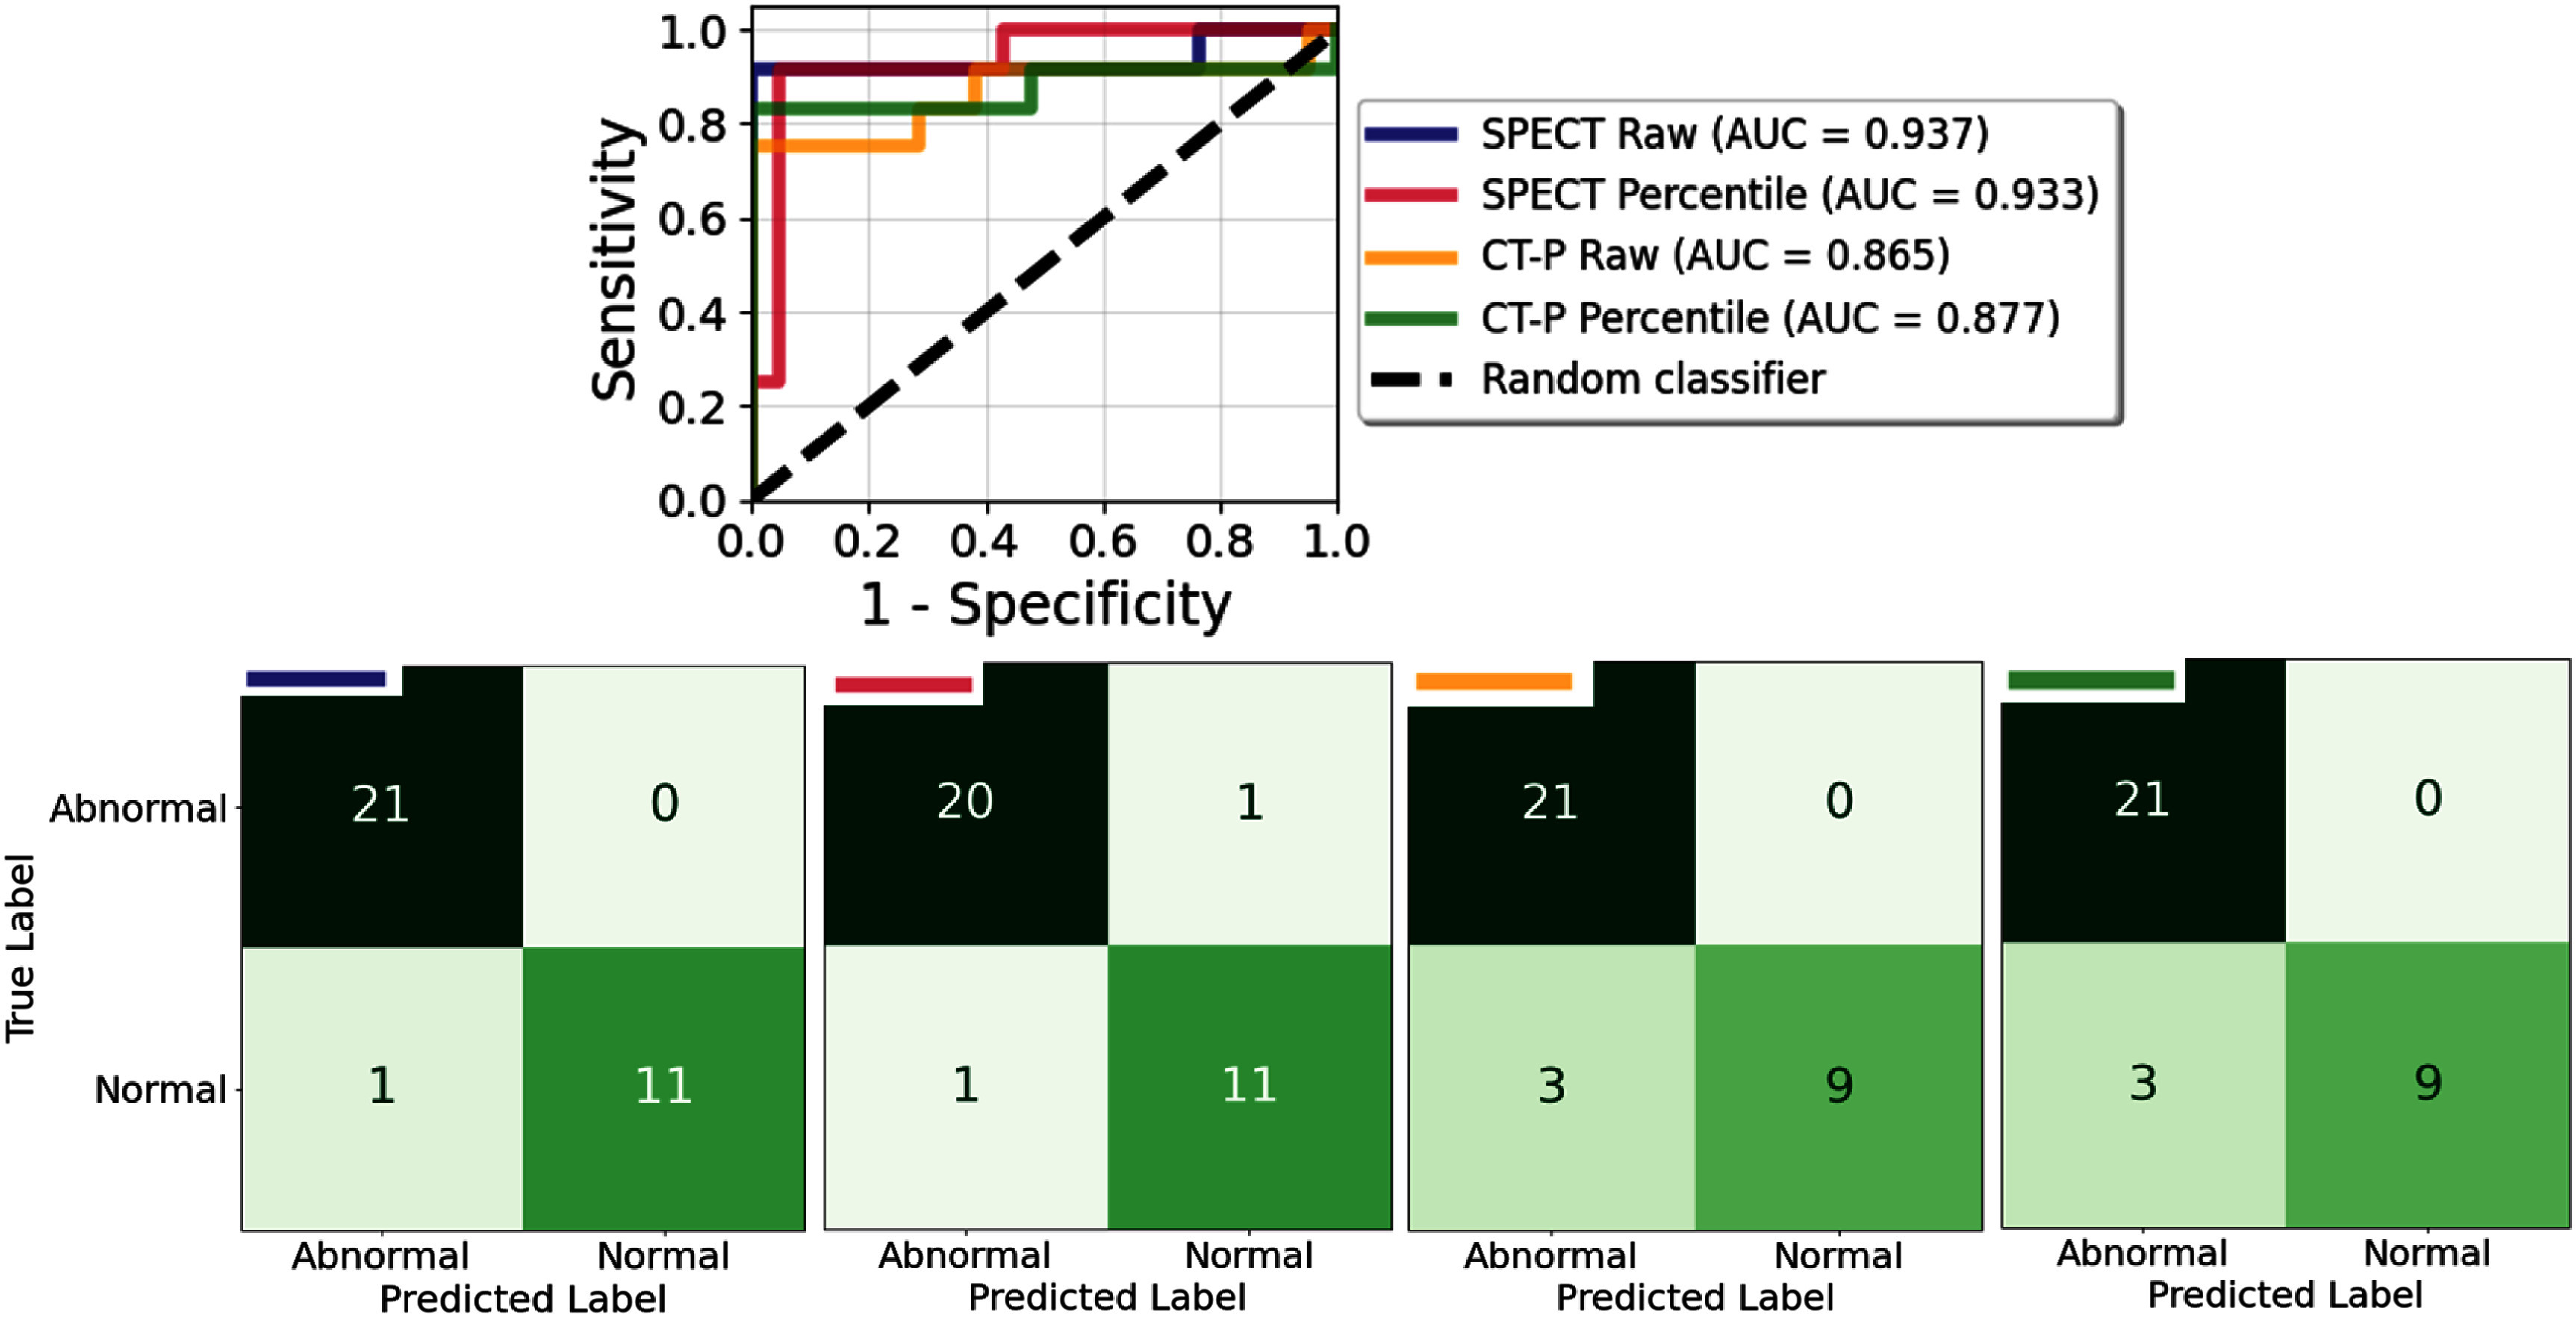 Figure 7
| Spearman | Voronoi | Intra-subvol. metric | Inter-subvol. metric | LR metric | ||
|---|---|---|---|---|---|---|
| Raw images | DLCO (%) | −0.727 | 37 | Median |
| Max value |
| −0.697 | 26 | 75th percentile |
| — | ||
| −0.686 | 31 | Median |
| — | ||
| −0.683 | 23 | 75th percentile |
| — | ||
| −0.678 | 23 | Median |
| — | ||
| FEV1 (%) | −0.730 | 70 | 75th percentile |
| — | |
| 0.723 | 77 | Median | 25th percentile | Least perf. | ||
| 0.718 | 82 | 75th percentile | 25th percentile | Least perf. | ||
| 0.716 | 43 | 75th percentile | 25th percentile | Least perf. | ||
| 0.713 | 88 | Mode/median | Mode/median | Min value | ||
| FVC (%) | −0.636 | 45 | 75th percentile |
| — | |
| −0.634 | 53 | CoV | Skewness | — | ||
| −0.598 | 36 | Max |
| — | ||
| −0.594 | 65 | Median |
| — | ||
| −0.588 | 65 | 75th percentile |
| — | ||
|
|
|
|
|
|
| |
| −0.789 | 19 | 75th percentile |
| — | ||
| −0.787 | 17 | Median |
| — | ||
| −0.787 | 34 | 75th percentile |
| — | ||
| −0.784 | 17 | 75th percentile |
| — | ||
|
| ||||||
| Percentile images | DLCO (%) | 0.647 | 19 | Average |
| Smallest vol. |
| 0.619 | 19 | Median |
| Smallest vol. | ||
| −0.615 | 36 | Average | Mode/median | Min value | ||
| 0.600 | 29 | Median |
| Smallest vol. | ||
| 0.595 | 43 | Median |
| Smallest vol. | ||
| FEV1 (%) | 0.789 | 35 | Min |
| Perf.-weighted avg. | |
| 0.734 | 74 | Skewness | 25th percentile | Min value | ||
| −0.717 | 74 | Median | 75th percentile | Max value | ||
| −0.715 | 38 | CoV | Skewness | Smallest vol. | ||
| 0.709 | 32 | Min |
| Perf.-weighted avg. | ||
| FVC (%) | −0.590 | 90 | Skewness |
| Largest vol. | |
| 0.589 | 24 | Median |
| Smallest vol. | ||
| 0.575 | 12 | 75th percentile |
| Max value | ||
| 0.562 | 24 | 75th percentile |
| Smallest vol. | ||
| 0.554 | 68 | CoV | 75th percentile | Min value | ||
|
|
|
|
|
|
| |
| 0.752 | 74 | 25th percentile |
| Perf.-weighted avg. | ||
| −0.738 | 76 | Mode/median | CoV | Average | ||
| −0.736 | 87 | Mode/median | 75th percentile | Min value | ||
| 0.734 | 87 | Mode/median |
| Average | ||
| Spearman | Voronoi | Intra-subvol. metric | Inter-subvol. metric | LR metric | ||
|---|---|---|---|---|---|---|
| Raw images | DLCO (%) | 0.690 | 10 | 25th percentile | 25th percentile | Largest vol. |
| 0.686 | 49 | 25th percentile | 25th percentile | Largest vol. | ||
| −0.686 | 15 | Median |
| Largest vol. | ||
| 0.685 | 52 | 25th percentile | 25th percentile | Largest vol. | ||
| 0.682 | 85 | 25th percentile | Mode/median | Vol.-weighted avg. | ||
| FEV1 (%) | 0.745 | 38 | Average | Median | Min value | |
| 0.739 | 36 | Average | 25th percentile | Min value | ||
| 0.739 | 74 | Average | 75th percentile | Min value | ||
| 0.739 | 84 | 25th percentile | Median | Min value | ||
| 0.739 | 32 | Average | 25th percentile | Min value | ||
| FVC (%) | −0.713 | 12 | Average |
| Most perf. | |
| −0.701 | 12 | 25th percentile |
| Most perf. | ||
| −0.690 | 23 | Average |
| Most perf. | ||
| −0.657 | 12 | Median |
| Most perf. | ||
| −0.649 | 19 | Average |
| Most perf. | ||
|
|
|
|
|
|
| |
| 0.842 | 34 | Average | 25th percentile | — | ||
| 0.841 | 12 | 25th percentile | 25th percentile | — | ||
| 0.839 | 55 | Average | 25th percentile | — | ||
| 0.838 | 36 | 75th percentile | 25th percentile | — | ||
|
| ||||||
| Percentile images |
|
|
|
|
|
|
| 0.729 | 69 | Median |
| Vol.-weighted avg. | ||
| −0.723 | 64 | 25th percentile |
| Largest vol. | ||
| −0.719 | 56 | Median |
| Largest vol. | ||
| >0.715 | 47 | Average |
| Average | ||
| FEV1 (%) | −0.677 | 24 | Median | 75th percentile | Max value | |
| −0.670 | 52 | Skewness |
| Largest vol. | ||
| −0.66 | 51 | 75th percentile | Mode/Median | Max value | ||
| 0.660 | 19 | Min |
| Vol.-weighted avg. | ||
| 0.659 | 20 | Median |
| Min value | ||
| FVC (%) | 0.653 | 20 | Average |
| Min value | |
| −0.646 | 23 | Median | Median | Max value | ||
| 0.644 | 23 | 75th percentile |
| Max value | ||
| 0.643 | 19 | Max |
| Max value | ||
| 0.633 | 36 | Median |
| Min value | ||
| FEV1/FVC | 0.700 | 35 | Average |
| Max value | |
| −0.697 | 52 | Skewness |
| Max value | ||
| 0.696 | 90 | Mode/median |
| Largest vol. | ||
| −0.689 | 86 | Mode/median | CoV | Min value | ||
| 0.684 | 86 | 25th percentile |
| Perf.-weighted avg. | ||
| Raw images | Percentile images | |
|---|---|---|
| AUC | 0.937 | 0.933 |
| 0.957 | 0.917 | |
| Accuracy | 0.970 | 0.939 |
|
| ||
| Covariates (coefficients) | 2nd DLCO | 3rd DLCO |
| 1st DLCO | 2nd DLCO | |
| 4th FEV1 | 4th DLCO | |
| 5th FEV1 | 2nd FEV1 | |
| 5th FEV1/FVC | 4th FEV1 | |
| 5th DLCO | 3rd FEV1/FVC | |
| 3rd DLCO | 1st FEV1/FVC | |
| — | 2nd FEV1/FVC | |
| — | 1st FEV1 | |
|
| ||
| Bias |
|
|
| Raw images | Percentile images | |
|---|---|---|
| AUC | 0.865 | 0.877 |
| 0.857 | 0.857 | |
| Accuracy | 0.909 | 0.909 |
|
| ||
| Covariates (coefficients) | 5th DLCO | 5th DLCO |
| 2nd DLCO | 4th FEV1/FVC | |
| 4th FEV1/FVC | 3rd FEV1/FVC | |
| — | 2nd FEV1/FVC | |
| — | 1st FEV1 | |
|
| ||
| Bias |
|
|
- —National Institutes of Health10.13039/100000002
Peer Reviews
No public reviews on file for this paper yet. If you reviewed it on a platform where reviews are public (OpenReview, ICLR, NeurIPS, ICML), you can paste yours below so the community can read it here.
Videos
No videos yet. Explain this paper in a talk, walkthrough, or lecture? Add one.
Taxonomy
TopicsEffects of Radiation Exposure · Atomic and Subatomic Physics Research · Radiomics and Machine Learning in Medical Imaging
Introduction
Assessing lung function accurately and cost-effectively are key in managing patients with lung diseases, like chronic obstructive pulmonary disorder (COPD), pulmonary embolism, and lung cancer. Single-photon emission computed tomography (SPECT) is a nuclear medicine imaging modality that provides 3D spatial information on the functional status of the lungs by detecting gamma rays emitted from inhaled or intravenously-administered radiotracers (Bourhis et al 2020, Bang et al 2024, Mirza and Hashmi 2024). SPECT imaging can visualize physiological processes such as ventilation (air flow) or perfusion (blood flow) after registering to a lung CT scan, allowing physicians to directly analyze regions of low functionality, diagnose diseases such as pulmonary embolism, COPD, emphysema, and interstitial lung disease, and appropriately plan radiotherapy treatments for lung cancer patients (Bajc and Jonson 2011, Bateman 2012, Bajc and Lindqvist 2019, 2025, Iqbal et al 2023).
Despite its ability to provide valuable functional information, SPECT imaging has relatively low spatial resolution, is susceptible to attenuation artifacts, carries high cost, is not widely available, and increases patient radiation dosage (Elojeimy et al 2016, Schreuder et al 2019, Yandrapalli and Puckett 2025). These factors motivate the development of alternative approaches to produce functional ventilation and perfusion maps. Non-contrast CT avoids the use of radiopharmaceuticals and contrast agents and offers high-quality structural information, but provides minimal functional information. Even so, non-contrast CT has become the standard of care for lung cancer patients, where these scans are routinely available for patients undergoing lung cancer screening, staging, or follow-up (Wang et al 2019, Chen et al 2021). While contrast-enhanced modalities such as SPECT or CT pulmonary angiography are routinely used to evaluate suspected pulmonary embolism, non-contrast CT offers a safer and more practical option for patients with renal impairment or contrast allergies, motivating the development of contrast-free perfusion surrogates (Wood 2002, Hogan et al 2019). Physics-based approaches initially estimated lung ventilation (CT-V) from paired end-inspiration (inhale) and end-expiration (exhale) non-contrast CT scans by analyzing regional changes in Hounsfield units (Simon 2000). Building on this, the Integrated Jacobian Formulation enhanced robustness by modeling volume changes and was further extended to estimate pulmonary perfusion (CT-P) through regional mass differences between spatially aligned inhale and exhale non-contrast CT volumes (Castillo et al 2019, Castillo 2021). Despite their rigor, these approaches depend heavily on accurate lung segmentation and deformable registration, making them sensitive to noise and artifacts. With the rise of AI, deep learning approaches have recently been proposed to generate synthetic pulmonary perfusion images from clinical non-contrast CT for patients undergoing radiotherapy (Porter et al 2021, Ren 2022, Liu et al 2025). Many of these approaches, however, lack extensive validation due to the scarcity and restriction of large paired datasets of non-contrast CT and SPECT perfusion images. One promising alternative is to examine relationships between scores derived from SPECT imaging and scores derived from non-contrast CT-based methods with scores from pulmonary function tests (PFTs).
PFTs are quick, low-cost, and noninvasive exams that reveal global ventilation and perfusion information about lung function and are critical in patients’ diagnosis (Schneider et al 2009, Ruppel and Enright 2012, Sumphao-Ngern et al 2015, Li et al 2019, Ponce et al 2025). PFTs have been well-established in clinical practice since the 1980s, when standardization efforts and landmark studies cemented their role in respiratory disease diagnosis (Fletcher and Peto 1977, Miller 2005, Tojo 2014). PFT assesses ventilation via spirometry, measuring critical parameters like forced expiratory volume after one second (FEV1), forced vital capacity (FVC), and the ratio between the two (FEV1/FVC). In particular, perfusion is assessed via measuring the efficiency of gas exchange across the alveolar-capillary membrane, quantified by the diffusing capacity of lungs for carbon monoxide (DLCO). Several studies have examined correlations between SPECT and CT-based ventilation maps with PFT data, finding strong relationships with both FEV1 and FEV1/FVC (Yamamoto 2014, Brennan 2015, Miller 2023). The more complex physiology of pulmonary blood flow has resulted in fewer investigations linking perfusion maps with PFT data (Roux et al 2015, Schiwek 2022).
A key challenge lies in projecting the 3D perfusion image into a single interpretable value that reflects the degree and heterogeneity of perfusion and can be meaningfully compared with PFT measurements. Furthermore, it is standard practice to normalize raw SPECT values to percentiles in order to reduce variability from patient size, injected dose, and acquisition settings (Brahim et al 2015, Schmitz-Steinkrüger et al 2020, Apostolova et al 2023, Seoni et al 2024). However, percentile scaling removes absolute quantitative information, which limits assessment of global functionality and explicit comparison with quantitative data. Furthermore, as AI-based methods gain traction, training deep learning models on normalized images has become increasingly common (Choi et al 2021, Kawakubo 2024, Kim et al 2024, Salimi 2025). Due to the scarcity of large paired datasets, models often normalize and predict perfusion maps for the left and right lungs independently, effectively doubling the training data while severing the global physiological relationship between the lungs (Liu et al 2025). Extracting a meaningful summary statistic is further complicated with these percentile-scaled left-right perfusion maps, as conventional quantitative metrics are not directly applicable. Figure 1 depicts a SPECT perfusion scan and CT-P prediction for the same patient (rows), in both raw values and percentiles (columns), where the latter provides a clearer distinction between regions of low and high perfusion.
Coronal views of a SPECT perfusion map (top row) of raw values and percentiles alongside a CT-P estimate (bottom row) of SPECT-like raw values and percentiles, which has a Spearman correlation ρ = 0.36 with the SPECT image. Brighter colors correspond to high-perfusion regions.
We hypothesize that local spatial information within a percentile image retains valuable functional variability, albeit in relative terms. The purpose of this study is to develop methods that extract local perfusion information and condense it into a single score for a patient. To validate this approach, we treat SPECT perfusion as the clinical reference standard and compare it with PFT data, while also evaluating CT-P to determine whether it produces comparable results, thereby supporting the reliability of non-contrast, computationally derived perfusion estimates. Through the use of Voronoi diagrams, we create subvolumes within each left (L) and right (R) lung, followed by the application of descriptive statistics at the intra-subvolume level, inter-subvolume level, and the LR-lung level in order to extract one summary statistic. We find exceptional Spearman correlations between PFT data and derived values from raw and percentile SPECT and physics-based CT-P perfusion maps. Using logistic regression analysis, we further demonstrate that these summary values robustly predict normal versus abnormal lung function as defined by PFT measurements.
Methods
Dataset with perfusion imaging and PFT data
2.1.
In this study, we rely on a cohort of 20 patients from the Beaumont Health System (Royal Oak, MI, IRB # 2016-037) (Vinogradskiy 2022) that yields a retrospective internal dataset of 36 imaging cases, each with a SPECT perfusion map, attenuation correction SPECT/CT, 4DCT imaging, and PFT data (only 33 of the cases have DLCO data). Most patients received thoracic interventions, like surgery, chemotherapy, or radiation, so pre- and post-treatment imaging was available. Most patients were diagnosed with non-small cell lung cancer (various stages), diagnosed with COPD, or were current or former smokers at the time of imaging.
PFT metrics of DLCO (%), FEV1 (%), FVC (%), and FEV1/FVC were expressed as percent-predicted values based on healthy individuals of similar height, age, and sex, with lower values indicating poorer lung function. When only raw values were available, they were converted to percent predicted using the lower limit of normal from the Global Lung Function Initiative calculators (Stanojevic et al 2017).
SPECT perfusion imaging was performed on a dual-head Siemens Symbia SPECT/CT (Siemens Medical Solutions, USA) with a high-resolution parallel-hole collimator and 15% energy window at 140 keV. After intravenous injection of 4.0 mCi 99mTc-MAA (Lantheus Medical Imaging, USA), patients were scanned supine during tidal breathing. Data was acquired in 6^∘^ steps over 360^∘^ (25 s/projection, \documentclass[12pt]{minimal} \usepackage{amsmath} \usepackage{wasysym} \usepackage{amsfonts} \usepackage{amssymb} \usepackage{amsbsy} \usepackage{upgreek} \usepackage{mathrsfs} \setlength{\oddsidemargin}{-69pt} \begin{document} < 30\end{document} min total). Low-dose CT for attenuation correction was obtained at 130 kVp and 75–100 mAs (weight-dependent). Final reconstructed SPECT images were 64 × 64 per 2D slice image with resolution 6.00 mm × 6.00 mm × 2.00 mm.
4DCT imaging captures a time-series of ten 3D CT scans over the breathing cycle, providing a ‘movie’ of pulmonary anatomy during free breathing (Vedam et al 2002, Pan et al 2004, Zeng et al 2008). The 4DCT sets were acquired on a Philips Brilliance Big Bore scanner (v3.6.7) with a bellows system, using 120 kVp and 599 mAs. The final images were 512 × 512 × [77–160] with resolution [0.98–1.30] mm × [0.98–1.30] mm × 3.00 mm.
CT-based perfusion (CT-P) methods compute voxel-wise blood mass changes solely from dynamic non-contrast CT scans to yield pulmonary perfusion estimates like those akin to SPECT imaging. For this study, the inhale and exhale 4DCT phases are automatically extracted and segmented using the TriSwinUNETR model by Nomura (2025). These paired phases are then processed through a mass conservation framework: the segmented lungs independently undergo deformable image registration and Jacobian computation to capture local volume changes, where the voxel-wise perfusion is formulated as a constrained linear least-squares solution based on subregional mean mass changes. Castillo (2021) showed the resulting CT-P images provide spatial maps of magnitude mass change that serve as surrogates for perfusion, with an average correlation coefficient of 0.54 with SPECT perfusion. Finally, low-resolution SPECT perfusion maps are affine-aligned to the inhale CT image to enable direct comparison with CT-P predictions.
To create percentile images, we independently map raw values from the left and right lungs to their empirical percentiles, assigning each voxel a value from 0 to 1 based on its relative intensity within that lung. In summary, each case in the internal dataset contains four perfusion map types: a SPECT perfusion image of raw values (denoted as ‘raw SPECT’) and its corresponding percentile-scaled image (‘percentile SPECT’), and a CT-P perfusion prediction with SPECT-like raw values (‘raw CT-P’) and its corresponding percentile-scaled image (‘percentile CT-P’), as shown in figure 1.
Voronoi diagrams
2.2.
To capture local spatial functionality in perfusion maps, we discretize each lung into subvolumes after resampling to isotropic spacing. Metrics are computed within each subvolume to assess local variation (intra-subvolume), compared across all subvolumes within the lung to capture broader regional differences (inter-subvolume), and finally evaluated between the left and right lungs to account for asymmetries. This hierarchical approach integrates information across multiple scales, ultimately producing a single summary statistic that reflects the overall variability in regional perfusion.
Rather than relying on arbitrary grids, Voronoi diagrams provide a geometry-driven way to discretize space according to proximity, ensuring that each subvolume is localized and adaptive to seed placement (Aurenhammer and Klein 1996). This approach is well known, optimized, and has been successfully applied across biomedical applications and imaging modalities, like segmentation tasks in retinal imaging and confocal microscopy and registration tasks in 4DCT imaging (Bertin et al 1993, Fukuyama et al 2017, Huang et al 2018, Castillo 2019, 2021, Castillo et al 2019, Jalili et al 2020). In our case, we discretize each left and right lung using Voronoi diagrams to create subvolumes that naturally capture local anatomical neighborhoods around seed points. By generating isotropic seed points with Poisson disk sampling using Bridson’s algorithm (Bridson 2007), we ensure they are uniformly distributed with a minimum spacing r, producing well-separated, spatially contiguous subvolumes that enable an interpretable analysis of local perfusion patterns. Unlike random partitions, grids, or quadtrees, Voronoi cells naturally conform to irregular lung boundaries, preserve local neighborhood structure, and allow explicit control over subvolume size, ensuring consistent spatial resolution across subjects. In contrast to orientation- or intensity-driven methods, this approach is robust to image noise and avoids arbitrary spatial bias. Moreover, applying Voronoi-based discretization hierarchically to percentile-scaled images represents a novel strategy for extracting meaningful information. Figure 2 shows Voronoi diagrams at various radii, with subvolume counts averaged to account for random seed locations. Note that as \documentclass[12pt]{minimal} \usepackage{amsmath} \usepackage{wasysym} \usepackage{amsfonts} \usepackage{amssymb} \usepackage{amsbsy} \usepackage{upgreek} \usepackage{mathrsfs} \setlength{\oddsidemargin}{-69pt} \begin{document} r \rightarrow 1\end{document} , the subvolumes approach the size of individual voxels and as \documentclass[12pt]{minimal} \usepackage{amsmath} \usepackage{wasysym} \usepackage{amsfonts} \usepackage{amssymb} \usepackage{amsbsy} \usepackage{upgreek} \usepackage{mathrsfs} \setlength{\oddsidemargin}{-69pt} \begin{document} r \rightarrow \infty\end{document} (practically, all r > 100), they approach the size of the full lung. At both extremes, descriptive metrics are meaningless, so we perform a grid search of \documentclass[12pt]{minimal} \usepackage{amsmath} \usepackage{wasysym} \usepackage{amsfonts} \usepackage{amssymb} \usepackage{amsbsy} \usepackage{upgreek} \usepackage{mathrsfs} \setlength{\oddsidemargin}{-69pt} \begin{document} r \in [10, 90]\end{document} to find the radius that produces the strongest correlation across an array of metrics at each level for our cohort.
Coronal views of Voronoi diagrams at various radii. Subvolume counts are averaged over random seed point placements for the same radius.
Extracting a global statistic from perfusion maps
2.3.
No established metric exists for correlating perfusion functional maps with PFT data, particularly when these maps are computed independently for left and right lungs, expressed as percentiles, or partitioned into discrete regions. To address this, we propose a brute-force search within a hierarchal structure to identify optimal combinations of metrics that best correlate with PFT outcomes for each of the four perfusion map types.
Our approach computes metrics in up to three hierarchical levels, depending on how the perfusion data is processed figure 3 illustrates these processing pathways. We illustrate this hierarchy using the most comprehensive case: a perfusion map of either raw values or percentiles that is split into independent left and right lungs, each discretized into Voronoi subvolumes of radius r (denoted as ‘Voronoi L/R’).
Flowchart illustrating the hierarchical intra-subvolume, inter-subvolume, and LR lung metrics on a perfusion map, whether it is discretized or LR split.
At the first level (intra-subvolume), we summarize the voxel intensities within each Voronoi subvolume using the following descriptive statistics: minimum, maximum, median, mean, coefficient of variation (CoV), 25th percentile, 75th percentile, skewness, and mode/median ratio. CoV is defined as the ratio of the standard deviation to the median. Skewness quantifies asymmetry in the distribution as the normalized third central moment, where positive values indicate a tail toward higher intensities (Zwillinger and Kokoska 2000). The mode is estimated from a histogram as the midpoint of the bin with the highest count. After this step, each subvolume is characterized by a single value for each metric.
At the second level (inter-subvolume), we aggregate the intra-subvolume values across all subvolumes within each lung by computing: P_N_, CoV, mode/median ratio, median, 25th percentile, 75th percentile, and skewness. The metric P_N_ represents the percentage of lung volume with perfusion at or below \documentclass[12pt]{minimal} \usepackage{amsmath} \usepackage{wasysym} \usepackage{amsfonts} \usepackage{amssymb} \usepackage{amsbsy} \usepackage{upgreek} \usepackage{mathrsfs} \setlength{\oddsidemargin}{-69pt} \begin{document} N%\end{document} of the max value across all subvolumes, analogous to ventilation defect metrics described by Yamamoto (2014) and Brennan (2015). We perform a grid search over \documentclass[12pt]{minimal} \usepackage{amsmath} \usepackage{wasysym} \usepackage{amsfonts} \usepackage{amssymb} \usepackage{amsbsy} \usepackage{upgreek} \usepackage{mathrsfs} \setlength{\oddsidemargin}{-69pt} \begin{document} N \in [5%, 95%]\end{document} . After this step, each lung is characterized by a single value for each combination of intra- and inter-subvolume metrics.
At the third and final level (left-right combination) for this example, we merge the left and right lung values into a single patient-level score using one of the following operations: minimum, maximum, average, weighted average by lung volume, weighted average by lung perfusion values, value of the largest lung by volume, value of the smallest lung by volume, value of the lung with most perfusion, or value of the lung with the least perfusion. This final level yields the global perfusion score to correlate with PFT data.
Not all processing scenarios require all three levels. When lungs are analyzed together without discretization (‘Full L+R’), only inter-subvolume statistics are applied directly to the combined lung volume. When lungs are analyzed together with Voronoi discretization (‘Voronoi L+R’), intra-subvolume statistics are followed by inter-subvolume statistics, with no left-right combination needed. When lungs are analyzed separately without discretization (‘Full L/R’), inter-subvolume statistics are computed for each lung and then combined at the left-right level (see figure 3 for a visual overview).
Because the Voronoi seeding algorithm is stochastic, we average the resulting global scores across five independent discretizations of the same radius to ensure stability. Although computing multiple metrics across the several levels can be computationally intensive, the independence of metrics and discretization allows for straightforward parallelization, greatly reducing the processing burden.
Correlation and utility with PFT data
2.4.
All combinations of intra-subvolume, inter-subvolume, and LR metrics are computed for each case of the four perfusion map types (raw SPECT, percentile SPECT, raw CT-P, percentile CT-P) in the four scenarios (Full L+R, Full L/R, Voronoi L+R, Voronoi L/R). Then, each combination is correlated with DLCO (%), FEV1 (%), FVC (%), and FEV1/FVC data. To assess the strength and direction of these associations, we employ Spearman’s rank correlation coefficient ρ, which is well-suited for capturing monotonic relationships without assuming linearity or normality (Spearman 1904). The combination with the largest Spearman coefficient is selected as the best performing global summary statistic for that perfusion map type.
To assess whether the perfusion imaging-derived metrics were associated with clinically meaningful impairment, the PFT dataset is split into 2 groups: normal and abnormal lung function. Reflecting physicians’ tendency to err on the side of caution, we applied a conservative rationale for clinical relevance, labeling a case with abnormal function if DLCO \documentclass[12pt]{minimal} \usepackage{amsmath} \usepackage{wasysym} \usepackage{amsfonts} \usepackage{amssymb} \usepackage{amsbsy} \usepackage{upgreek} \usepackage{mathrsfs} \setlength{\oddsidemargin}{-69pt} \begin{document} < 60%\end{document} , FEV1 \documentclass[12pt]{minimal} \usepackage{amsmath} \usepackage{wasysym} \usepackage{amsfonts} \usepackage{amssymb} \usepackage{amsbsy} \usepackage{upgreek} \usepackage{mathrsfs} \setlength{\oddsidemargin}{-69pt} \begin{document} < 70%\end{document} , or FEV1/FVC \documentclass[12pt]{minimal} \usepackage{amsmath} \usepackage{wasysym} \usepackage{amsfonts} \usepackage{amssymb} \usepackage{amsbsy} \usepackage{upgreek} \usepackage{mathrsfs} \setlength{\oddsidemargin}{-69pt} \begin{document} < 70%\end{document} (Pellegrino 2005, Ponce et al 2025). Only when all three parameters exceeded the thresholds was a case deemed normal. For each of the four perfusion map types, we use logistic regression with leave-one-out cross-validation to test whether the top five global perfusion statistics across all PFT measures can discriminate lung function. To identify the most predictive combination of top global statistics, we perform a brute-force search while measuring pairwise collinearity and full multicollinearity for each global statistic’s variance inflation factor (VIF). We also present a cross-group VIF multicollinearity statistic to address the expected collinearity between metrics of the same group, simply avoiding computing collinearity between metrics which are meant to correlate with the same PFT parameter. Predictive performance is assessed using area under the curve (AUC), receiver operating characteristic (ROC) analyses, F1 scores, and accuracies.
Results
Correlation with PFT
3.1.
We correlated the hierarchical metrics derived from raw-valued and percentile-scaled SPECT and CT-P maps with PFT measures across four scenarios of discretization and left/right lung independence. All computations were performed using laptop-grade CPU resources, without requiring specialized hardware such as GPUs. The CT-P method and hierarchical pipeline are software-agnostic and are not tied to a specific computing platform. On average, generating one CT-P map from 4DCT inhale/exhale pairs required ∼ 200 s, while processing any perfusion map type through the full hierarchical pipeline to obtain its perfusion score required less than 1 s.
Figure 4 presents heatmaps for Spearman correlations with respect to each PFT measure and scenario when evaluating SPECT perfusion maps. The first two columns for raw-valued images show fair to moderate correlations when the lungs are not discretized. The last two columns show a considerable increase in correlation strength when discretizing into Voronoi subvolumes. In particular, the strongest observed correlation (Spearman ρ = −0.811) occurs for FEV1/FVC when the lungs are analyzed together using a Voronoi discretization of radius r = 23, generating approximately 134 total subvolumes. Within each subvolume, taking the 75th percentile and then computing the fraction of subvolumes below 89.6% captures the most informative regional differences in perfusion. This combination of metrics highlights the subvolumes that are not among the very best-perfused regions. Since the threshold is high, most subvolumes will fall below it, so the resulting fraction captures the overall distribution of perfusion, which reflects how the majority of the lung is perfused, rather than only highlighting the rare, extremely low-function areas, like when studying ventilation maps.
*Spearman correlations for the best-performing hierarchical metrics on SPECT perfusion maps with raw values (top) and percentiles (bottom). ‘Full’ denotes the perfusion map was not discretized, while ‘Voronoi’ denotes the map was discretized with the given radius. ‘L+R’ denotes the lungs are treated together, while ‘L/R’ denotes the lungs are treated separately. The strongest correlation for each PFT measure is highlighted by a white dashed box. Statistical significances: *P < 0.05, **P < 0.01, **P < 0.005.
As anticipated, performing descriptive statistics on the percentile-scaled SPECT images (bottom heatmap of figure 4) without Voronoi discretization yields poor correlations compared to the corresponding raw-valued perfusion maps. One of the strongest correlations of the percentile-scaled SPECT images (ρ = 0.789) is also found with FEV1/FVC data, but now with all cases being discretized to a radius of r = 74 (roughly 6 total subvolumes), taking the median percentile within each subvolume, computing the fraction of subvolumes below 53.8% for each lung, and then averaging the two lungs weighted by volume. Once again, this combination of metrics captures most of the general heterogeneity, while still highlighting moderately underperfused areas rather than only the extreme deficits. The largest improvement for these percentile perfusion correlations occurs for FVC (%), jumping from a negligible 0.079 to a substantial 0.590 in magnitude after discretizing. Correlations remain below 0.5 without discretization, but all elevate above 0.5 with discretization, highlighting the critical role of regional information. The heatmaps of figure 4 also depict an increase in correlation strength often times when LR lungs are treated separately, especially for percentile-scaled images. Comparison of the two rightmost columns reveals that different metric combinations yielding moderate correlations appear in each heatmap, with FVC (%) being the least correlated. Most correlation coefficients worsened (2 improved, 1 remain unchanged) when SPECT images were rescaled to percentiles, though the resulting correlations remained fair.
While CT-P estimates from 4DCT inhale/exhale phases have been reported to correlate fairly with SPECT perfusion (Castillo 2021), our internal dataset demonstrated a weaker averaged Spearman correlation of 0.292 ± 0.151 (95% CI: [0.241, 0.356]). Even so, the top heatmap of figure 5 shows exceptionally strong correlations between CT-P images of raw SPECT-like values and PFT measures, especially FEV1/FVC (ρ > 0.800) and regardless of discretization or LR splitting. Similar to figure 4, correlations distinctly improve in magnitude with Voronoi discretizations, most notably for CT-P percentile images. Correlations from discretized raw CT-P images ( \documentclass[12pt]{minimal} \usepackage{amsmath} \usepackage{wasysym} \usepackage{amsfonts} \usepackage{amssymb} \usepackage{amsbsy} \usepackage{upgreek} \usepackage{mathrsfs} \setlength{\oddsidemargin}{-69pt} \begin{document} 0.636 < \rho < 0.843\end{document} ) are generally higher than the discretized percentile images ( \documentclass[12pt]{minimal} \usepackage{amsmath} \usepackage{wasysym} \usepackage{amsfonts} \usepackage{amssymb} \usepackage{amsbsy} \usepackage{upgreek} \usepackage{mathrsfs} \setlength{\oddsidemargin}{-69pt} \begin{document} 0.595 < \rho < 0.729\end{document} ), but the latter continue to exhibit moderate correlations.
*Spearman correlations for the best-performing hierarchical metrics on CT-P perfusion estimates with raw values (top) and percentiles (bottom). ‘Full’ denotes the perfusion map was not discretized, while ‘Voronoi’ denotes the map was discretized with the given radius. ‘L+R’ denotes the lungs are treated together, while ‘L/R’ denotes the lungs are treated separately. The strongest correlation for each PFT measure is highlighted by a white dashed box. Statistical significances: *P < 0.05, **P < 0.01, **P < 0.005.
For all four perfusion map types, discretization into Voronoi subvolumes consistently yielded higher correlated global statistics than without discretization. Tables 1 and 2 summarize the top 5 metrics for correlating raw and percentile SPECT and CT-P images, respectively, with DLCO (%), FEV1 (%), FVC (%), and FEV1/FVC. The top metrics in these tables correspond to the performances seen in figures 4 and 5. Across all PFT measures, metrics from raw SPECT images generally yielded stronger correlations than those from percentile-scaled images, particularly for FEV1/FVC and DLCO (%). Many of the best-performing metrics incorporated Voronoi discretization and the P_N_ statistic, highlighting the importance of capturing local spatial heterogeneity. Notably, the dominant metric types varied across PFTs, with percentile-based values (median, 75th) driving correlations for DLCO (%) and FEV1/FVC, while measures such as CoV, mode/median, and skewness were more influential for FEV1 (%). The top-ranked SPECT metrics show stronger overall correlations with PFTs than CT-P, especially for DLCO (%) and FEV1/FVC, while CT-P achieves its highest correlations with FEV1/FVC but is weaker for DLCO (%). SPECT results are dominated by the cumulative volume measure P_N_, whereas CT-P relies more on global distribution statistics such as mean, median, and skewness. FVC (%) results are excluded hereafter due to their comparatively lower correlations and (subsequent) predictive power. As shown in bold in tables 1 and 2, the strongest correlated PFT measures were observed when the lungs were treated together (‘L+R’) and with raw-valued maps. In contrast, all top-performing metrics for percentile-scaled maps were found when the lungs were treated separately (‘L/R’). Figure 6 shows the scatter plots for the hierarchal metrics that yield the top correlations for each map type. Scatter plots for the best top hierarchal metrics per PFT measure can be found in figures S.1–S.4 in the supplementary data file.
Scatter plots of the top performing hierarchal metrics for each of the four perfusion map types. The solid lines here indicate fitted trends.
Although no formal visual assessment of perfusion defects was performed, we applied standard quantitative metrics intended to approximate visual evaluation, such as P_N_. However, the consistently stronger correlations observed for discretized metrics (see figures 4, 5 and tables 1, 2) compared with non-discretized measures suggest that visual assessment or conventional global metrics alone do not fully capture perfusion heterogeneity and that structured spatial discretization is necessary.
Logistic regression
3.2.
For each of the four perfusion types, logistic regression models yield robust performances in predicting lung function abnormalities. Stepwise inclusion of the top-performing metrics (see figures S.5–S.8) at times induces collinearities, meaning that successive metrics contribute overlapping information to the model that noticeably diminish performance. The correlation matrices of figures S.9–S.12 depict generally strong pairwise correlations. In addition, standard VIF analysis from tables S.1 and S.2 displays very high multicollinearity for all covariates regardless of perfusion map type, so we compute a modified cross-group VIF to remove this inherent collinearity for covariates within the same PFT test parameter. These tables show that covariates from different PFT measures have low to moderate multicollinearities and suggest that covariates from various PFT measures can be combined to build the optimal predictive model.
A brute-force search of all possible combinations reveals the best predictive models for each perfusion map type presented in tables 3 and 4, listing the AUC scores, F1 scores, and accuracies for each model, along with the covariates and their regression coefficients. The regression models from SPECT images required noticeably more covariates (between 7 and 9) than those from CT-P images (between 3 and 5). We find excellent performance for raw and percentile SPECT images, reaching AUC scores of 0.937 and 0.933, respectively, while a slight drop to 0.865 and 0.877 for both raw and percentile CT-P images, respectively. As expected, given that SPECT serves as the reference standard for perfusion assessment, regression models using raw SPECT global statistics as covariates outperformed those derived from all other perfusion map types across the three performance metrics, with the percentile-scaled SPECT model demonstrating comparably strong performance as the second best. Figure 7 depicts ROC-AUC results and confusion matrices for these models, mitigating exceptionally well false positives (incorrectly predicting a patient has normal lung function).
ROC-AUC results and confusion matrices for logistic regression models that use the best combination of all metrics as inputs for each perfusion map type.
Discussion
We developed a three-level metric to evaluate perfusion images, consisting of intra-subvolume, inter-subvolume, and left-right stages. Each level compares distinct information about lung function. The intra-subvolume stage operates on individual Voronoi subregions of the lung, capturing the gradient of perfusion information within each region, producing a value that represents localized lung function at every subvolume, independent of whether the images are raw-valued or percentile-scaled. The inter-subvolume stage then combines information across the lung using descriptive statistics, yielding values that describe the function of each lung side. Because the left and right lungs often differ in overall health and function, one lung can disproportionately influence global PFT measurements. For example, in cases of unilateral disease such as lung cancer, one lung may be severely affected while the contralateral lung remains healthy. Equal weighting of both lungs could therefore produce global PFT values that underestimate the severity observed in the affected lung. To address this, the LR metrics allow differential weighting of the two lungs, generating a final statistic that best reflects global lung function in a manner consistent with conventional PFT measurements.
Discretizing the lungs into Voronoi subvolumes substantially improves the correlation of perfusion metrics with PFT measures, especially for DLCO (%) and FVC (%), clearly seen in the heatmaps of figures 4 and 5. Percentile images pose a challenge, because scaling removes absolute quantitative information and typical global descriptive statistics perform poorly. Voronoi discretization, however, captures local perfusion gradients, preserving clinically meaningful heterogeneity, particularly for FEV1/FVC based on our examinations, despite the cases where individual lungs are treated independently and percentile-scaled. The results in tables 1 and 2 highlight the value of incorporating local spatial information when linking perfusion maps to pulmonary function. Metrics derived from Voronoi-discretized subvolumes, particularly those using P_N_ or intra-subvolume percentile statistics, consistently yielded the strongest correlations with PFT measures, underscoring the importance of capturing regional heterogeneity rather than relying on global averages alone. Interestingly, the specific metrics that performed best varied across PFT measures, suggesting that different aspects of perfusion variability, such as underperfused regions, distribution asymmetry, or local extremes, may drive different functional deficits. These findings support the utility of spatially-resolved analyses for improving the physiological interpretability of perfusion imaging.
Although DLCO is classically regarded as the physiologic measure most directly linked to pulmonary perfusion, our findings revealed stronger correlations between SPECT perfusion and spirometric measures. DLCO reflects gas diffusion across the alveolar-capillary membrane and can be reduced by loss of alveolar surface area, fibrotic thickening, or vascular injury-all processes closely tied to pulmonary perfusion (Goldin and Cascella 2025). Based on this physiology, we anticipated that the proposed three-level metrics would correlate most strongly with DLCO (%). However, our findings showed that SPECT perfusion correlated better with FEV1 (%) and FEV1/FVC. One possible explanation is that our cohort consists primarily of lung cancer patients, who often exhibit obstructive physiology due to tumor-related airway compression, radiation-induced narrowing, or bronchial changes. In such cases, DLCO may be reduced globally without clear spatial heterogeneity, limiting its alignment with regional perfusion patterns. By contrast, SPECT directly depicts regional blood flow, and its heterogeneous patterns may not capture the same diffusion-limiting mechanisms measured by DLCO. Furthermore, DLCO is highly sensitive to anemia, a common comorbidity in cancer patients, adding further variability (Pirker et al 2003, Kang et al 2020). In contrast, FEV1 and FEV1/FVC primarily reflect airflow obstruction, particularly in regions affected by tumor burden or radiation-induced inflammation. Because airflow limitation often coincides with reduced perfusion in lung cancer patients, these PFT measures demonstrated the strongest correlations with raw and percentile SPECT perfusion maps. Tables 1 and 2 also show that FVC (%) had some of the weakest correlations in both SPECT and CT-P images. We suspect the reason that we cannot extract the same information as other PFT parameters is due to the nature of what FVC measures. The FVC measures the amount of air an individual can forcibly inhale, which is heavily influenced by the size of the individual, making it much less indicative of lung function alone. For instance, an individual with smaller body size and normal lung function may exhibit the same FVC measurement as a larger individual with impaired lung function. The majority of the time, FVC is used either in longitudinal studies or in conjunction with other PFT parameters, like FEV1 in FEV1/FVC (Ponce et al 2025).
Moreover, across the 36 cases, SPECT and CT-P perfusion maps demonstrated only a modest Spearman correlation with one another (0.292 ± 0.151), despite each showing strong associations with PFT measures. This weak correspondence highlights the fundamentally different routes of acquiring the perfusion images: SPECT directly depicts radiotracer-based regional blood flow, whereas CT-P infers perfusion from volume and intensity variations within a non-contrast CT inhale/exhale pair. The ability of both modalities to independently correlate well with PFT suggests that CT-P may be capturing a distinct, yet physiologically meaningful, signal not represented in SPECT, potentially reflecting complementary aspects of pulmonary function.
CT-P outperformed SPECT with raw-valued maps when correlating with PFT, whereas SPECT achieved better results with percentile maps. Notably, CT-P’s strongest correlations shifted from FEV1/FVC (raw) to DLCO (%) (percentile), while SPECT consistently aligned with FEV1/FVC across both map types. For SPECT, optimal three-level metrics consistently employed P_N_, suggesting it is particularly effective for extracting lung-function signals from SPECT, whereas CT-P relied on a broader set of descriptive statistics. This distinction may explain why percentile CT-P metrics correlate more with DLCO (%), reflecting sensitivity to perfusion and gas-exchange capacity rather than airflow obstruction. Despite slight decreases in correlation when moving from raw to percentile images (2.7% decrease for SPECT and 13.5% decrease for CT-P in best correlations), the proposed three-level metrics maintained strong associations with PFTs and high predictive accuracy, underscoring its ability to capture clinically meaningful information from both raw and percentile perfusion maps.
After identifying metrics that correlate with PFT data, we next assessed their predictive power for classifying normal versus abnormal lung function. To ensure stable logistic regression results, we evaluated collinearity using pairwise comparisons and VIF. As expected, covariates derived from the top metrics for the same PFT parameter showed high collinearity (VIF \documentclass[12pt]{minimal} \usepackage{amsmath} \usepackage{wasysym} \usepackage{amsfonts} \usepackage{amssymb} \usepackage{amsbsy} \usepackage{upgreek} \usepackage{mathrsfs} \setlength{\oddsidemargin}{-69pt} \begin{document} \gg\end{document} 10) in tables S.1 and S.2, since they essentially capture the same underlying signal (Yoo et al 2014). To address this, we applied a cross-group VIF, comparing covariates only across different PFT parameters, revealing substantially lower multicollinearity and indicating that while metrics within a PFT group extract similar information, metrics across groups capture distinct and complementary aspects of lung function.
For raw SPECT images, the combined use of selected metrics was highly effective at distinguishing healthy from diseased patients, performing comparably to percentile SPECT and outperforming both raw and percentile CT-P. All analyses were conducted using a simple logistic regression model, yet the high AUC scores (between 0.865 and 0.937) and accuracies (between 0.909 and 0.970) for all four models highlight that these metrics isolate predictive information on lung function in a transparent and interpretable way. While predictive performance did not perfectly mirror correlations with PFT measures (see confusion matrices in figures S.9–S.12), most models followed the expected trend of lower accuracy with weaker three-level metric correlation. The notable exception was FEV1 (%) for both raw and percentile SPECT perfusion maps, where figures S.5 and S.6 show that the best predictive performance arose from the fifth-best and fourth-best correlating metrics, respectively, rather than the top-ranked one, suggesting the effect is intrinsic to the FEV1 (%) measure itself. Since FEV1 reflects the volume of air exhaled in 1 s and does not rely on a complete exhalation, unlike other the spirometric PFT measures, this unique physiological basis may explain why correlation strength and predictive power diverge in this case. On a similar note, in CT-V correlation studies (ventilation estimates derived from CT-based methods like CT-P), Brennan (2015) reported AUC scores of 0.64–0.72 for predicting abnormal lung function using CoV as the covariate. The results of this study suggest that correlations could be improved by discretizing the ventilation image, raw-valued or not, and applying hierarchical metrics as demonstrated here.
The use of three-level metrics creates an opportunity to train machine learning models with richer supervision. Although paired non-contrast CT and perfusion datasets are limited, large numbers of CT images and corresponding PFT measurements are readily available, owing to their low cost and noninvasive nature. Our three-level metric bridges this gap by enabling perfusion-derived predictions to be translated into PFT-like values, which can then be validated against ground-truth PFTs. This approach effectively expands the amount of usable training data, even in the absence of paired perfusion scans, and supports the development of more robust lung perfusion prediction models. Importantly, the hierarchal system performs well on percentile-based perfusion images, which is encouraging for AI models, such as the state-of-the-art approaches, that predict percentiles for individual lungs (Porter et al 2021, Liu et al 2025). Together, this framework increases data accessibility and facilitates the training and validation of clinically useful models.
In addition, this hierarchical pipeline is not intended to replace clinical assessments such as PFTs nor serve as a stand-alone lung function assessment tool. Rather, CT-derived perfusion provides a spatially resolved visualization of lung function, whereas PFTs summarize function with a single global value. Our study addresses the key question of whether CT-derived perfusion can be trusted as a surrogate by demonstrating strong correlations with PFTs and discrimination between normal and abnormal lung function. In this way, our work supports the reliability of CT-derived perfusion as a complementary, noninvasive functional imaging modality whose global perfusion scores are informed by the specific characteristics of the perfusion map. Our study has potential clinical impact by increasing a clinician’s confidence in perfusion images, particularly for CT-derived or AI-generated estimates. For example, if a clinician has access to a perfusion map without accompanying PFT data, they could apply the recommended Voronoi radii and metric combinations from tables 1 and 2 to extract global perfusion scores. These scores could then be input into our trained logistic regression model to predict the patient’s lung function or to corroborate visible symptoms, thereby enhancing trust in the perfusion estimate and providing a more interpretable visualization of regional lung function. Another scenario arises when a clinician has access to both a perfusion map and PFT data. In this case, the clinician could follow the same steps as in the previous example, while also comparing the magnitude of the derived perfusion scores with the PFT measurements. This comparison not only reinforces confidence in the perfusion estimate, but can also help identify patients at higher risk, whose scores and symptoms may warrant more urgent clinical attention. Lastly, if the best combination of metrics is applied to a perfusion estimate and the resulting global perfusion score is inconsistent with the patient’s symptoms or available PFT data, the clinician should not rely on the perfusion estimate alone. In such cases, alternative diagnostic imaging (e.g. SPECT) or the PFT data should guide clinical decision-making.
While our findings demonstrate the utility of the proposed three-level metrics, there are important limitations that warrant consideration and further investigation. Our study was conducted solely from one internal dataset with 36 cases from one institution following a specific protocol (see section 1), where patient cancer stages and treatments varied (radiotherapy, tumor resection, etc). Future studies will include more diversity in patients and acquisition protocols to assess the generalizability and stability of the top-performing metrics derived in this study. Secondly, for certain PFT measures that are less sensitive to perfusion characteristics, such as FVC (%), the hierarchical metrics tend to compress data points toward the extremes (e.g. near 0 or 100 on the metric axis in scatter plots), resulting in visually clustered distributions and reduced influence of these points on the overall correlation. This behavior is exhibited in 5 of the top 16 metrics across all four perfusion map types and four PFT measures, see figures S.1(b), (c), S.2(b), (c) and S.4(d) These cases warrant closer examination to understand the underlying cause and to develop strategies to mitigate such effects. While the current pipeline aims to maximize correlation strength, future iterations should incorporate mechanisms to account for and prevent these artificial clustering behaviors. In addition, there is the issue of artifacts, which are nearly unavoidable when using free-breathing 4DCT scans. These artifacts produce discontinuities in the lung volumes, hindering the clinical reliability of a scan and damaging the validity of the deformable image registration algorithm used to compute perfusion via CT-P. Artifacts also likely contributed to the low correlation observed between CT-P predictions and SPECT images, indicating the need to refine parameter choices for our cases within the CT-P method itself. Lastly, future studies will focus on region-specific discretization of the lungs to better capture spatial perfusion patterns, for example by using segmentation masks of the pulmonary arteries or quadtree-like dependence on image intensities to define perfusion territories or Voronoi seed points.
Conclusion
We developed an innovative hierarchical metric where perfusion functional maps are evaluated in three stages: intra-subvolume, inter-subvolume, and left-right, regardless if the maps consist of raw SPECT-like values or normalized to percentiles. Following an extensive computational search, we effectively are able to condense a 3D perfusion image down to one global score that can be used to strongly correlate with PFT data and accurately predict pulmonary function. Discretizing the lungs into spatially-coherent Voronoi subvolumes allows metrics to reflect clinically relevant heterogeneity that would be missed by whole-lung analyses. Importantly, the metric performs robustly on percentile-based perfusion images, which is highly relevant for validating state-of-the-art AI models and for guiding future approaches that predict lung-specific percentile maps. Based on our findings (which warrant further investigation to assess their generalizability), we recommend users to follow the metrics in tables 1 and 2 to achieve the strongest correlations with the available PFT data. This hierarchical framework is not intended to replace PFTs, but rather to complement them by providing spatially resolved perfusion information that yields global scores strongly correlated with lung function and capable of discriminating normal from abnormal physiology. By improving the interpretability and reliability of CT-derived or AI-based perfusion estimates, the approach can increase clinician confidence while appropriately deferring to PFTs or alternative imaging when discrepancies arise. Overall, our approach highlights the growing potential for diagnostic tools that leverage a single perfusion image—whether raw or percentile-scaled, SPECT or CT-derived—to discern pulmonary pathology effectively and noninvasively.
The reference list from the paper itself. Each links out to its DOI / PubMed record.
- 1Apostolova I Schiebler T Lange C Mathies F L Lehnert W Klutmann S Buchert R 2023 Stereotactical normalization with multiple templates representative of normal and Parkinson-typical reduction of striatal uptake improves the discriminative power of automatic semi-quantitative analysis in dopamine transporter SPECTEJNMMI Phys.102510.1186/s 40658-023-00544-936991245 PMC 10060476 · doi ↗ · pubmed ↗
- 2Aurenhammer F Klein R 1996 Voronoi Diagrams Fernuniv., Fachbereich Informatik
- 3Bajc M Jonson B 2011 Ventilation/Perfusion SPECT for Diagnosis of Pulmonary Embolism and Other Diseases Int. J. Mol. Imaging 201168294910.1155/2011/68294921490731 PMC 3065883 · doi ↗ · pubmed ↗
- 4Bajc M Lindqvist A 2019 Ventilation/Perfusion SPECT Imaging-Diagnosing Other Cardiopulmonary Diseases Beyond Pulmonary Embolism Semin. Nucl. Med.494104–1010.1053/j.semnuclmed.2018.10.01230545516 · doi ↗ · pubmed ↗
- 5Bajc M Lindqvist A 2025 Implementation of Ventilation/Perfusion SPECT in Diagnostics beyond Pulmonary Embolism Med. Res. Arch.1310.18103/mra.v 13i 3.6273 · doi ↗
- 6Bang J-I Lee W W Cho S-G Choi M Song Y S 2024 The diagnostic accuracy of SPECT imaging in patients with suspected pulmonary embolism: systematic review and network meta-analysis Clin. Nucl. Med.4963743637–4310.1097/RLU.000000000000516738831512 · doi ↗ · pubmed ↗
- 7Bateman T M 2012 Advantages and disadvantages of PET and SPECT in a busy clinical practice J. Nucl. Cardiol.19S 311S 3–1110.1007/s 12350-011-9490-922259006 · doi ↗ · pubmed ↗
- 8Bertin E Parazza F Chassery J M 1993 Segmentation and measurement based on 3d Voronoi diagram: application to confocal microscopy 1717582175–8210.1016/0895-6111(93)90041-K 8402524 · doi ↗ · pubmed ↗