Large-volume sampling for improved characterization of microbial contamination in agricultural waters: a case study from southeastern U.S. produce farms
Amy Kahler, Mia Mattioli, Moukaram Tertuliano, Morgan Schroeder, Peyton Smith, Devon Stoneburg, Nancy Strockbine, Courtney Wheeler, George Vellidis, Karen Levy, Vince Hill

TL;DR
This study shows that large-volume water sampling improves detection of harmful microbes and contamination sources in agricultural irrigation water.
Contribution
The study introduces and validates large-volume sampling using DEUF for more sensitive detection of pathogens and fecal indicators in agricultural waters.
Findings
DEUF sampling detected higher rates of Salmonella and fecal indicators compared to traditional grab sampling.
DEUF revealed associations between Salmonella and fecal indicators that were not detected using grab sampling.
DEUF is effective for detecting pathogens, fecal indicators, and MST markers in agricultural irrigation water.
Abstract
Fresh produce growers in the United States are required to conduct agricultural water assessments to help mitigate the risks associated with potentially contaminated irrigation water. Microbial water quality is typically assessed using the fecal indicator bacteria, Escherichia coli, collected from small-volume grab samples. Testing irrigation water for alternative fecal indicators, microbial source tracking (MST) markers, or pathogens may provide additional insight into sources of fecal contamination, risk of pathogen presence, or hazards associated with the agricultural watershed. In this study, we conducted laboratory recovery experiments and a field study to evaluate sample collection methods for agricultural water assessments. Dead-end ultrafiltration (DEUF) was used to collect large-volume (50 L) irrigation water samples alongside 1-L grab samples monthly from three farms in…
Genes, proteins, chemicals, diseases, species, mutations and cell lines named across the full text — each resolved to its canonical identifier and authoritative record.
Click any figure to enlarge with its caption.
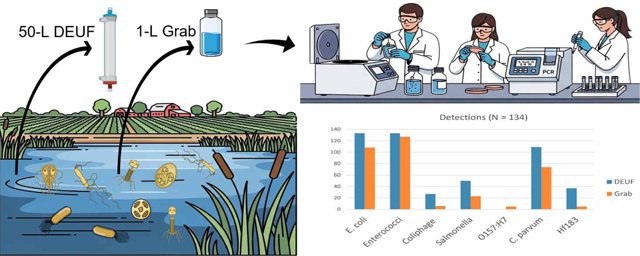 Figure 1
Peer Reviews
No public reviews on file for this paper yet. If you reviewed it on a platform where reviews are public (OpenReview, ICLR, NeurIPS, ICML), you can paste yours below so the community can read it here.
Videos
No videos yet. Explain this paper in a talk, walkthrough, or lecture? Add one.
Taxonomy
TopicsFecal contamination and water quality · Soil and Water Nutrient Dynamics · Child Nutrition and Water Access
INTRODUCTION
Recent foodborne outbreaks linked to contaminated irrigation water highlight the risks associated with using untreated surface water for irrigation of fresh produce, as contaminated irrigation water can serve as a vehicle for pathogens to fruits and vegetables (Bottichio et al. 2020; Gurtler & Gibson 2022). To mitigate these risks, Standards for the Growing, Harvesting, Packing, and Holding of Produce for Human Consumption Relating to Agricultural Water was established under the 2011 Food Safety Modernization Act, requiring that fresh produce growers conduct system-based agricultural water assessments to identify hazards and guide risk-management decisions (FDA 2024). A critical component of an agricultural water assessment is evaluating the degree to which the water source is protected from possible sources of microbial contamination. This requires knowledge of other users of the water source, the impact to the water system by animals, nearby animal agriculture or nearby sources of improperly treated human waste, and other environmental conditions that could impact the water system. Additionally, agricultural water quality must be periodically evaluated by testing for the fecal indicator bacteria Escherichia coli. E. coli is a simple and convenient tool for assessing water quality for fecal contamination and is the most widely used fecal indicator for water quality testing. However, the relationships between E. coli and pathogens in irrigation water and the associated risks of produce contamination and resulting illness are not well understood. Studies examining the relationships between E. coli and pathogens in irrigation water have produced conflicting results, prompting researchers to hypothesize that indicator–pathogen relationships may be specific to locations, seasonal conditions, or other sets of environmental conditions (Partyka et al. 2018; Weller et al. 2020).
Testing agricultural water for alternative microbial indicators, microbial source tracking (MST) markers, and/or pathogens may also be useful for agricultural water assessments, as they can provide additional insight into sources of fecal contamination, risk of pathogen contamination, or hazards associated with the watershed. Alternative microbial indicators may demonstrate strong correlations to pathogen presence or concentration and therefore have better predictive value for risks associated with agricultural water use compared with E. coli alone. For recreational water, enterococci have equivalent predictive power as E. coli for freshwater monitoring and are superior to E. coli as a fecal indicator for marine water monitoring (USEPA 2012b). Non-bacterial pathogens, such as parasites and viruses, may better correlate with indicators that more closely match pathogen traits. For example, male-specific (F+) coliphages (bacteriophages that infect E. coli) are often cited as more appropriate indicators for viral enteric pathogens given similarities in size, physical and genetic characteristics, and survival in the environment (Allwood et al. 2003; Lin & Ganesh 2013). MST markers, which include various human- and animal-specific microbes and genetic markers, can be used to determine potential sources of pathogen contamination in a water source (Harwood et al. 2014). Use of MST markers can be especially helpful to investigate hazards identified during agricultural water assessments, such as nearby animal agriculture or wastewater treatment or septic systems. Identification of fecal contamination inputs could help guide prevention plans. Additionally, testing agricultural water directly for pathogens may be warranted when contamination of an agricultural water source is known or suspected, such as during an outbreak investigation or a root cause analysis (RCA) conducted in response to product contamination.
Standard E. coli testing simply requires the collection of 100-mL grab samples. However, pathogens and some alternative microbial indicators may be present in the environment at concentrations that are below the detection limit for this volume, necessitating the collection of large-volume samples. Dead-end ultrafiltration (DEUF) is one such collection method that enables testing of large sample volumes, facilitating the detection of low-concentration targets from environmental samples (Smith & Hill 2009; Mull & Hill 2012). The DEUF process utilizes dialysis filters to capture microorganisms within hollow filter fibers as large volumes of water (50–100 L) are passed through the filter fiber pores. The filters are then backflushed with a 500-mL solution to recover the retained microorganisms, resulting in a concentrated sample for microbial analysis. The DEUF procedure alone results in a sample for testing that is 100- to 200-fold more concentrated than the original sample. For example, testing 100 mL of the DEUF concentrate from a 50-L sample is equivalent to testing 10 L of the original sample. Secondary concentration steps may also be performed to further concentrate the sample and result in an even higher proportion of the original sample being tested.
The key advantage of DEUF compared with other available large-volume sample collection methods is that the use of hollow fiber dialysis filters with a pore size of ~30 kDa allows for simultaneous concentration of bacteria, parasites, and viruses from water samples and thus enables detection of a wide variety of microbial targets from a single sample. Other large-volume sampling methodologies may only capture one microbe class or may require separate recovery and processing workflows for each type of microbe (Ikner et al. 2012; USEPA 2012a; Sikorski & Levine 2020). DEUF concentrates are amenable to numerous analytical techniques for all microbe classes, such as culture, immunoassay, microscopy, and molecular testing. DEUF can also overcome the challenges inherent in the non-homogeneous distribution of microbial contaminants by accumulating contamination into one sample. DEUF requires minimal operator training and is easily implemented in the field, making it an attractive option for sampling agricultural waters.
In this study, we evaluated DEUF and grab sample collection methods for use in agricultural water testing. First, seeded recovery experiments were conducted to determine the efficacy of the DEUF method for recovering E. coli and two MST markers of human sewage contamination, Bacteroides HF183 (HF183) and human polyomaviruses (HPyV), from irrigation water. E. coli served as a reference analyte to compare DEUF recovery in this study to previously reported recoveries. HF183 and HPyV served as reference analytes for the MST markers, as no previous ultrafiltration recovery data were available for these analytes. Second, we compared the performance of DEUF and grab sampling from produce irrigation water ponds in southern Georgia during a year-long field study.
MATERIALS AND METHODS
DEUF recovery
We assessed the DEUF method performance for irrigation water first by determining the percent recovery of seeded microbes. Irrigation water was obtained from one surface-fed (SC) and one groundwater-fed (LV) irrigation pond in the Withlacoochee River watershed in southern Georgia. Turbidity and conductivity were measured before recovery experiments using a Hach 2100P turbidimeter (Hach, Loveland, CO) and an Oakton CON 100 conductivity meter (Oakton Instruments, Vernon Hills, IL), respectively. Five replicate recovery experiments each were conducted using 50-L volumes of low turbidity (LV) and high turbidity (SC) irrigation water. Primary settled sewage obtained from a wastewater treatment facility in Atlanta, Georgia, was used as seed material for E. coli, human Bacteroides, and HPyV. Immediately prior to an experiment, the sewage container was agitated, and 500 mL was added to the irrigation water. A smaller subsample was removed to quantify the concentration of each microbe in the sewage at the time of seeding. These concentrations were used to calculate the input quantity of each microbe into the experiment. The bulk water was concentrated by the DEUF method (CDC-USEPA 2022), and backflushed concentrate (‘backflush’) volumes were 582 ± 41 mL.
E. coli was enumerated by the Colilert^®^−18 Quanti-Tray^®^ 2000 method using 100 mL of sewage or backflush (IDEXX, Westbrook, ME) (American Public Health Association 2017). Real-time quantitative PCR (qPCR) was performed for the enumeration of HF183 and HPyV (McQuaig et al. 2009; Haugland et al. 2010). Nucleic acid was extracted from 750 μL of the sewage sample or backflush as previously described (Hill et al. 2015). Briefly, nucleic acid was extracted by cell lysis using UNEX lysis buffer (Microbiologics, St. Cloud, MN) and Proteinase K, followed by bead-beating. The extracts were purified using silica spin columns and polyvinyl polypyrrolidone (PVPP) spin columns. Amplification was performed in a 7500 Real-Time PCR System (Applied Biosystems (ABI), Foster City, CA) using 1X TaqMan^™^ Environmental Master Mix 2.0 (ABI). Two and 5 μL of template DNA were each analyzed in duplicate in 50 μL reaction volumes. Primer and probe concentrations and thermal cycling conditions are listed in Supplementary Table S1. Two to three no-template controls were included during each instrument run, and the amplification threshold was set to 0.03 ΔRn units with a detection cutoff threshold quantification cycle (Cq) value of <40. Gene copies (GC) of HF183 and HPyV were enumerated using standard curves consisting of six, 10-fold serial dilutions run in triplicate during each instrument run. A linearized synthetic DNA plasmid (OSTD1) was used as the HF183 standard (Integrated DNA Technologies, Coralville, IA) (Layton et al. 2013). BK polyomavirus ATCC VR-837 genomic DNA (ATCC, Manassas, VA) was used as the HPyV standard material. Detected gene copy number (HF183) or genome equivalents (GE) (HPyV) per reaction were calculated by inputting the average Cq values from sample replicates into the pooled standard curve equation.
Many pathogens and MST analytes require secondary concentration of an ultrafiltered water sample for a final concentrate volume of ~1–10 mL to achieve detectable concentrations by PCR. As such, the remaining ultrafilter backflush was further concentrated to evaluate the overall recovery of HF183 and HPyV. To compare two secondary concentration methods, the backflush concentrate volume was split, and half the volume was concentrated by centrifugation at 4,000 × g for 30 min. The other half was concentrated by polyethylene glycol (PEG) precipitation (Yamamoto et al. 1970). See Supplementary material for additional information regarding this comparison. PEG precipitation consisted of the sequential addition of sodium chloride and PEG 8000 to the backflush to achieve final concentrations of 0.3 M sodium chloride and 8% PEG, followed by incubation at room temperature for 2 h, and finally centrifugation at 10,000 × g for 30 min. The average volumes for PEG pellets and centrifuge concentrates were 6.3 ± 2.7 and 5.2 ± 2.2 mL, respectively.
DEUF recovery efficacy calculations and statistical analyses
Percent recoveries for each method were calculated by dividing the microbe output quantity by the input quantity and then multiplying by 100. Recovery percentages underwent arcsine square root transformation for statistical analyses (Sokal & Rohlf 1995). For each microbe, statistical differences in mean percent recoveries between high and low turbidity experiments were evaluated using a two-sample t-test. Paired t-tests were conducted to evaluate significant differences between percent recovery for secondary concentration methods. Pooled variances were used unless the equality of variances folded F-statistic was significant. P-values ≤0.05 were considered statistically significant. Statistical analyses on recovery experiment data were performed using Excel, version 2016 (Microsoft, Redmond, WA).
Field study design
DEUF and grab sampling method performance were evaluated using water collected from three irrigation ponds: two surface-fed (SC and NP) and one groundwater-fed (LV) in the Withlacoochee River watershed in southern Georgia. Ponds, SC, NP, and LV were approximately 20 acres, 10 acres, and 1 acre in size, respectively. All ponds were unlined, uncovered, and located immediately adjacent to produce fields (Hofstetter et al. 2024). Ponds SC and LV were the same ponds used for the DEUF recovery experiments. Detection rates between paired DEUF and grab samples were compared, as well as the ability of each method to facilitate the assessment of relationships between indicators and pathogens in the irrigation ponds. Tested microbial indicators of fecal contamination included generic E. coli, enterococci, coliphages, and Cryptosporidium. Tested pathogens included Salmonella and E. coli O157:H7, which are commonly implicated bacterial pathogens of produce contamination. MST markers of human fecal contamination (the Bacteroides HF183 marker, HPyV, and Methanobrevibacter smithii) and animal intrusion (mitochondrial DNA of cows, pigs, chickens, deer, and birds) were tested to examine the ability of DEUF and grab sampling to evaluate the presence of these targets in irrigation water.
Field study sample collection and processing
Scheduled water sampling events occurred 1–2 times per month, depending on the season, from May 2015 to May 2016. Samples were collected near the intake of the irrigation system (side A) and the opposite end of the pond from the intake (side B). Fifty liters of water were filtered by DEUF, and three 1-L grab samples were collected at each sample location (CDC-USEPA 2022). In-situ temperature, turbidity, dissolved oxygen, conductivity, and pH readings were taken at the time of sampling using a YSI multiparameter meter (YSI, Inc., Yellow Springs, OH). Rainfall within the preceding 48 h before sample collection was measured using on-site analog rain gauges. Ultrafilters and grab samples were transported on ice to the CDC in Atlanta on the day of collection and held at 4 °C before analysis within 24 h of collection.
Ultrafilters were backflushed, resulting in sample concentrates of 613 ± 71 mL. A portion of the DEUF concentrate was reserved for microbiological culture assays as described below. The remaining DEUF concentrate was split for concentration by PEG precipitation and centrifugation. The PEG precipitate volumes ranged from 2.2 to 23 mL (median 5.6 mL), and the centrifuge concentrate volumes ranged from 1.9 to 22 mL (median 3.8 mL). A portion of each grab sample was reserved for microbiological culture assays as described below. Between 150 and 1,900 mL of the grab sample volume, depending on sample turbidity, was analyzed to determine total suspended solids content according to Standard Method 2540D (American Public Health Association n.d.). A 500-mL aliquot of the grab sample was concentrated by PEG precipitation. The PEG precipitate volumes ranged from 1.5 to 8 mL (median 3.5 mL). Nucleic acid was extracted from 750 μL each of the DEUF and grab sample PEG precipitates, as well as the DEUF centrifuge concentrates, as described in the recovery methods above.
Field study microbiological assays
Culturable E. coli and enterococci were enumerated by the Colilert^®^−18 and Enterolert^®^ Quanti-Tray^®^ 2000 methods, respectively. The assay volumes for grab samples were 100 mL each, and for DEUF concentrates, the volumes tested were 20 mL for E. coli and 10 mL for enterococci. F+ coliphages were enumerated using USEPA Method 1602 for grab samples (USEPA 2001). For DEUF concentrates, the coliphage culture method was performed with modifications. Briefly, 5 mL of the sample was plated using 30 mL of 1× agar and proportional concentrations of antibiotic, host, and MgCl_2_. Five plates were assayed for each DEUF concentrate, for a total volume of 20 mL analyzed. The limits of detection (LODs) for the E. coli, enterococci, and F+ coliphage assays for DEUF and grab samples are presented in Supplementary Table S2.
Salmonella was enumerated from DEUF and grab samples by a three-volume (10, 1, and 0.1 mL), three-tube most probable number (MPN) culture method. Briefly, samples were enriched at 37 °C overnight in buffered peptone water, and then, an aliquot of the enrichment was transferred to Rappaport-Vassiliadis R10 (RV) broth for overnight enrichment at 43 °C. RV broth enrichments were streaked onto Salmonella-Shigella (SS) agar and incubated overnight at 37 °C. Up to three presumptive-positive colonies were selected from each plate and placed in TE buffer. The colony suspension was lysed by heating at 95 °C for 10 min and then stored at −20 °C until qPCR confirmation as described below. Isolated colonies were picked and characterized by pulsed-field gel electrophoresis (PFGE) and whole-genome sequencing (WGS) as described below. Only one isolate from each positive MPN dilution was selected for typing, meaning up to nine isolates per sample could be genetically characterized. The LODs for the Salmonella assay for DEUF and grab samples are presented in Supplementary Table S2.
The presence of E. coli O157:H7 in DEUF and grab samples was determined according to the US Environmental Protection Agency’s Standard Analytical Protocol for Escherichia coli O157:H7 in Water, with modifications (Environment Agency of the United Kingdom 2009). Ten- and 50-mL aliquots of DEUF backflush (equivalent to 0.7–5.3 L of unfiltered water) and 10 and 100 mL aliquots of grab samples were enriched at 42 °C overnight in modified tryptone soya broth with novobiocin. After incubation, immunomagnetic separation was performed on enrichment aliquots using Dynabeads^™^ anti-E. coli O157 (ABI). The purified suspensions were spread plated onto MacConkey agar with sorbitol, cefixime, and potassium tellurite (CT-SMAC) and incubated overnight at 37 °C. Confluent growth from CT-SMAC plates was swabbed and placed in TE buffer, and the suspension was heated at 95 °C for 10 min. The lysed suspensions were stored at −20 °C prior to qPCR confirmation as described below. Plates with qPCR-confirmed O157 were streaked for isolation on CT-SMAC, and isolates were characterized by WGS as described below. Positive and negative controls were included in all culture assays.
Field study molecular analyses
DEUF and grab sample water concentrates were assayed for the presence of Cryptosporidium (Jothikumar et al. 2008) and MST markers by end-point real-time PCR. The MST marker gene targets representing human sources of contamination included Bacteroides HF183, HPyV, and Methanobrevibacter smithii (McQuaig et al. 2009; Haugland et al. 2010; Johnston et al. 2010). Animal-specific MST marker qPCR assays targeted mitochondrial DNA of cows, chickens, deer, pigs, and birds (Schill & Mathes 2008). PEG precipitates were tested for all analytes. Centrifuge concentrates were tested only for Cryptosporidium, Bacteroides HF183, and HPyV to further compare the detection rates of these analytes between the two concentration methods. Amplification was performed in a 7500 Real-Time PCR System (ABI) using 1× TaqMan^™^ Environmental Master Mix 2.0 (ABI). Two and 5 μL of template DNA were analyzed in 50 μL reaction volumes. Primer and probe concentrations and thermal cycling conditions are listed in Supplementary Table S1. BSA and T4 gene 32 protein (gp32) were included as PCR facilitators unless they were detrimental to the reaction chemistry (Supplementary Table S1). TaqMan^™^ Exogenous Internal Positive Control Reagents (ABI) were included to monitor method performance and potential PCR inhibition for every assay except HPyV, as it was detrimental to the reaction chemistry. A reaction was considered inhibited if there was a <2.3 difference between the target Cq and the IAC Cq value (Boehm et al. 2013). Two to three no-template controls were included during each instrument run. Molecular assays were considered positive if amplification of duplicate reactions was observed. Detections of Cryptosporidium, Bacteroides HF183, and HPyV by either PEG precipitation or centrifugation were used to confirm presence in the pond site by DEUF. The LODs for the Cryptosporidium and MST assays for DEUF and grab samples are presented in Supplementary Table S3.
Amplification for Salmonella and E. coli O157 culture confirmation was performed in a 7500 Real-Time PCR System (ABI) (Supplementary Table S1). Two microliters of template nucleic acid were analyzed in 20 μL reaction volumes. At least one no-template control was included during each instrument run. Assays were considered positive if amplification was observed. Presumptive-positive Salmonella colonies were confirmed by qPCR detection of the fimA gene (Hill et al. 2007). PFGE for Salmonella isolate subtyping was conducted using the XbaI enzyme, and the resulting patterns were queried against the CDC PulseNet database of clinical Salmonella isolates submitted in 2015 and 2016 (Ribot et al. 2006). Pattern analysis and UPGMA dendrogram generation were performed using BioNumerics software (Applied Maths, Saint-Martens-Latem, Belgium) with the Dice coefficient and tolerance of 1.5%. Salmonella isolates were also submitted to the FDA’s GenomeTrakr program for serotyping by WGS (Allard et al. 2016; Pfefer et al. 2022).
Presumptive-positive E. coli O157 plate growth samples were confirmed by qPCR detection of the rfbE, stx1, and stx2 genes (Jinneman et al. 2003; Sharma 2006). WGS was performed on E. coli O157 isolates using PulseNet USA protocols (Association of Public Health Laboratories n.d.). For allele-based phylogenomic comparisons, PulseNet USA primarily uses an allele-based core genome MLST (cgMLST) scheme that is incorporated into the Escherichia national BioNumerics v.7.6 database (BioNumerics: WGS Analysis Software Platform, Version 7.6 2022). The core scheme contains 2,513 loci and was initially developed by Enterobase (https://enterobase.warwick.ac.uk).
Field study statistical analyses
Logistic mixed-effects models were used to evaluate the differences in detection rates between grab and DEUF samples while controlling for pond variables using restricted maximum likelihood. The sampling method was modeled as a binary predictor, and analyte detection (Yes/No) as the binary response variable. The pond-level variables controlled for included: sample location (A vs. B) as a fixed effect, sample event (to compare only within samples) nested within pond as a random effect intercept. Concentration data from the detected culturable microbes were incorporated into linear mixed-effects models to evaluate the impact of sampling method on microbe concentration while controlling for pond variables using restricted maximum likelihood. Similarly, the sampling method was a binary predictor, sample location (A vs. B) as a fixed effect, sample event nested within pond as a random effect intercept, and the log_10_ concentration of analyte as the response variable.
Logistic and linear mixed-effects models were also used to evaluate the associations between pathogens and microbial indicators in grab and DEUF samples. Salmonella detection or log_10_ concentration was modeled using logistic and linear mixed-effects models, respectively, with the indicator/MST marker binary or continuous predictor as measured in the different sample types (DEUF or grab). Pond-level variables controlled for included: sample location (A or B) as a fixed effect and sampling event number nested within pond (LV, NP, or SC) as a random effect intercept. P-values ≤0.05 were considered statistically significant. Modeling analyses were done in SAS (version 9.4; SAS Institute Inc.).
RESULTS
DEUF method recovery
The mean turbidity levels for the recovery experiments were 2.0 NTU for pond LV (range: 0.67–2.9 NTU) and 9.2 NTU for pond SC (range: 7.1–12.8 NTU). The mean conductivity levels were 165 μS/cm for LV (range: 164–209 μS/cm) and 217 μS/cm for SC (range: 216–220 μS/cm). Mean percent recovery for E. coli, Bacteroides HF183, and HPyV by DEUF ranged from 54 to 110% (Table 1). There were no significant differences in DEUF recovery between high and low turbidity irrigation water for E. coli (P = 0.12) and HPyV (P = 0.47). Mean recovery for HF183 by DEUF alone was lower in the high turbidity water (63%) than in the low turbidity water (110%, P = 0.02). Total method recoveries incorporating secondary concentration (PEG or centrifugation) for HF183 and HPyV ranged from 3.3 to 17%. See Supplementary material for recovery comparisons between PEG precipitation and centrifugation.
Field method evaluation
Over the course of the field study, there were 22 scheduled sampling events for all ponds. One set of ad-hoc samples was collected from pond LV immediately after a rain event, for a total of 23 sampling events for pond LV. During the study, there were 3, 5, and 8 sample sets for ponds SC, NP, and LV, respectively, that were conducted within 48 h of ≥0.5 inch of rainfall. Because the DEUF and grab samples were collected from two locations within a pond, a total of 44 samples for ponds SC and NP, and 46 samples for pond LV were analyzed during the study period. Measured physicochemical water quality parameters are presented in Supplementary Table S4. Of the culturable microbes, E. coli and enterococci were detected most frequently, followed by Salmonella and F+ coliphage (Table 2). Log_10_ concentrations by each method (DEUF and grab sampling) for these microbes are provided in Supplementary Figures S1–S4. E. coli O157:H7 was only detected in 2–7% of samples collected from each pond, while Cryptosporidium was detected in 46–95% of samples collected from each pond. The human-specific fecal source tracking markers were detected in 0–32% (HF183), 0–7% (HPyV), and 0–2% (M. smithii) of samples collected from each pond.
Effect of sampling method on microbe detection.
E. coli O157:H7 was detected too infrequently for statistical analyses comparing detection rates between sampling methods. Out of 134 discrete samples in which paired DEUF and grab samples were collected, generic E. coli was co-detected 108 times (81%), detected only by DEUF 25 times (19%), but never detected only by grab sampling. Enterococci were co-detected 128 times (96%), detected by only DEUF 5 times (4.5%), and also never detected by only grab sampling. In one instance, enterococci were not detected by either sampling method. DEUF samples were associated with a 3-fold increased odds of detecting Salmonella compared with grab sampling (odds ratio (OR): 2.82; 95% confidence interval (CI): 1.57, 5.07). DEUF sampling was also associated with a 12-fold increased odds of detecting F+ coliphage compared with grab sampling (OR: 11.7, 95% CI: 3.61, 37.6). Cryptosporidium (OR: 10.9, 95% CI: 4.0, 29.3) and Bacteroides HF183 (OR: 12.6, 95% CI: 4.0, 22.3) detections were also significantly associated with a sample being collected with DEUF compared with grab sampling. Detection rates for the MST markers were not significantly associated with either sampling method after controlling for pond variables, likely due to the low number of detections resulting in two analyte models not converging (bird and deer).
Effect of sampling method on microbe concentration.
E. coli concentration was an average 29% or 0.15 log_10_ MPN/100 mL lower in a DEUF sample compared with a grab sample (β = −0.151, P < 0.001). Salmonella concentration was an average 77% or 0.63 log_10_ MPN/100 mL lower in a DEUF sample compared with a grab sample (β = −0.634, P < 0.001). There was no significant difference between enterococci concentrations for DEUF and grab samples (P = 0.43). F+ coliphage concentration was an average of 0.9 log_10_ PFU/100 mL higher in a DEUF sample compared with a grab sample (β = 0.899, P = 0.007).
Indicator relation to pathogen in DEUF vs. grab samples.
Associations between Salmonella detection and the detection of E. coli in DEUF samples could not be evaluated due to the high prevalence of E. coli in DEUF samples. Neither E. coli detection nor E. coli concentration in grab samples was significantly associated with Salmonella detection in grab samples (β = 1.73, P = 0.11; β = 0.154, P = 0.60, respectively). However, the odds of Salmonella detection in DEUF samples increased 2.3-fold and 2.6-fold for every 1 log_10_ increase in E. coli concentration in grab and DEUF samples, respectively (DEUF: β = 0.963, P < 0.001; grab: β = 0.852, P = 0.002). Additionally, a 0.1 log_10_ increase in E. coli concentration in DEUF and grab samples was associated with an approximate 0.18 log_10_ increase in Salmonella concentration in DEUF samples (DEUF: β = 0.172, P < 0.001, grab: β = 0.176, P < 0.001). There was no association between E. coli concentrations in grab samples and Salmonella concentrations in grab samples (P > 0.05).
Salmonella detection in DEUF samples was not significantly associated with enterococci detection in DEUF samples (P > 0.05). Associations could not be evaluated in grab samples due to the low prevalence of Salmonella and enterococci co-detections in grab samples. The odds of Salmonella detection in DEUF samples increased 3-fold for every 1 log_10_ increase in enterococci concentration in DEUF and grab samples (DEUF: β = 1.10, P = 0.001, grab: β = 1.21, P = 0.001). However, like E. coli, enterococci concentrations were not associated with Salmonella detection in grab samples (P > 0.05). A 1 log_10_ increase in enterococci concentration in DEUF and grab samples was associated with an approximate 0.2 log_10_ increase in Salmonella concentration in DEUF samples (DEUF: β = 0.15, P = 0.013, grab: β = 0.19, P = 0.001). Again, like E. coli, enterococci concentrations in grab samples were not associated with Salmonella concentrations in grab samples (P > 0.05).
Neither F+ coliphage detection nor concentration in DEUF or grab samples was associated with Salmonella presence in DEUF samples (P > 0.05). A 1 log_10_ increase in coliphage concentration in DEUF samples was associated with an approximate 0.2 log_10_ increase in Salmonella concentration in DEUF samples (β = 0.17, P = 0.023). F+ coliphage concentrations in grab samples were not associated with Salmonella concentrations in grab or DEUF samples.
Cryptosporidium, Bacteroides Hf183, HPyVs, and M. smithii were not associated with Salmonella presence in DEUF samples (P > 0.05). None of the animal MST markers (bird, chicken, cow, pig) were significantly associated with Salmonella presence in DEUF samples (P > 0.05), likely due to the low detection rate of the MST markers in all ponds.
Pathogen diversity by sample type.
A total of 132 presumptive-positive Salmonella isolates were subjected to PFGE and WGS sequence data available under NCBI BioProject PRJNA308180. All but one isolate was identified as Salmonella (by either method), and 18 different serotypes were detected (Table 3). DEUF resulted in a greater number of presumptive-positive isolates for testing (101) than grab sampling (31). A maximum of three discrete serotypes were detected in a DEUF water sample, and up to two serotypes were detected in a grab water sample. Per pond, DEUF resulted in a greater diversity of detected Salmonella isolates compared with grab samples. While 10 serotypes were detected by both DEUF and grab sampling, 7 serotypes were detected only in samples collected by DEUF, and 1 serotype was detected only in a grab sample. Ten presumptive-positive E. coli O157 isolates from two sampling events in September and October 2015 were subjected to WGS. All 10 isolates were determined to be serotype O157:H7 with 0–2 allele differences, indicating a high degree of genetic similarity, consistent with a common source. Sequence data can be found under NCBI BioProject PRJNA218110, genome assemblies PDT001355455.1–PDT001355464.1.
Quality assurance/quality control.
No contamination was observed in any culture assays or qPCR no-template controls. Positive controls were detected as expected for all assays. qPCR amplification inhibition was absent in all samples. The pooled HF183 standard curve had an amplification efficiency (E) of 100% (E = (10^−1/slope^ – 1)*100), a y-intercept of 38.264, and an R^2^ of 98.1%. The LOD of the HF183 qPCR assay was 0.30 gene copies (GC) per reaction. The pooled HPyV standard curve had an amplification efficiency (E) of 92.73%, a y-intercept of 38.015, and an R^2^ of 97.7%. The limit of detection for the HPyV qPCR assay was 0.27 genome equivalents (GE) per reaction.
DISCUSSION
The results from this study highlight the benefits of large-volume DEUF sampling for the detection of low-concentration microbes in irrigation water. DEUF recoveries for E. coli, HF183, and HPyV exceeded 50% for each turbidity level tested, which is consistent with previous findings (Mull & Hill 2012). By lowering the effective detection limits for the microbial assays, DEUF resulted in significantly higher detection frequencies of most of the study microbes than grab sampling during the field study. While grab sampling was adequate to detect E. coli and enterococci, which were often present at sufficiently high concentrations in the ponds, DEUF sampling still resulted in additional detections of these indicators when concentrations were below the detection limit capabilities of grab sampling. More importantly, DEUF increased detection rates of lower concentration targets such as Salmonella, F+ coliphage, Cryptosporidium, and HF183. On the other hand, the only positive samples obtained for E. coli O157:H7 during this study were from grab sampling, although the overall detection rate was quite low (n = 5). A recent study characterizing irrigation water quality in California and Washington also compared microbial detection rates between small and large volume (10 L) samples (Partyka et al. 2018). The researchers found that large-volume sampling resulted in higher Salmonella and E. coli O157 prevalence compared with grab sampling. However, like our study, there were instances in which E. coli O157 was detected only in the grab sample and not in the paired large-volume sample. The absence of E. coli O157 detection in DEUF samples from this study could be due to several factors, including non-homogeneous distribution or increased interference from competing organisms in the DEUF samples.
The ability to detect microbes that are present at low concentrations is critical for risk assessment and mitigation. Low concentrations of pathogens could still have a public health impact, so using large-volume sampling methods for agricultural water assessments may facilitate a more accurate picture of the state of an agricultural water source. In this study, large-volume sampling revealed relationships between Salmonella and several of the fecal indicators in the irrigation ponds. E. coli, enterococci, and F+ coliphage collected by either method correlated with Salmonella presence and concentration in these ponds. However, these associations only held for Salmonella detected by DEUF, due to the increased DEUF detections, as there were not enough Salmonella detections by grab sampling to elucidate these relationships. These associations demonstrate that DEUF can be used to help identify the indicators that are most related to pathogens of interest in a specific growing area and suggest that E. coli, enterococci, and F+ coliphage may hold potential as health-relevant indicators. Further, DEUF may require fewer sample replicates than grab sampling to elucidate microbial relationships and conduct agricultural water assessments. In this study, correlations between indicator bacteria and Salmonella were found in 134 samples. Previous studies from this growing region using small-volume collection methods found correlations between generic E. coli and Salmonella when testing over 500 samples (Luo et al. 2015; Lee et al. 2018), while studies that found no such correlations tested fewer than 300 samples (Antaki et al. 2016; Harris et al. 2018).
One consideration for the use of DEUF is the potential for microbe loss due to incomplete recovery of microbes during the backflushing process, which could result in underestimating microbial concentrations. However, the field data for the fecal indicators did not demonstrate meaningful concentration losses from DEUF. While DEUF did result in statistically lower concentrations of E. coli compared with grab sampling, the actual concentration reduction was negligible (0.15 log_10_). Further, enterococci concentrations were not impacted by the sample collection method. F+ coliphage concentrations were higher for DEUF samples, suggesting that DEUF processing may have facilitated the breakup of viral aggregates. The largest concentration reduction for DEUF occurred for Salmonella (0.6 log_10_). This reduction could have been due to losses during DEUF processing or to detection interference from the higher concentration of background flora in DEUF concentrates than in grab samples. Secondary concentration procedures may also contribute to microbe loss for DEUF samples, as evidenced by lower total method recoveries of HF183 and HPyV compared with primary DEUF recoveries. Despite these losses, the additional concentration steps still result in a lower overall method detection limit by additionally concentrating the sample ~100-fold. This is particularly important for analytical methods such as PCR, in which a small volume of sample is extracted and then only a small portion of the extract is tested.
The selection of sampling strategies and methodologies for agricultural water testing will depend on site-specific watershed characteristics, the goals of testing efforts, and available resources. However, DEUF can be a useful tool for agricultural water assessments, RCAs, or outbreak investigations to generate different kinds of data that can help inform source attribution, hazard assessment, and risk mitigation. DEUF can enable the detection of fecal MST markers to determine potential sources of contamination from nearby animal agriculture, wildlife, or human waste. In the field study, the detection rates for most of the MST markers were low, but the detection of the HF183 target suggests that human waste intrusion may be a hazard in the growing region. In outbreak scenarios, MST testing of DEUF samples has been successful in providing fecal source attribution during environmental investigations (Mattioli et al. 2021; Jansen et al. 2024; Osborn et al. 2024). If contamination sources are identified, measures can be taken to treat or protect the water source or implement other risk mitigation strategies. DEUF can also be used to assess microbial communities in agricultural water, as it allows for the capture and concentration of non-homogeneously distributed microbes by filtering a large sample volume. In this study, a greater number and diversity of Salmonella serotypes were detected from DEUF samples compared with grab samples. And while there were no DEUF E. coli O157 detections from the field study, DEUF has been successful in recovering and isolating diverse strains of E. coli O157 during outbreak environmental investigations (US Food & Drug Administration 2018; Bottichio et al. 2020; Osborn et al. 2024). Finally, if irrigation water is suspected or known to be contaminated, DEUF can be utilized for pathogen detection alone or in combination with other testing strategies such as MST.
CONCLUSIONS
Compared with grab sample collection, the DEUF water sampling method resulted in higher detection rates of low-concentration microbes with a minimal impact on concentration estimates. Salmonella detection and concentration was associated with E. coli, enterococci, and F+ coliphage, and these relationships could only able to be elucidated using Salmonella measurements from DEUF samples. DEUF is recommended for agricultural water assessments, root cause analyses, or outbreak investigations when target analytes are suspected to be present at low concentrations, as with pathogens or alternative indicators such as fecal source tracking markers. Large-volume sampling using DEUF provides fresh produce growers and other food safety investigators with sensitive tools for testing the microbial quality of agricultural water sources and can complement the existing procedures for water quality testing with fecal indicator organisms. Through DEUF large-volume water sampling, produce growers have the capacity to obtain water quality data for a wide variety of pathogens, microbial indicators or pathogen surrogates, and MST markers from a single water sample.
Supplementary Material
Supplementary Information
The reference list from the paper itself. Each links out to its DOI / PubMed record.
- 1Allard MW, Strain E, Melka D, Bunning K, Musser SM, Brown EW & Timme R (2016) Practical value of food pathogen traceability through building a whole-genome sequencing network and database, Journal of Clinical Microbiology, 54 (8), 1975–1983. 10.1128/JCM.00081-16.27008877 PMC 4963501 · doi ↗ · pubmed ↗
- 2Allwood PB, Malik YS, Hedberg CW & Goyal SM (2003) Survival of F-specific RNA coliphage, feline calicivirus, and Escherichia coli in water: a comparative study, Applied and Environmental Microbiology, 69 (9), 5707–5710. 10.1128/AEM.69.9.5707-5710.2003.12957967 PMC 194968 · doi ↗ · pubmed ↗
- 3American Public Health Association (n.d.) 2540 Solids. In: Lipps WC, Baxter TE & Braun-Howland E (eds.) Standard Methods for the Examination of Water and Wastewater. Washington, DC: American Public Health Association.
- 4American Public Health Association (2017) 9223 Enzyme substrate coliform test. American Public Health Association.
- 5Antaki EM, Vellidis G, Harris C, Aminabadi P, Levy K & Jay-Russell MT (2016) Low concentration of Salmonella enterica and generic Escherichia coli in farm ponds and irrigation distribution systems used for mixed produce production in southern Georgia, Foodborne Pathogens and Disease, 13 (10), 551–558. 10.1089/fpd.2016.2117.27400147 PMC 6445212 · doi ↗ · pubmed ↗
- 6Association of Public Health Laboratories (n.d.) Pulse Net International SO Ps. Bethesda: APHL. Retrieved August 13, 2025. Available at: http://www.aphl.org.
- 7Bio Numerics: WGS Analysis Software Platform, Version 7.6 (2022) [Computer software]. Bio Mérieux. Available at: https://www.bionumerics.com/bionumerics.
- 8Boehm AB, Van De Werfhorst LC, Griffith JF, Holden PA, Jay JA, Shanks OC, Wang D & Weisberg SB (2013) Performance of forty-one microbial source tracking methods: a twenty-seven lab evaluation study, Water Research, 47 (18), 6812–6828. 10.1016/j.watres.2012.12.046.23880218 · doi ↗ · pubmed ↗