Matching in the House of Surgery: A Retrospective Analysis of Trends Across Surgical Subspecialties From 2015 to 2024
Mandy Hsu, Dennis J Head, Abdul-Jawad J Majeed, Jay D Raman

TL;DR
This study examines trends in competitiveness for surgical residency programs from 2015 to 2024, finding that while some specialties have seen growth, overall demand exceeds available positions.
Contribution
The study provides a comprehensive decade-long analysis of match rates and applicant trends across multiple surgical subspecialties.
Findings
Otolaryngology had the highest match rate (74.5%), while Vascular Surgery had the lowest (52.7%).
Orthopedic Surgery saw significant growth in both registered and matched applicants.
Year-specialty interactions suggest inconsistent trends across surgical subspecialties.
Abstract
Background: Residency positions in surgical subspecialties are highly competitive due to numerous applicants and limited positions. This study analyzes a decade of trends in applicant numbers and match rates across surgical subspecialties. Methods: Publicly available data from 2015 to 2024 were collected from the American Urologic Association and National Resident Matching Program for Neurologic Surgery, Otolaryngology, Orthopedic Surgery, Plastic Surgery, Urology, and Vascular Surgery. Descriptive statistics, linear regression, and analysis of variance were conducted. Results: Of 29,483 registered applicants, 19,535 (66.3%) matched. Otolaryngology had the highest match rate (74.5%), while Vascular Surgery had the lowest (52.7%). Registered and matched applicants varied significantly by year within each specialty. For instance, Orthopedic Surgery demonstrated particularly significant…
Genes, proteins, chemicals, diseases, species, mutations and cell lines named across the full text — each resolved to its canonical identifier and authoritative record.
Click any figure to enlarge with its caption.
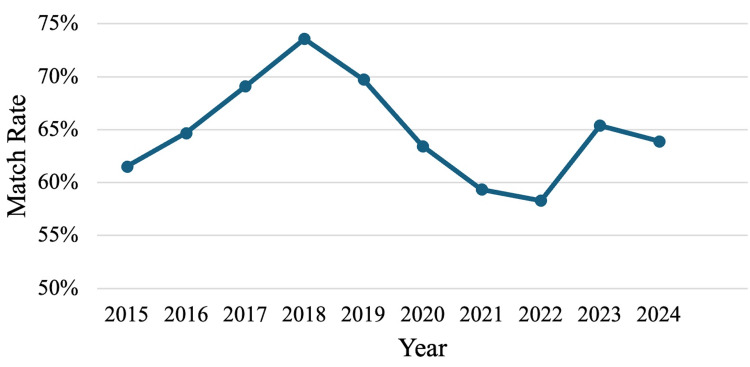 Figure 1
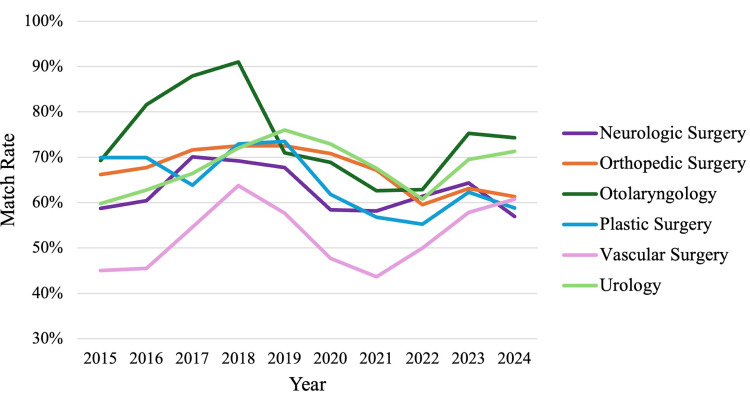 Figure 2
| Variable | F | df | P-value |
| Specialty | 11.52 | (5,48) | <0.001 |
| Year | 85.36 | (1,48) | <0.001 |
| Specialty×year | 11.73 | (5,48) | <0.001 |
| Specialty | Slope (applicants/year) | P-value |
| Neurologic Surgery | 8.73 | 0.016 |
| Orthopedic Surgery | 58.76 | <0.001 |
| Otolaryngology | 21.48 | 0.015 |
| Plastic Surgery | 18.78 | <0.001 |
| Urology | 11.82 | 0.033 |
| Vascular Surgery | 7.47 | 0.014 |
| Variable | F | df | P-value |
| Specialty | 50.30 | (5,48) | <0.001 |
| Year | 526.91 | (1,48) | <0.001 |
| Specialty×year | 51.80 | 5,48) | <0.001 |
| Specialty | Slope (applicants/year) | P-value |
| Neurologic Surgery | 3.74 | <0.001 |
| Orthopedic Surgery | 26.69 | <0.001 |
| Otolaryngology | 10.55 | <0.001 |
| Plastic Surgery | 7.67 | <0.001 |
| Urology | 11.06 | <0.001 |
| Vascular Surgery | 5.12 | <0.001 |
Peer Reviews
No public reviews on file for this paper yet. If you reviewed it on a platform where reviews are public (OpenReview, ICLR, NeurIPS, ICML), you can paste yours below so the community can read it here.
Videos
No videos yet. Explain this paper in a talk, walkthrough, or lecture? Add one.
Taxonomy
TopicsDiversity and Career in Medicine · Surgical Simulation and Training · Medical Education and Admissions
Introduction
In the United States, residency spots for surgical subspecialties are highly competitive, with large numbers of applicants looking for a limited number of open positions each year. For most surgical subspecialties, this process is done through the National Resident Matching Program (NRMP), a non-profit independent organization that uses a mathematical algorithm to pair medical graduates with residency positions based on ranked preferences [1]. For Urology, this process is conducted through the American Urological Association (AUA) and the Society of Academic Urology (SAU) with their own matching algorithm [2].
The demand for surgical subspecialty residency spots has only continued to grow. Indicators of rising demand include the increasing number of applicants, the number of matched applicants, and match rates, which have shown that interest has often outpaced the number of available positions for almost all surgical subspecialties. In 2024, the NRMP reported fill rates across surgical specialties to be greater than 99%, exceeding the average fill rate of 93.8% across all specialties combined [3]. Most recently, in 2024, across Neurological Surgery, Plastic Surgery, Orthopedic Surgery, Otolaryngology, and Vascular Surgery, only three out of the available 1,852 positions went unfilled [4]. This is despite the fact that many surgical residency programs have expanded the number of positions available and continue to plan for more. Therefore, though essentially all surgical residency positions are being filled, it is unclear that this rise is sufficient to keep up with demand from applicants.
Matching into a surgical subspecialty is how medical graduates receive the training necessary to become practicing surgeons. However, given the rapidly aging population of the United States, more surgeons are approaching retirement age, with fewer surgeons entering the workforce to replace them and care for patients. Over a fourth of surgeons are older than 65 years old, and for Orthopedic Surgery, Plastic Surgery, and Urology, this percentage is even greater [3]. It is projected that if the current workforce of surgeons retires between the ages of 63 and 67, there will be a shortage of about 10,000-19,900 surgeons by the year 2036 [3]. This shortage is also compounded by the effects of an unequal distribution of physicians, especially in more rural areas of the United States. Given these upcoming needs, it is critical to understand trends of the match process for surgical subspecialties, which will undoubtedly have implications for how the surgical workforce will change in size and distribution in the future.
The aim of this study is to examine trends in the number of registered applicants, matched applicants, and match rates across various surgical subspecialties from 2015 to 2024, using data from the NRMP and AUA. By characterizing these trends, this study will offer insight into the evolving landscape of surgical residency recruitment and training. These findings will inform future medical graduates who are applying to surgical specialties, guide program planning for surgical residencies, and contribute to the broader discussion surrounding the future of the surgical workforce.
Materials and methods
Yearly, the NRMP (nrmp.org) and AUA (auanet.org) publish data on their websites regarding the number of registered applicants, the number of matched applicants, and match rates. The data for surgical subspecialties including Neurologic Surgery, Orthopedic Surgery, Otolaryngology, Plastic Surgery, and Vascular Surgery for the years 2015-2024 was collected from the NRMP. This data was collected as published by the NMRP, without exclusion. Data regarding the specialties Thoracic Surgery, General Surgery, and Obstetrics and Gynecology were excluded due to either low numbers, not being a surgical subspecialty, or having overlap between surgery and primary care, respectively. The data for the Urology match for the years 2015-2024 was collected from the AUA. This data was also collected as published without exclusion. Very few positions go unfilled in these surgical subspecialties, so the number of matched applicants was also considered as a proxy for the number of available residency positions.
The data was transferred to a master Excel file (Microsoft Corporation, Redmond, Washington, United States) containing the information from the NMRP and AUA. General descriptives, frequencies, linear regression, and one-way analysis of variance (ANOVA) with post hoc Tukey's at a significance level of 0.05 were used to analyze the data with IBM SPSS Statistics for Windows, Version 30.0 (IBM Corp., Armonk, New York, United States). No study approval number was needed for this study as the information is retrospective, de-identified, and already publicly available by the NMRP and AUA.
Results
A total of 29,483 applicants registered to match into a surgical subspecialty between 2015 and 2024, out of which 19,535 applicants successfully matched into a surgical subspecialty. This is an average match rate of 66.3% across all surgical subspecialty applicants during the past decade, with a range of 58.8-73.6% (Figure 1). Applicant numbers peaked in the year 2022, reaching 3,555 registered applicants. This was also the year of the lowest average match rate (58.3%). Between 2015 and 2024, there was a net increase of 826 registered applicants (+31%). The number of matched applicants increased from 1,703 in 2015 to 2,234 by 2024 (+31.2%). See Appendix 1 for applicant numbers and match rates. There was no statistically significant difference in average match rates across years.
Line graph of average match rates for all surgical subspecialties combined between 2015 and 2024
A one-way ANOVA showed significant differences in match rates across surgical subspecialties (F(5,54)=11.782; p<0.001). Otolaryngology had the highest average match rate (74.5%), while Vascular Surgery had the lowest average match rate (52.7%). Neurologic Surgery, Orthopedic Surgery, Plastic Surgery, and Urology had match rates of 62.6%, 67.3%, 64.5%, and 67.9%, respectively. Overall, Vascular Surgery demonstrated a significantly lower match rate than all other specialties (p<0.05 for all comparisons). Otolaryngology had a significantly higher match rate than the specialties Neurologic Surgery (p=0.003), Plastic Surgery (p=0.018), and Vascular Surgery (p<0.001). With the exception of these findings, the average match rate of surgical specialties was not significantly different (Figure 2). See Appendix 2 for complete pairwise comparisons.
Match rates across surgical subspecialties during the time period of 2015-2024
Utilizing a univariate general linear model (GLM), there was a significant effect of year on the number of applicants (F(1,48)=85.36; p<0.001), as well as significant differences in the number of registered applicants across surgical subspecialties (F(5,48)=11.52; p<0.001). The interaction between year and specialty was also significant, suggesting that the rate of change of registered applicants varied between specialties (Table 1). Orthopedic Surgery demonstrated a significant increase in applicants over time compared to other surgical subspecialties, with an average increase of 58.8 applicants per year (p<0.001) between 2015 and 2024. Separate linear regression showed that applicant numbers increased significantly within Neurologic Surgery, Otolaryngology, Plastic Surgery, Urology, and Vascular Surgery with average rates of 8.7, 21.5, 18.8, 11.8, and 7.4 applicants per year, respectively. These within-specialty trends were statistically significant on their own (p range: 0.033 to <0.001; Table 2).
Another univariate GLM demonstrated a significant effect of year (F(1,48)=526.91; p<0.001) and specialty (F(5,48)=50.30; p<0.001) on the number of matched applicants. The interaction between year and specialty was also significant in this model, suggesting that the rate of change in matched applicants varied between surgical specialties (Table 3). Orthopedic Surgery demonstrated the largest increase in matched applicants over the past decade compared to other surgical subspecialties, with an average increase of 26.7 matched applicants per year (p<0.001). Otolaryngology (+10.6; p<0.001), Urology (+11.06; p<0.001), and Vascular Surgery (+5.1; p<0.001) also showed significant changes in the average number of matched applicants per year compared to other surgical subspecialties. Though not significantly different from other surgical subspecialties, Neurologic Surgery increased at an average rate of 3.74 matched applicants per year, and Plastic Surgery increased by an average of 7.67 matched applicants per year. Separate linear regression by specialty revealed that the number of matched applicants within each specialty increased significantly over time, with consistent upward trends across the past decade (p<0.001 for all; Table 4).
Discussion
Our findings highlight notable disparities within match rates and applicant trends among surgical subspecialties over the past decade. The average match rate among surgical subspecialties has varied greatly, with a notable low of 58.3% in the year 2022. This occurred despite a peak in applicant numbers that year, perhaps demonstrating increased competition or a mismatch between the number of applicants and the number of matched applicants, which could be considered the number of available residency positions. Match rates rose back closer towards the average match rate of 66.3% in subsequent years, yet this rise was not consistent, highlighting the fluctuating competitiveness of surgical subspecialties.
Otolaryngology demonstrated the highest average match rate, significantly greater than other surgical subspecialties, including Neurologic Surgery, Plastic Surgery, and Vascular Surgery. In particular, Vascular Surgery had the lowest average match rate and was significantly lower than all other surgical subspecialties. This is similar to other Vascular Surgery match rate research that has demonstrated a ratio of nine applicants hoping to fill four positions annually within the subspecialty [5]. Within Otolaryngology, some work has explored the impact of the Program-Specific Paragraph (PSP) and Otolaryngology Resident Talent Assessment (ORTA), which were put in place in 2015 and 2016. The PSP made it so that applicants had to submit an extra paragraph to express interest in specific programs, while the ORTA provided telephone-based structured interviews to assess qualities of applicants not otherwise encompassed by their residency application. The PSP was made optional in 2018, while the ORTA became a post-match, rather than pre-match requirement starting in 2019. De Ravin et al. found that applicant numbers dropped while match rates rose during the implementation of these programs, and after the PSP and ORTA were made optional and post-match, there was an associated rise in applicant numbers, and match rates dropped once more [6]. The implementation of extra steps such as these, though often tedious for applicants to wade through, may contribute to the higher match rates seen in Otolaryngology. It could be worthwhile to further explore other factors that make Otolaryngology report significantly greater match rates compared to other surgical subspecialties to improve match rates. With this in mind, it is still important to note that the match rate of Otolaryngology, though highest in this study, is still below the average match rate across all specialties.
Separate linear regression analyses demonstrated that the number of applicants and matched applicants increased significantly over time within each surgical subspecialty, reflecting consistent growth in interest and training capacity across the past decade. This suggests that interest in surgical subspecialties remains strong and continues to grow yearly, while residency programs are also steadily opening more residency positions in an attempt to meet this demand.
Even so, the significant interaction between year and specialty in both GLMs demonstrates that the growth in applicant numbers and match rates is not uniform across surgical subspecialties. Orthopedic Surgery showed substantial increases in both the number of applicants and matched applicants, which may reflect larger residency class sizes and high workforce demand. To a significant but not as great degree, Otolaryngology, Urology, and Vascular Surgery also matched a significantly greater number of applicants. Despite this, the rise in matched applicants does not seem to align with the desire, for instance, in Orthopedic Surgery, where for the almost 60 additional applicants who were interested each year, only about 26 more matches were made. The discrepancy underscores the current constraints of training capacity and increased competition that do not meet the expanding interest in surgical subspecialties. Importantly, this issue is systemic, as unmatched applicants are often highly qualified individuals who have excelled both academically and clinically, but are unable to secure a position due to insufficient capacity rather than inadequate merit [7].
The slower rate of increase when it comes to the number of matched applicants in Neurologic Surgery and Plastic Surgery may warrant further investigation to determine whether factors such as program limitations, applicant self-selection, or other barriers are contributing to slower growth compared to other surgical subspecialties. These findings are especially concerning given that the Neurologic Surgery workforce is projected to have a shortage of about 11% by the year 2035, while Plastic Surgery may be facing a shortage of 25% by that time [8]. These shortages are particularly alarming considering growing concerns of upcoming surgeon burnout, an aging surgical workforce, and their downstream effects on patient access and outcomes [9,10]. One thought may be that our existing resources are not being distributed in the most economic manner. For instance, though the number of General Surgery positions has increased to 1,717 in 2024, which is a 12% increase since 2020, the specialty is predicted to have 104% adequacy by 2035 [4,8]. Yet, while these projections suggest adequacy in General Surgery, it is critical to note that aggregate numbers can mask severe rural shortages. Therefore, the most strategic allocation must also take this into consideration instead of solely reducing positions for other specialties. Other recent surgical match trends data have highlighted a growth in surgical available and filled positions, though this growth is mostly led by General Surgery [11]. Such imbalances suggest that surgical training positions, as well as the resources required for them, could be more strategically allocated across specialties to better meet long-term workforce needs and minimize projected future shortages. Furthermore, as noted by the American College of Surgeons, though legislation such as the Resident Physician Shortage Reduction Act of 2021 have been introduced to expand residency position numbers, such bills have been introduced by Congress numerous times in the past without any progress [12].
From the perspective of a residency program, limitations to expansion may include Accreditation Council for Graduate Medical Education (ACGME) requirements that mandate low faculty-to-resident ratios [13,14], as well as minimal availability of operative volume, faculty, and hospital resources to support more trainees. While applicant motivation is not measured or reported on in this observational study, previous literature has suggested that desired compensation may be one factor that contributes to high numbers of registered applicants. For instance, many medical students graduate with high amounts of debt, putting them in undesirable financial situations especially compared to peers of similar age already in the workforce. In 2019, almost three out of four graduating medical students graduated with debt, at a median of $200,000 [15]. This may factor into Bernstein's suggestion that the higher the mean salary of the specialty, the greater the number of applicants per available position. The top three specialties illustrated in this article happened to be three surgical subspecialties: Orthopedic Surgery, Plastic Surgery, and Otolaryngology [16]. If this were to be one of the main drivers propelling applicant interest in surgical subspecialties, addressing workforce shortages may require more than just increasing the number of training slots. Systemic targeted policy interventions, such as loan repayment incentives or adjustments to compensation structures [15], would be necessary to resolve the gap between applicant interest and matched positions.
There are a few limitations to this study. Not all surgical subspecialties are represented, as some require fellowships and are not represented by NRMP data, and others, such as Thoracic Surgery, have too few data points to analyze alongside other surgical specialties. Future studies can focus specifically on those specialties to provide insight into their match processes and the implications on possible future workforce shortages. Additionally, though rare, utilizing matched applicants as a proxy for available positions may slightly underestimate true capacity because there have historically been a few unmatched positions in these surgical subspecialties in specific years. Finally, this study identifies trends regarding applicants and match numbers utilizing publicly available aggregate data. Therefore, these findings do not reflect individual-level factors, such as academic scores and geographic preferences, that can influence match outcomes. Systemic changes, such as preference signaling, Step 1 becoming pass/fail, and even the impact of COVID-19, may have impacted applicant behaviors and outcomes in ways that may not be captured by this analysis.
Conclusions
Matching into surgical subspecialties has only become more difficult over time, as the number of applicants expressing interest in surgical subspecialties is steadily growing. Even though the number of matched applicants, and, by proxy, available positions, has also increased over time, the growth in matched applicants is not consistent across surgical specialties and still does not meet applicant demands. To better address the growing gap between applicant demand and available residency positions, a variety of changes could be considered. Areas to look into include altering the residency application process for surgical subspecialties and optimizing the distribution of training resources to address the widening gap between supply and demand.
The reference list from the paper itself. Each links out to its DOI / PubMed record.
- 1About the National Resident Matching Program 5 2025 2025 https://www.nrmp.org/about/
- 2Urology and specialty matches 5 2025 American Urological Association 2025 https://www.auanet.org/meetings-and-education/for-residents/urology-and-specialty-matches
- 3Trends for 2024 match reveal more applicants interested in surgery Bull Am Coll Surg Fox M 24272092024 https://www.facs.org/for-medical-professionals/news-publications/news-and-articles/bulletin/2024/june-2024-volume-109-issue-6/trends-for-2024-match-reveal-more-applicants-interested-in-surgery/
- 4Results and data: 2024 main residency match ACS Brief [Internet 5 2025 Fox M 2024 https://www.nrmp.org/match-data/2024/06/results-and-data-2024-main-residency-match/
- 5Vascular surgery training positions and applicant 10-year trends with consideration for further expansion Ann Vasc Surg Jayroe H Weaver L Velazquez G 2912969520233724783610.1016/j.avsg.2023.05.003 · doi ↗ · pubmed ↗
- 6Changes in otolaryngology application requirements and match outcomes: are we doing any better?World J Otorhinolaryngol Head Neck Surg De Ravin E Frost AS Godse NR 144152920233738333010.1002/wjo 2.79PMC 10296048 · doi ↗ · pubmed ↗
- 7The 2022 orthopaedic surgery residency match leaves many qualified candidates unmatched Arthroscopy Lubowitz JH Brand JC Rossi MJ 175517573820223566017110.1016/j.arthro.2022.03.028 · doi ↗ · pubmed ↗
- 8Physician workforce: projections, 2020-2035 Physician Workforce: Projections, 2020-2035 [Internet 5 2025 2022 https://bhw.hrsa.gov/sites/default/files/bureau-health-workforce/Physicians-Projections-Factsheet.pdf