Effect of Epigallocatechin‐3‐Gallate on Depression‐Related Cytokines in Thalassemia Patients: Molecular and Cellular Evaluation
Mohammed N. Salman, Fouad Razzaq Al‐Burki, Hazim Ali Hussein, Laith A. Younus, Fadhil A. Nasser, Hasanain A. A. Almohseni

TL;DR
This study explores how EGCG, a compound from Winged Marigold, affects inflammation-related genes in thalassemia patients, potentially offering a new way to manage depression-linked inflammation.
Contribution
The study demonstrates EGCG's dose-dependent suppression of depression-related cytokines in β-thalassemia patients for the first time.
Findings
EGCG significantly reduces cytokine gene expression linked to depression in thalassemia patients.
Higher EGCG concentrations show stronger suppression of inflammatory cytokines like IL-6 and TNF-α.
Cytotoxic effects of EGCG were observed at concentrations above 10 μM, highlighting the need for careful dosing.
Abstract
Epigallocatechin‐3‐gallate (EGCG) is the major polyphenolic compound found in Winged Marigold and Green tea. It exhibits well‐established anti‐inflammatory and antioxidant characteristics. EGCG has been shown to suppress the expression of several pro‐inflammatory cytokines, including IL‐6, IL‐1β, TNF‐α, and IFN‐γ. However, its effect on inflammation‐related cytokines associated with depression in β‐thalassemia patients remains incompletely understood. Five peripheral blood mononuclear cell (PBMC) samples from β‐thalassemia patients were selected for this study in order to demonstrate how EGCG affects the inflammatory state in thalassemic individuals. EGCG was extracted from Winged Marigold using an ethanol‐based method, and its purity was confirmed using HPLC and LC–MS/MS analyses. PBMCs were treated with ethanolic solvent alone (control) or with EGCG at concentrations of 5, 25, and 50…
Genes, proteins, chemicals, diseases, species, mutations and cell lines named across the full text — each resolved to its canonical identifier and authoritative record.
Click any figure to enlarge with its caption.
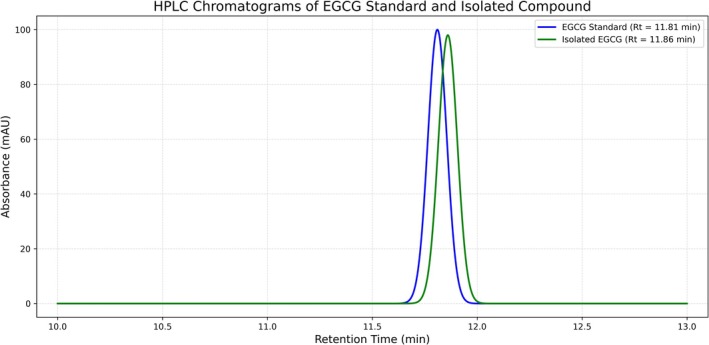 FIGURE 1
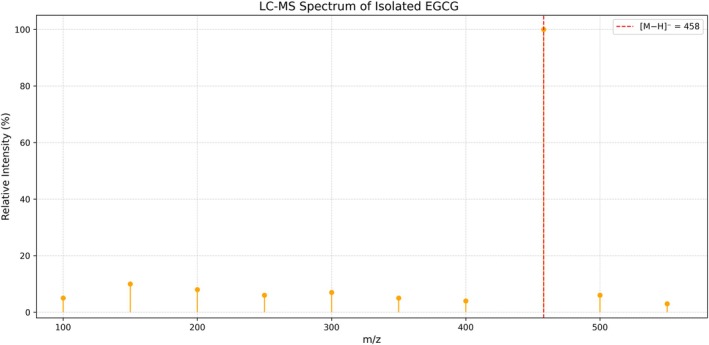 FIGURE 2
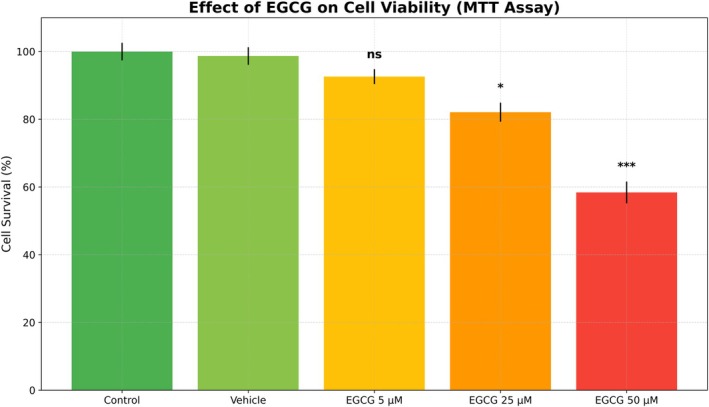 FIGURE 3
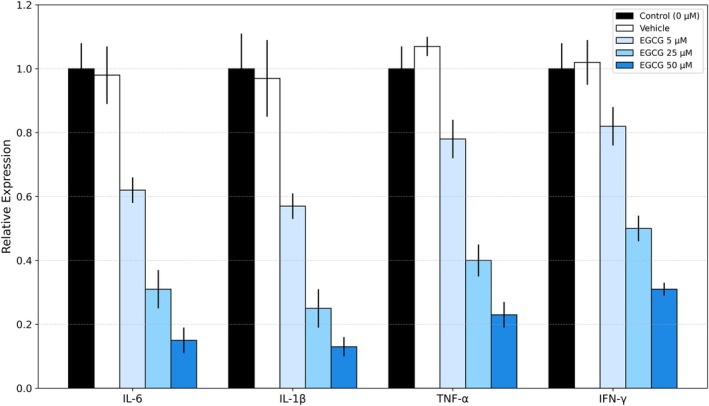 FIGURE 4
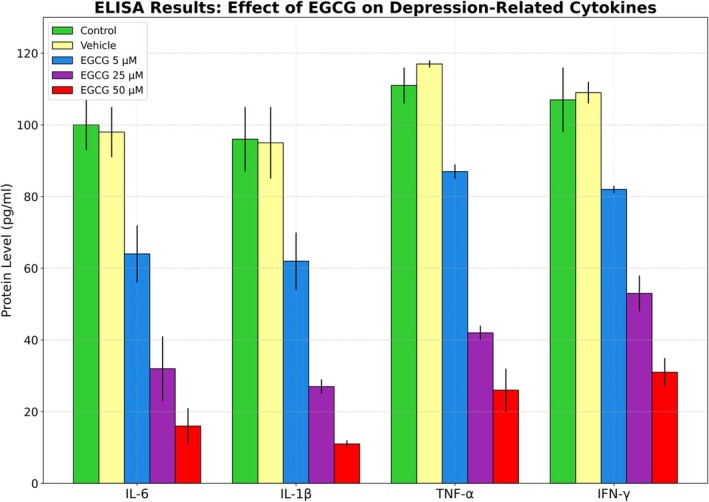 FIGURE 5
| % Sample | RT (min) | Peak area | Peaks number | Purity |
|---|---|---|---|---|
| EGCG standard | 11.81 | 100% | 1 | 100.00% |
| Isolated EGCG | 11.86 | 98.70% | 1 | 98.78% |
| Gene | Primer sequences | Annealing temp./Time |
|---|---|---|
| IL‐6 |
F: 5′AGACAGCCACTCACCTCTTCAG3′ R: 5′TTCTGCCAGTGCCTCTTTGCTG3′ | 60°C/60 s |
| TNF‐α |
F: 5′CCTCTCTCTAATCAGCCCTCTG3′ R: 5′GAGGACCTGGGAGTAGATGAG3′ | |
| IL‐1β |
F: 5′ATGATGGCTTATTACAGTGGCA3′ R: 5′GTCGGAGATTCGTAGCTGGA3′ | |
| IFN‐γ |
F: 5′TGGAAAGAGGAGAGTGACAG3′ R: 5′GCTCTGCAGGATTTTCATGTC3′ | |
| GAPDH |
F: 5′GAAGGTGAAGGTCGGAGTC3′ R: 5′GAAGATGGTGATGGGATTTC3′ |
| Material name | Volume (μL) |
|---|---|
| Master Mix of SYBR Green | 10 |
| Primer forward | 0.5 |
| Primer reverse | 0.5 |
| cDNA | 2 |
| Water (nuclease‐free) | 7 |
| Total | 20 |
| Peak | R.T. | Area Pct% | Library/ID | Ref |
|---|---|---|---|---|
| 1 | 5.391 | 2.9994 | Pyrrolidine | 692 |
| 2 | 6.585 | 3.307 | Morpholine | 2090 |
| 3 | 7.669 | 0.3719 | Dimethyl Sulfoxide | 1144 |
| 4 | 8.659 | 0.3204 | 2‐Methyl‐1‐vinylimidazole | 6015 |
| 5 | 9.547 | 0.6894 | 3H‐Pyrazol‐3‐one, 2,4‐dihydro‐4,4,5‐trimethyl— | 12,673 |
| 6 | 9.657 | 4.9475 | Dimethyl trisulfide | 12,503 |
| 7 | 9.955 | 1.0397 | 1,5‐Hexadiene, 3‐chloro— | 9433 |
| 8 | 10.152 | 0.2815 | dl‐Threitol | 11,035 |
| 9 | 10.411 | 0.4244 | Hydroxyurea, N, N′, O‐trimethyl— | 9807 |
| 10 | 10.631 | 0.2723 | dl‐Threitol | 11,035 |
| 11 | 10.961 | 0.5425 | 1‐(1′‐Pyrrolidinyl)‐2‐propanone | 13,576 |
| 12 | 11.652 | 0.3287 | 2,5‐Dimethylfuran‐3,4(2H,5H)‐Dione | 13,925 |
| 13 | 11.825 | 0.9743 | 2‐Pyrrolidinone | 1737 |
| 14 | 12.225 | 0.6675 | But‐3‐enyl (E)‐2‐methylbut‐2‐enoate | 32,167 |
| 15 | 12.312 | 0.7729 | Pyridine, 2,3,4,5‐tetrahydro— | 1484 |
| 16 | 12.414 | 0.9985 | Succinic acid, 1‐methoxydec‐4‐yl pentyl ester | 267,896 |
| 17 | 12.72 | 0.2788 | 1‐Piperidinamine | 4075 |
| 18 | 12.893 | 0.472 | Ethanamine, N‐ethyl‐N‐nitroso— | 4735 |
| 19 | 13.027 | 1.7945 | 4H‐Pyran‐4‐one, 2,3‐dihydro‐3,5‐dihydroxy‐6‐methyl— | 23,823 |
| 20 | 13.459 | 0.3349 | N‐(4‐Aminophenyl)‐N‐methyl‐2‐(4‐methylpiperazin‐1‐yl) acetamide | 150,503 |
| 21 | 13.891 | 0.5067 | Catechol | 6512 |
| 22 | 14.009 | 0.2916 | 1‐azetidinepropanoic acid, ethyl ester | 34,373 |
| 23 | 14.119 | 0.4911 | 4‐Vinylphenol | 10,651 |
| 24 | 14.551 | 0.8568 | 1‐Methyl‐2‐pyrrolidineethanol | 14,884 |
| 25 | 14.888 | 0.6483 | 1,2,2‐Trimethylpropyl trifluoroacetate | 74,308 |
| 26 | 15.532 | 1.0929 | 2‐Methoxy‐4‐vinylphenol | 28,303 |
| 27 | 15.58 | 0.973 | Tropidine, 2‐acetyl‐8‐demethyl— | 28,964 |
| 28 | 15.878 | 0.304 | 5‐Hexenal, 4‐methylene— | 6576 |
| 29 | 15.933 | 0.4327 | Phthalic acid, ethyl 3,4‐dimethylphenyl ester | 197,021 |
| 30 | 16.271 | 0.3285 | 2,8,9‐Trioxa‐5‐aza‐1‐silabicyclo (3.3.3) undecane, 1‐methoxy— | 81,701 |
| 31 | 16.452 | 0.2752 | N‐Nitroso‐2,4,4‐trimethyloxazolidine | 23,715 |
| 32 | 16.891 | 25.0229 | Epigallocatechin‐3‐Gallate | 27,157 |
| 33 | 17.221 | 0.6002 | Decane, 5,6‐dimethyl— | 45,510 |
| 34 | 17.944 | 1.0329 | N‐(4‐Chlorobenzylidene) methylamine | 30,805 |
| Group | EGCG (μM) | Cell survival (%) ± SD | Statistical significance |
|---|---|---|---|
| Control | 0 | 100.0 ± 2.6 | — |
| Vehicle | 0 | 98.7 ± 2.6 | ns |
| EGCG‐treated | 5 | 92.6 ± 2.2 | ns |
| EGCG‐treated | 25 | 82.1 ± 2.8 |
|
| EGCG‐treated | 50 | 58.4 ± 3.2 |
|
| Target gene | Control (0 μM) | Vehicle | EGCG 5 μM | EGCG 25 μM | EGCG 50 μM | Statistical significance |
|---|---|---|---|---|---|---|
| IL‐6 | 1.00 ± 0.08 | 0.98 ± 0.09 | 0.62 ± 0.04 | 0.31 ± 0.06 | 0.15 ± 0.04 |
|
| IL‐1β | 1.00 ± 0.11 | 0.97 ± 0.12 | 0.57 ± 0.04 | 0.25 ± 0.06 | 0.13 ± 0.03 |
|
| TNF‐α | 1.00 ± 0.07 | 1.07 ± 0.03 | 0.78 ± 0.06 | 0.40 ± 0.05 | 0.23 ± 0.04 |
|
| IFN‐γ | 1.00 ± 0.08 | 1.02 ± 0.07 | 0.82 ± 0.06 | 0.50 ± 0.04 | 0.31 ± 0.02 |
|
| Cytokine | Control (pg/mL) | Vehicle | EGCG 5 μM | EGCG 25 μM | EGCG 50 μM | Statistical significance |
|---|---|---|---|---|---|---|
| IL‐6 | 100 ± 7 | 98 ± 7 | 64 ± 8 | 32 ± 9 | 16 ± 5 |
|
| IL‐1β | 96 ± 9 | 95 ± 10 | 62 ± 8 | 27 ± 2 | 11 ± 1 |
|
| TNF‐α | 111 ± 5 | 117 ± 1 | 87 ± 2 | 42 ± 2 | 26 ± 6 |
|
| IFN‐γ | 107 ± 9 | 109 ± 3 | 82 ± 1 | 53 ± 5 | 31 ± 4 |
|
Peer Reviews
No public reviews on file for this paper yet. If you reviewed it on a platform where reviews are public (OpenReview, ICLR, NeurIPS, ICML), you can paste yours below so the community can read it here.
Videos
No videos yet. Explain this paper in a talk, walkthrough, or lecture? Add one.
Taxonomy
TopicsTea Polyphenols and Effects · Tryptophan and brain disorders · Sirtuins and Resveratrol in Medicine
Background
1
Defects in hemoglobin synthesis or protein structure result in hemoglobinopathies. The most common hemoglobinopathy is thalassemia, with an estimated 5% of people worldwide having at least one thalassemia variant allele [1].
Alpha and beta thalassemia are the two varieties. Individuals with beta thalassemia can present with hypochromic microcytic anemia with elevated HbA2 or as silent carriers with acceptable hematological markers. However, individuals with beta thalassemia major and intermedia are known as transfusion‐dependent or non‐transfusion‐dependent thalassemia, respectively, and need transfusions either regularly or infrequently. From transfusion‐dependent patients who may potentially develop multi‐organ problems to asymptomatic individuals, the clinical picture of β‐thalassemia varies greatly [2].
The management of β‐thalassemia is fraught with challenges. Traditional treatments such as regular transfusions, iron chelation therapy, and splenectomy can lead to systemic complications. These protocols and treatment tools sometimes could lead to increased oxidative stress, continuous inflammation, and disruption of immune system regulation. From an immunological point of view, many patients show abnormalities in T and B lymphocyte subtypes, higher white blood cell counts, and altered cytokine secretion profiles [3].
Documented immunological studies have shown specific alterations in T cell populations in these patients, where reduced CD4^+^ helper T cells and elevated CD8^+^ cytotoxic T cells lead to a decreased CD4/CD8 ratio. This imbalance is correlated with decreased proliferation of lymphocytes and decreased function of natural killer (NK) cells; as a result, there is increased susceptibility to infections [4].
Many researchers are now using a novel method to investigate the relationship between immunological dysregulation and thalassemia‐related mental decline. Anxiety and depression are among the psychological conditions linked to chronic systemic inflammation. Immune activity and mental health are biologically related because the development and progression of depressive signs and symptoms have been associated with increased expression of pro‐inflammatory cytokines such as interleukin‐6 (IL‐6), interleukin‐1β (IL‐1β), tumor necrosis factor‐alpha (TNF‐α), and interferon‐gamma (IFN‐γ). Additionally, these pro‐inflammatory cytokines interfere with neural plasticity, neurotransmitter balance, and hypothalamic–pituitary–adrenal (HPA) axis control [5].
Epigallocatechin‐3‐Gallate (EGCG), a bioactive polyphenol found in green tea, is also found in other plants such as the Winged Marigold [6].
Additionally, and due to its anti‐inflammatory, antioxidant, and neuroprotective properties, EGCG has been widely studied. Various inflammatory cytokines are suppressed, many free radicals are neutralized, and key inflammatory signaling sequelae, including the nuclear factor kappa‐light‐chain‐enhancer of activated B cells (NF‐κB) pathway, are inhibited by EGCG.
Due to the immune modulating properties of EGCG, it could be a promising medication for alleviating neuroinflammatory symptoms associated with β‐thalassemia [7]. Till now, there has been a noticeable lack of studies examining the effects at both the molecular and cellular levels. Techniques such as reverse transcription quantitative polymerase chain reaction (RT‐qPCR) for expression of gene, in addition to ELISA and 3‐(4,5‐dimethylthiazol‐2‐yl)‐2,5‐diphenyltetrazolium bromide (MTT) assays for protein expression and cellular function, represent a great chance to explore the activity of this herbal medication [8].
By employing both molecular and cellular methodologies, the present research aimed to evaluate the effects of EGCG on the expression of cytokines associated with depression in β‐thalassemia patients. The study aimed to provide a more complete understanding of the therapeutic mechanisms of EGCG. The findings made could possibly permit the development of adjunctive therapies designed to address both the psychological and immunological dimensions of β‐thalassemia.
Materials and Methods
2
GC MS Analysis
2.1
Extraction: Using 75% ethanol as a solvent, the extraction procedures were performed in accordance with Harborne's [9] technique to extract the active chemicals. Then, using a gas chromatography‐mass spectrometer (GC‐MASS) (Agilent 5977 A MSD, USA), the number of active compounds in the plant leaves was calculated, utilizing the Mass Hunter GC/MS Acquisition and Mass Hunter qualitative software (USA). All procedures were performed in accordance with the manufacturer's guidelines.
Isolation of Epigallocatechin‐3‐Gallate
2.2
To isolate EGCG from the plant extract, the standard method of Silica Gel Column Chromatography (SGC) described by Amarowicz et al. [10] was used, with fraction detection via TLC. The target compound was then purified using semi‐preparative and analytical RP C18 HPLC, according to the steps described by Bhatia et al. [11], Blahová and Lehotay [12].
Purity and Identity Confirmation of Isolated EGCG
2.3
Analytical HPLC Procedure
2.3.1
The isolated compound was analyzed using HPLC to ensure its purity according to the method described by Tra and Bui [13]. An Agilent 1260 Infinity was used (column: C18: 250 × 4.6 mm, 5 μm). The mobile phase was a gradient extraction of solvent A: water with 0.1% trifluoroacetic acid (TFA) and solvent B: acetonitrile. The gradient was from 10% to 40% of TFA for the required time (20 min). The flow rate was 1.0 mL/min. At a wavelength of 280 nm UV light was used for detection. The injection volume was 20 μL and the retention time (RT) for the standard EGCG was ≈11.8 min, while the retention time for the isolated compound was ≈11.8 min (Table 1).
Two sharp peaks, one at 11.81 min (the standard) and the other at 11.86 min (representing the isolated sample) were noted in the graph (Figure 1). The similarity of the two peaks in terms of shape and location confirmed the success of the isolation with a high purity rate of 98.78% (Figure 1).
HPLC chromatograms results.
LC–MS/MS Analysis
2.4
To confirm the molecular identity of the isolated EGCG according to the method described by Niessen [14], mass spectrometry analysis was performed accordingly. The ionization mode was negative ESI, with predicted mass/energy of 457 [M−H]^−^ and detected mass/energy of 457.09. The molecular ion peak matched exactly with the theoretical mass of EGCG (C_22_H_18_O_11_, MW = 458.37), confirming the identity (Figure 2).
LC–MS spectrum of the isolated sample of EGCG.
Figure 2 shows the main peak (red) at m/z = 458.37, representing the [M − H]^−^ ion of Epigallocatechin‐3‐Gallate, confirming the identity of the EGCG compound.
Cell Viability Assay (MTT Assay)
2.5
To identify the cytotoxic activity of an ethanolic extract of Winged Marigold, containing purified Epigallocatechin‐3‐Gallate (EGCG), an MTT assay was performed (at Al‐Amin Center for Advanced Biotechnology, Najaf, in collaboration with the Cancer Research Center at the University of Tehran) on β‐thalassemia patients' peripheral blood mononuclear cells (PBMCs), and all the steps according to the protocol described by Mosmann [15] were carried out.
Cell Culture and Treatment
2.6
To extract PBMCs from whole blood samples by methods described by Boyum [16], Ficoll–Hypaque density gradient centrifugation was utilized. Prior to being incubated at 37°C, they were cultivated at a density of 1 × 10⁵ cells/well in RPMI‐1640 media (Gibco, Thermo Fisher Scientific, USA) supplemented with 10% fetal bovine serum and 1% penicillin–streptomycin. PBMCs were subsequently exposed to EGCG at concentrations of 5, 25, or 50 μM for a duration of 24 h. Two control groups were also included, one of which was left untreated and the other of which was given an equal ethanolic solvent.
MTT Assay Procedure
2.7
Following the 24‐h treatment period referred to above, 10 μL of MTT solution (5 mg/mL) was added to each well. The wells were then incubated for 4 h at 37°C. The formazan crystals were then placed in 100 μL of dimethyl sulfoxide (DMSO) solution, and the absorbance was finally measured at 570 nm by using a microplate reader. The percentage of cells that survived treatment was compared to that in the untreated control. Every experiment was performed in triplicate.
Statistical Analysis
2.8
Standard deviation (SD) ± mean was used to represent the data. To identify pairwise differences, one‐way Tukey's post hoc test was used. Analysis of Variance (ANOVA) was used to evaluate statistical significance between groups. To conduct statistical studies, GraphPad Prism version 9.0 (GraphPad Software, San Diego, CA, USA) was utilized. At p < 0.05, differences were deemed statistically significant.
RT‐qPCR for Cytokine Gene Expression
2.9
Quantitative real‐time PCR (RT‐qPCR) was performed on RNA extracted from treated PBMCs to assess the regulatory effect of purified Epigallocatechin‐3‐Gallate (EGCG) on depression‐related cytokine gene expression in β‐thalassemia patients.
Treatment and Design of Experiments
2.10
As previously mentioned, PBMCs were isolated and cultivated. Untreated, ethanol‐equivalent, and EGCG‐treated groups were created. In the EGCG‐treated group, EGCG was added to the cells at concentrations of 5 and 25 μM. The MTT assay results, which showed non‐toxic and physiologically effective doses, served as the basis for the treatment concentrations that were chosen. The treatments were incubated with the cells for a full day.
Total RNA Extraction and cDNA Synthesis
2.11
By using the TRIzol reagent (Invitrogen, USA), total RNA was extracted following the manufacturer's protocol. The purity and concentration of RNA were assessed by Nano drop spectrophotometry (260/280 ratio).
In a 20 μL reaction volume one microgram of RNA was reverse‐transcribed to cDNA using the Revert Aid First Strand cDNA Synthesis Kit (Thermo Fisher Scientific).
By using Primer‐BLAST from the National Center for Biotechnology Information (NCBI) website (https://www.ncbi.nlm.nih.gov/), the Primers for the five genes under study were designed as in (Tables 2 and 3).
Data Analysis
2.12
Relative gene expression was calculated using the 2^‐ΔΔCt method, normalized to GAPDH, and expressed as fold change relative to the control group: −ΔCt = Ct (BCL2) − Ct (GAPDH).
−ΔΔCt=ΔCttreatment−ΔCtcontrol
All reactions were performed in triplicates (n = 3). Three duplicates of each reaction were carried out. For statistical analysis, One‐way ANOVA test and Tukey's post hoc test were used, p < 0.05 considered statistically significant.
Results and Discussion
3
GC MS Analysis of Winged Marigold Extract
3.1
The results of the GC MS analysis of the Winged Marigold leaf extract, shown in Table 4, revealed the presence of 34 compounds belonging to many chemical classes, most notably phenols, nitrogenous cyclic compounds (morpholine and pyrrolidine), and sulfur compounds (dimethyl trisulfide), in addition to esters and organic acids. Epigallocatechin‐3‐Gallate (EGCG) constituted the highest percentage (25.02%), reinforcing its importance as a key compound that may contribute to biological activity associated with cytokine modulation. Other phenolic compounds, such as Catechol and 4‐Vinylphenol, were also present; these are known for their antioxidant properties and potential anti‐inflammatory effects.
MTT Assay
3.2
Epigallocatechin‐3‐Gallate (EGCG), isolated from Winged Marigold extract, showed a dose‐dependent concentration effect on immune cells (PBMCs) isolated from thalassemia patients. The Control and Vehicle groups revealed high cell survival rates (100.0% and 98.7%, respectively), suggesting that the Vehicle does not have any toxic effect per se (not significant).
At a concentration of 5 μM of EGCG, a slight decrease in cell survival (92.6%) was observed without statistical significance (ns), indicating that this concentration is relatively safe for cells. At a concentration of 25 μM, a greater decrease in cell survival (82.1%) occurred, which was statistically significant (p < 0.005), suggesting the onset of a dose‐dependent cytotoxic effect. The 50 μM concentration recorded a significant decrease in cell survival rate to 58.4%, which is highly statistically significant (p < 0.001), demonstrating a clear cytotoxic or pro‐apoptotic activity of EGCG at higher doses (all these findings were reported in Table 5 and Figure 3). These results were identical to those reported in the study of Fen et al. [17], Xuerui et al. [18], and Leonilla et al. [19], in which there was a decrease in cell survival rather than control.
EGCG effect on cell viability (MTT assay).
Genes Expression
3.3
EGCG showed a dose‐dependent inhibitory effect on the expression of the inflammatory genes IL‐6, IL‐1β, TNF‐α, and IFN‐γ in the blood cells of thalassemia patients (Table 6 and Figure 4). Gene expression at 5 μM was relatively low compared to the control and vehicle, but this difference was not statistically significant. With increasing doses (25 and 50 μM), expression showed a statistically significant decrease (p < 0.001 for IL‐6 and IL‐1β, p < 0.01 for TNF‐α, and p < 0.05 for IFN‐γ). IL‐6 and IL‐1β showed the greatest inhibition at 50 μM (0.15 ± 0.04 and 0.13 ± 0.03, respectively), suggesting a central role for them in inflammation associated with depression in patients with thalassemia. These observations mirror the results of Debora et al. [20], Nahid et al. [21], and BaoHe et al. [22].
EGCG effect on pro‐inflammatory cytokine genes in peripheral blood mononuclear cells (PBMCs) of patients suffering from thalassemia.
The likeness of the control and vehicle values also demonstrates that the inhibition is produced by EGCG and not by the solvent compound. These findings support EGCG as a potential regulator of inflammatory gene expression in thalassemia.
ELISA Analysis
3.4
Significant reductions, in a dose‐dependent manner of the levels of cytokine proteins (IL‐6, IL‐1β, TNF‐α, and IFN‐γ) implicated in inflammation and linked to depression in thalassemia patients following EGCG treatment were confirmed by ELISA and RT‐qPCR data. EGCG, in doses of 25 and 50 μM, inhibited protein levels of these cytokine proteins, and these findings were consistent with the decreases in mRNA levels of the corresponding genes (Table 7). The agreement between ELISA and gene expression analyses suggests that the modulatory impact of EGCG leads to a reduction in cytokine secretion and a suppression of gene expression. The impact is especially evident for IL‐6 and IL‐1β, consistent with their established roles as central mediators in neuroinflammation and depression.
In contrast, while TNF‐α and IFN‐γ levels also showed significant reductions, their slightly higher residual levels may reflect their broader responsibilities in maintaining immune system equilibrium.
The reduction of cytokine production we observed in the present study seems to further suggest that EGCG might affect those inflammatory signaling cascades (such as NF‐κB) that directly upregulate the expression of these mediators. In addition, the observed patterns in ELISA were also accompanied by similar behaviors in RT‐qPCR and hence enhanced the credibility of the results and discarded the likelihood that these effects are just post‐transcriptional regulation.
Therefore, this investigation appears to provide evidence that EGCG could be used in combination to be used as an adjuvant treatment to manage neuroinflammatory symptoms in thalassemia patients, which might result in better mood‐related outcomes through cytokine modulation.
The graph in Figure 5 shows the effect of EGCG on depression‐related cytokines in thalassemia patients through ELISA test results, with each group representing a different color.
EGCG effect on depression‐related cytokines.
Funding
The authors have nothing to report.
Ethics Statement
This study was conducted in accordance with the Declaration of Helsinki and approved by the scientific committee of the Clinical Pharmacy Department/College of Pharmacy at Jabir Ibn Hayyan University for Medical and Pharmaceutical Sciences, Iraq. Approval was obtained from Al‐Najaf Health Directorate, Ministry of Health, and Information Center for Research & Development of Najaf Province. 3. The objectives and methodology were explained to all participants and verbal consent in the study had been taken.
Conflicts of Interest
The authors declare no conflicts of interest.
The reference list from the paper itself. Each links out to its DOI / PubMed record.
- 1ACMC , A. L. E. de Oliveira , A. A. L. Rodrigues , et al., “Hematological Ratios and Cytokine Profiles in Heterozygous Beta‐Thalassemia,” Hematology, Transfusion and Cell Therapy 47, no. 3 (2025): 103845.10.1016/j.htct.2025.103845 PMC 1214003840367897 · doi ↗ · pubmed ↗
- 2A. Dordevic , I. Mrakovcic‐Sutic , S. Pavlovic , M. Ugrin , and J. Roganovic , “Beta Thalassemia Syndromes: New Insights,” World Journal of Clinical Cases 13, no. 10 (2025): 100223.40191679 10.12998/wjcc.v 13.i 10.100223 PMC 11670029 · doi ↗ · pubmed ↗
- 3M. Faranoush , P. Faranoush , I. Heydari , et al., “Complications in Patients With Transfusion Dependent Thalassemia: A Descriptive Cross‐Sectional Study,” Health Science Reports 6, no. 10 (2023): e 1624.37841947 10.1002/hsr 2.1624 PMC 10568004 · doi ↗ · pubmed ↗
- 4L. Xie , J. Fang , J. Yu , W. Zhang , Z. He , and L. Ye , “The Role of CD 4+ T Cells in Tumor and Chronic Viral Immune Responses,” Med Comm (2020) 4, no. 5 (2023): e 390.37829505 10.1002/mco 2.390PMC 10565399 · doi ↗ · pubmed ↗
- 5A. Sălcudean , C. R. Bodo , R. A. Popovici , et al., “Neuroinflammation. A Crucial Factor in the Pathophysiology of Depression: A Comprehensive Review,” Biomolecules 15, no. 4 (2025): 502.10.3390/biom 15040502 PMC 1202462640305200 · doi ↗ · pubmed ↗
- 6M. Menegazzi , R. Campagnari , M. Bertoldi , R. Crupi , R. Di Paola , and S. Cuzzocrea , “Protective Effect of Epigallocatechin‐3‐Gallate (EGCG) in Diseases With Uncontrolled Immune Activation: Could Such a Scenario Be Helpful to Counteract COVID‐19?,” International Journal of Molecular Sciences 21, no. 14 (2020): 5171.32708322 10.3390/ijms 21145171 PMC 7404268 · doi ↗ · pubmed ↗
- 7L. Capasso , L. De Masi , C. Sirignano , et al., “Epigallocatechin Gallate (EGCG): Pharmacological Properties, Biological Activities and Therapeutic Potential,” Molecules 30, no. 3 (2025): 654.39942757 10.3390/molecules 30030654 PMC 11821029 · doi ↗ · pubmed ↗
- 8P. Israelsson , E. Dehlin , I. Nagaev , E. Lundin , U. Ottander , and L. Mincheva‐Nilsson , “Cytokine m RNA and Protein Expression by Cell Cultures of Epithelial Ovarian Cancer, Methodological Considerations on the Choice of Analytical Method for Cytokine Analyses,” American Journal of Reproductive Immunology 84, no. 1 (2020): e 13249.32307767 10.1111/aji.13249 · doi ↗ · pubmed ↗