Relationship Between Serum Levels of Unsaturated Fatty Acids and Type 2 Diabetes Mellitus: A Cross‐Sectional Analysis of NHANES 2003–2004 and 2011–2012
Shan Liu, Ying Liu, Lipeng Liu, Fengxia Lv, Huijuan Wang, Xiuyun Zhang, Shuxia Yue, Liwen Zhang, Jin Zhou

TL;DR
This study found that certain unsaturated fatty acids in the blood are linked to a lower risk of Type 2 diabetes, while others are linked to a higher risk.
Contribution
The study provides new insights into the heterogeneous relationships between specific serum fatty acids and Type 2 diabetes.
Findings
Docosapentaenoic acid (DPAn3) and arachidonic acid (AA) are inversely associated with Type 2 diabetes.
Oleic acid (OA) and eicosenoic acid (EA) are positively associated with Type 2 diabetes.
Nonlinear associations were observed for dihomo-γ-linolenic acid (DGLA), AA, and EA with Type 2 diabetes.
Abstract
The role of serum fatty acids in Type 2 diabetes mellitus (T2DM) remains unclear. We aimed to assess and compare the associations of multiple serum unsaturated fatty acids with the prevalence of T2DM to elucidate their heterogeneous relationship profiles. This study used the data from the National Health and Nutrition Examination Surveys (2003–2004 and 2011–2012). Weighted proportional and multivariate logistic regression analyses were conducted to evaluate the associations of serum polyunsaturated fatty acids (PUFAs) and monounsaturated fatty acids (MUFAs) with T2DM status and to adjust for potential confounders. The study included 3760 individuals. Results of the multivariate logistic regression analyses showed that among the serum PUFAs, docosapentaenoic acid (DPAn3) (22:5 n3) was associated with lower odds of T2DM (odds ratio [OR]: 0.595, 95% CI: 0.375–0.942, P trend = 0.028).…
Genes, proteins, chemicals, diseases, species, mutations and cell lines named across the full text — each resolved to its canonical identifier and authoritative record.
Click any figure to enlarge with its caption.
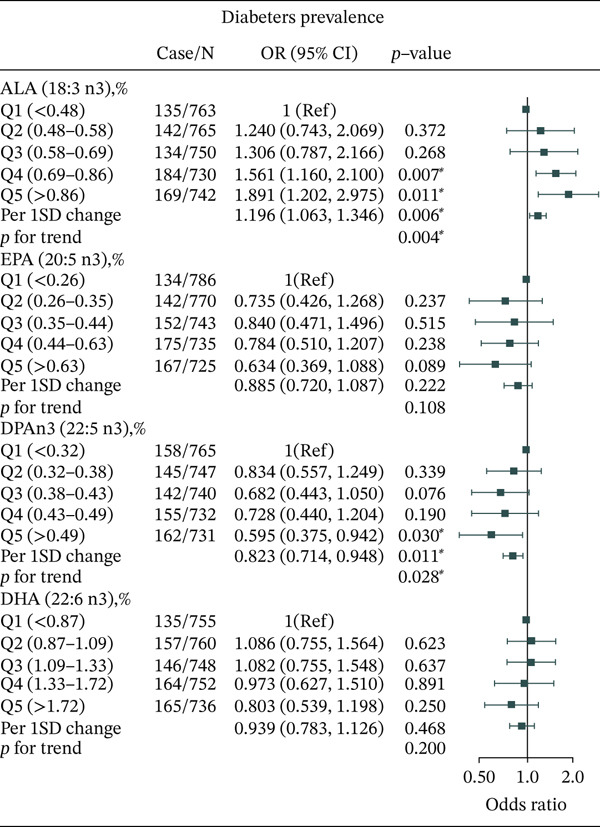 Figure 1
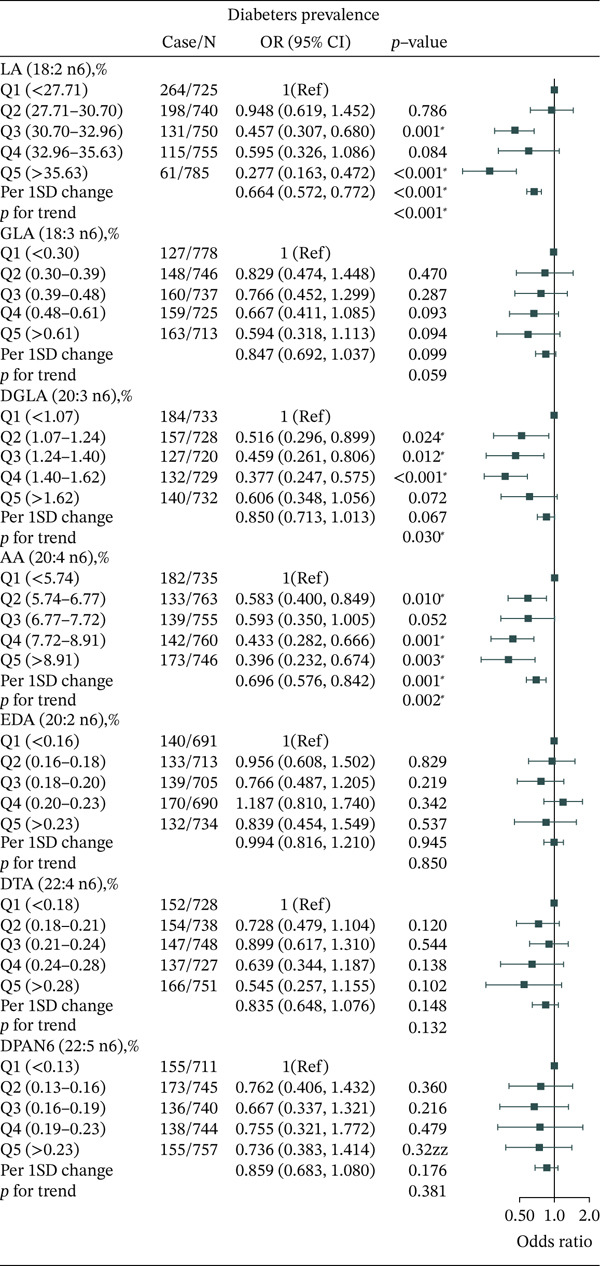 Figure 2
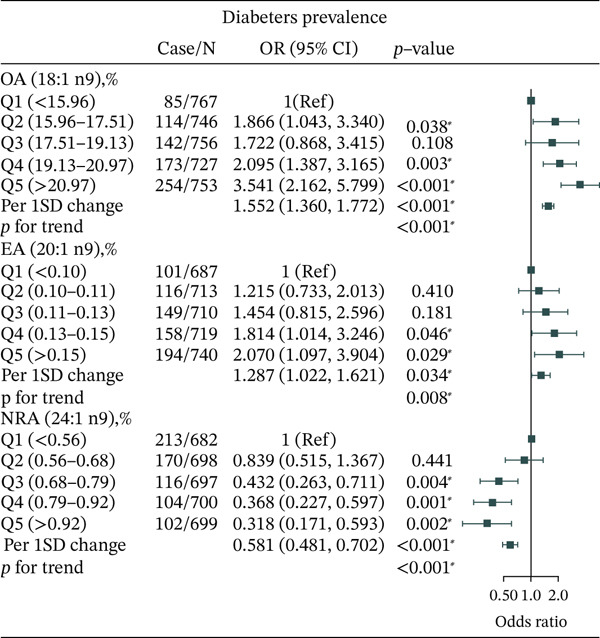 Figure 3
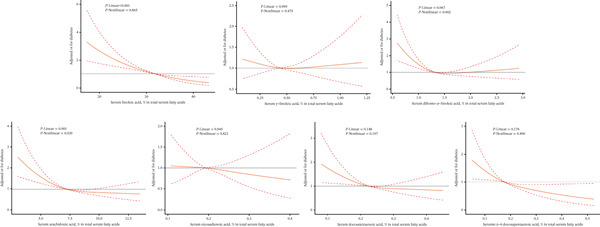 Figure 4
| Total | Control | T2DM |
| |
|---|---|---|---|---|
| Male, % | 47.9 (46–49.8) | 47.1 (45.4‐49.0) | 52.0 (46.9–57.0) | 0.054 |
| Age, years | 46.02 (44.94–47.1) | 43.51 (42.35–44.67) | 59.95 (58.29‐61.60) | < 0.001 |
| BMI, kg/m2 | 28.29 (27.94–28.64) | 27.51 (27.20–27.82) | 32.68 (32.05–33.30) | < 0.001 |
| Waist circumference, cm | 97.49 (96.5–98.48) | 95.24 (94.39–96.09) | 110.54 (108.90–112.17) | < 0.001 |
| Non‐Hispanic White, % | 69.5 (63.9–74.6) | 70.9 (65.6–76.0) | 61.7 (52.8–69.9) | 0.001 |
| Education | < 0.001 | |||
| Less than high school, % | 17.9 (15.1–21.1) | 16.4 (13.5–20.0) | 25.8 (22.0–30.0) | |
| High school or equivalent, % | 23.3 (20.7–26.1) | 22.4 (19.9–25.0) | 28.6 (23.5–34.0) | |
| College graduate or above, % | 58.8 (55–62.5) | 61.2 (57.3–65.0) | 45.6 (40.6–51.0) | |
| Family income‐to‐poverty ratio | < 0.001 | |||
| ≤1.0 | 15.4 (13.1–18) | 14.9 (12.6–18.0) | 18.2 (14.3–23.0) | |
| 1.0–3.0 | 36.3 (32.8–39.8) | 34.9 (31.3–39.0) | 43.9 (38.6–49.0) | |
| >3.0 | 48.3 (44.2–52.6) | 50.2 (45.9–55.0) | 38.0 (32.6–44.0) | |
| Smoking status | < 0.001 | |||
| Never smoker, % | 54.1 (51.4–56.8) | 55.2 (52.2–58.0) | 48.4 (42.8–54.0) | |
| Former smoker, % | 23.6 (21.3–26) | 21.8 (19.5–24.0) | 33.1 (27.9–39.0) | |
| Current smoker, % | 22.3 (19.8–25.1) | 23.0 (20.1–26.0) | 18.6 (14.9–23.0) | |
| Drinking status | < 0.001 | |||
| Nondrinker, % | 27.5 (23.8–31.7) | 24.4 (20.8–28.0) | 44.4 (38.0–51.0) | |
| Low‐to‐moderate drinker, % | 9.96 (8.75–11.32) | 10.03 (8.86–11.00) | 9.57 (6.91–13.0) | |
| Heavy drinker, % | 62.5 (59–65.9) | 65.5 (62.1–69.0) | 46.0 (39.6–53.0) | |
| Physical activity | < 0.001 | |||
| No activity, % | 31.6 (29.1–34.1) | 28.8 (26.4–31.0) | 46.9 (41.5–52.0) | |
| Moderate activity, % | 32.6 (31.1–34.1) | 31.5 (30.1–33.0) | 38.6 (32.4–45.0) | |
| Vigorous activity, % | 35.9 (33.2–38.6) | 39.7 (37.0–43.0) | 14.5 (11.6–18.0) | |
| Prevalent hypertension, % | 30.8 (28.1–33.6) | 24.6 (22.3–27.0) | 64.8 (60.8–69.0) | < 0.001 |
| Prevalent cardiovascular, % | 9.06 (7.57–10.8) | 5.80 (4.48–7.00) | 26.8 (22.4–32.0) | < 0.001 |
| Prevalent cancer, % | 9.13 (7.84–10.6) | 7.62 (6.48–9.00) | 17.3 (13.6–22.0) | < 0.001 |
| ALA (18:3 n3), % in total serum fatty acids | 0.68 (0.66–0.7) | 0.67 (0.65–0.69) | 0.71 (0.68–0.73) | 0.011 |
| EPA (20:5 n3), % in total serum fatty acids | 0.5 (0.47–0.52) | 0.50 (0.47–0.53) | 0.50 (0.46–0.53) | < 0.001 |
| DPAn3 (22:5 n3), % in total serum fatty acids | 0.41 (0.41–0.42) | 0.41 (0.41–0.42) | 0.41 (0.39–0.42) | < 0.001 |
| DHA (22:6 n3), % in total serum fatty acids | 1.27 (1.22–1.33) | 1.27 (1.21–1.33) | 1.28 (1.22–1.34) | 0.004 |
| MA (14:1 n5), % in total serum fatty acids | 0.07 (0.07–0.07) | 0.07 (0.07–0.07) | 0.07 (0.07–0.08) | 0.514 |
| LA (18:2 n6), % in total serum fatty acids | 31.58 (31.37–31.79) | 32.04 (31.79–32.29) | 29.06 (28.59–29.53) | < 0.001 |
| GLA (18:3 n6), % in total serum fatty acids | 0.48 (0.47–0.49) | 0.48 (0.47–0.49) | 0.48 (0.46–0.50) | 0.044 |
| DGLA (20:3 n6), % in total serum fatty acids | 1.37 (1.35–1.39) | 1.38 (1.36–1.40) | 1.33 (1.30–1.36) | 0.052 |
| AA (20:4 n6), % in total serum fatty acids | 7.26 (7.17–7.35) | 7.29 (7.21–7.38) | 7.09 (6.82–7.36) | 0.038 |
| EDA (20:2 n6), % in total serum fatty acids | 0.19 (0.19–0.2) | 0.19 (0.19–0.20) | 0.19 (0.19–0.20) | 0.306 |
| DTA (22:4 n6), % in total serum fatty acids | 0.23 (0.22–0.23) | 0.23 (0.22–0.23) | 0.23 (0.22–0.23) | 0.082 |
| DPAn6 (22:5 n6), % in total serum fatty acids | 0.18 (0.17–0.18) | 0.18 (0.17–0.18) | 0.17 (0.17–0.18) | 0.302 |
| PA (16:1 n7), % in total serum fatty acids | 2.05 (2.01–2.1) | 2.02 (1.97–2.06) | 2.26 (2.18–2.35) | 0.006 |
| VA (18:1 n7), % in total serum fatty acids | 1.29 (1.27–1.3) | 1.28 (1.26–1.29) | 1.34 (1.31–1.37) | 0.149 |
| OA (18:1 n9), % in total serum fatty acids | 18.64 (18.48–18.81) | 18.36 (18.20–18.52) | 20.23 (19.88–20.58) | < 0.001 |
| EA (20:1 n9), % in total serum fatty acids | 0.12 (0.12–0.13) | 0.12 (0.12–0.12) | 0.13 (0.13–0.14) | < 0.001 |
| NRA (24:1 n9), % in total serum fatty acids | 0.07 (0.06–0.07) | 0.74 (0.73–0.75) | 0.65 (0.62–0.67) | < 0.001 |
- —Chronic Disease Management Research Project of National Health Commission Capacity Buildingand Continuing Education Center
- —Science Research Project of Hebei Education Department
- —Key Research and Development Plan Hebei Province
- —Medical Science Research Key Project Plan of Hebei Province
- —Natural Science Foundation of Hebei Province10.13039/501100003787
Peer Reviews
No public reviews on file for this paper yet. If you reviewed it on a platform where reviews are public (OpenReview, ICLR, NeurIPS, ICML), you can paste yours below so the community can read it here.
Videos
No videos yet. Explain this paper in a talk, walkthrough, or lecture? Add one.
Taxonomy
TopicsFatty Acid Research and Health · Diabetes, Cardiovascular Risks, and Lipoproteins · Metabolomics and Mass Spectrometry Studies
1. Introduction
Diabetes mellitus is a group of metabolic disorders characterized by hyperglycemia arising from multiple etiologies. The major subtype is Type 2 diabetes mellitus (T2DM), which accounts for more than 90% of the diabetic population [1]. Both microvascular and macrovascular complications are primary contributors to morbidity and mortality in patients with T2DM, imposing a substantial financial burden on many countries [2]. Therefore, implementing effective preventive measures is crucial.
Unsaturated fatty acids (UFAs), including polyunsaturated fatty acids (PUFAs) and monounsaturated fatty acids (MUFAs), have received considerable attention in diabetes research [3, 4]. PUFAs are categorized into omega‐3 (n‐3) and omega‐6 (n‐6 PUFAs) subclasses [5]. Previous studies have shown that certain n‐3 and n‐6 PUFAs play important roles in regulating glucose homeostasis, lipid metabolism, and inflammation [6]. Although some studies have suggested that PUFA intake may help reduce the risk of T2DM [7, 8], others have reported an increased risk [9, 10]. MUFAs, such as the n‐7 and n‐9 subclasses, have also gained increasing research interest. Reports indicate that n‐7 and n‐9 MUFAs participate in the regulation of inflammation and lipid metabolism [11–13], processes that are involved in the onset and progression of diabetes. However, the relationship between UFAs, including both PUFAs and MUFAs, and T2DM remains unclear. Circulating UFAs levels are influenced by multiple factors, including dietary intake, endogenous biosynthesis, and metabolic pathways [14]. For example, PUFAs, such as α‐linolenic acid (ALA) (18:3n‐3) and linoleic acid (LA) (18:2n‐6), can be metabolized in vivo to generate further PUFA derivatives [15]. Thus, circulating PUFA levels reflect the combined influence of dietary intake and metabolic conversion [16]. Therefore, objectively measured circulating PUFA concentrations may more accurately represent bioavailable PUFA status than dietary data alone. However, relatively few studies have evaluated the associations between objectively measured circulating PUFAs and MUFAs and T2DM. In our previous study, we explored the relationships between serum PUFA and MUFA levels and prediabetes risk [17]. The role of these major PUFAs in T2DM has yet to be fully clarified, and the contributions of less frequently measured PUFAs and MUFAs also require further investigation.
In this study, we aimed to evaluate the associations of specific serum PUFAs (n‐3 and n‐6) and MUFAs (n‐5, n‐7, and n‐9) with the prevalence of T2DM using data from the National Health and Nutrition Examination Survey (NHANES).
2. Methods
2.1. Study Population
The NHANES is a systematic national health survey program involving interviews and examinations, including demographic information, dietary data, biological monitoring, and physical assessments. Data were obtained from NHANES cycles 2003–2004 and 2011–2012, which provided serum PUFA measurements (n = 19878). After excluding participants younger than 18 years (n = 8394), those with missing serum fatty acid values (n = 7139), and those diagnosed with prediabetes (n = 585), a total of 3760 participants were included in the present analysis.
2.2. Assessment of Serum Fatty Acids
Serum fatty acids were quantified using gas chromatography–mass spectrometry (GC‐MS). Esterified fatty acids were hydrolysed primarily from triglycerides, phospholipids, and cholesteryl esters through sequential mineral acid and base treatment in the presence of heat. Total fatty acids were extracted from 100 μL of serum or plasma using hexane, along with an internal standard containing 18 stable isotopically labelled fatty acids to correct for recovery. The extract was derivatized with pentafluorobenzyl bromide in the presence of triethylamine to produce pentafluorobenzyl esters. The reaction mixture was injected into a capillary gas chromatograph column to separate individual fatty acids from other matrix constituents. Detection was performed using electron capture negative‐ion mass spectrometry within 34 min. Quantification was achieved by comparing the analyte peak area in each sample with that of a calibrator solution, with results corrected using the internal standard peak area.
Serum fatty acids included PUFAs (n‐3 and n‐6) and MUFAs (n‐5, n‐7, and n‐9). n‐3 fatty acids included α‐linolenic acid (18:3 n‐3) (ALA), eicosapentaenoic acid (20:5 n‐3) (EPA), docosapentaenoic acid (22:5 n‐3) (DPAn3), and docosahexaenoic acid (22:6 n‐3) (DHA). The n‐5 fatty acids included myristoleic acid (14:1 n‐5) (MA). n‐6 fatty acids included linoleic acid (18:2 n‐6) (LA), γ‐linolenic acid (18:3 n‐6) (GLA), dihomo‐γ‐linolenic acid (20:3 n‐6) (DGLA), arachidonic acid (20:4 n‐6) (AA), eicosadienoic acid (20:2 n‐6) (EDA), docosatetraenoic acid (22:4 n‐6) (DTA), and docosapentaenoic acid (22:5 n‐6) (DPAn6). The n‐7 fatty acids included palmitoleic acid (16:1 n‐7) (PA) and cis‐vaccenic acid (18:1 n‐7) (VA). The n‐9 fatty acids included oleic acid (18:1 n‐9) (OA), eicosenoic acid (20:1 n‐9) (EA), and nervonic acid (24:1 n‐9) (NRA).
2.3. Diagnosis of T2DM
T2DM was defined as self‐reported physician diagnosis of diabetes, current use of insulin or oral hypoglycemic medications, fasting blood glucose ≥ 7.0 mmol/L (126 mg/dL), 2‐h post–oral glucose tolerance test plasma glucose ≥ 11.1 mmol/L (200 mg/dL), or glycated hemoglobin (HbA1c) ≥ 6.5% (48 mmol/mol).
2.4. Assessment of Covariates
Covariates included age (continuous), sex (male, female), race (non‐Hispanic White, others), education (less than high school, high school, college graduate, or above), waist circumference (WC) (continuous), body mass index (BMI) (continuous), family income‐to‐poverty ratio (≤ 1.0, 1.0–3.0, > 3.0), smoking (never, former, or current), drinking (nondrinker, low‐to‐moderate drinker, or heavy drinker), physical activity (no, moderate, or vigorous), hypertension (no or yes), cardiovascular disease (CVD) (no or yes), and cancer (no or yes).
BMI was calculated as weight (kg)/height^2^ (m^2^). Former smokers were individuals who had smoked more than 100 cigarettes in their lifetime but quit. Current smokers had smoked more than 100 cigarettes and currently smoked every day or on some days. Low‐to‐moderate drinkers were defined as < 2 drinks/day for men and < 1 drink/day for women, and heavy drinkers as ≥ 2 drinks/day for men and ≥ 1 drink/day for women. Physical activity was divided as follows: no activity, with almost no physical exercise in the past 30 days; moderate activity, defined as ≥ 10 min of moderate‐intensity exercise in the past 30 days causing slight sweating or slight increases in heart or respiratory rate; vigorous activity, defined as ≥ 10 min of vigorous exercise in the past 30 days causing excessive sweating or marked increases in heart or respiratory rate. Hypertension was defined as average systolic blood pressure ≥ 140 mmHg, average diastolic blood pressure ≥ 90 mmHg, use of antihypertensive medication, or self‐reported physician diagnosis. CVD was determined based on self‐reported physician diagnoses of coronary heart disease, angina pectoris, myocardial infarction, or stroke. Cancer status was defined as a self‐reported physician diagnosis.
2.5. Statistical Analysis
Given the complex NHANES sampling design, sample weights, clustering, and stratification were applied. Survey design effects were accounted for using clustering and stratification variables linked to testing weights and demographic datasets from two‐year mobile test centres. Continuous variables were presented as means (95% CI), and age‐adjusted general linear models were used for comparisons between the T2DM and control groups. Categorical variables were expressed as percentages (95% CI), and chi‐square tests were used for group comparisons. To evaluate the association between PUFAs and T2DM prevalence, three multivariate logistic regression models were developed. Model 1 adjusted for age. Model 2 adjusted for age, sex, race, education, BMI, WC, poverty‐income ratio (PIR), smoking, drinking, and physical activity. Model 3 further adjusted for hypertension, CVD, and cancer. Restricted cubic splines (RCSs) were applied to assess possible nonlinear associations between serum PUFAs and T2DM. Analyses were conducted using R software Version 4.1.3. A p value < 0.05 was considered statistically significant.
3. Results
Table 1 describes the baseline characteristics of the 3760 individuals. Compared with the control group, patients with T2DM tended to be older, have higher WC and BMI, lower education level and family income, lower rates of smoking and drinking, lower physical activity levels, and higher prevalence of hypertension, CVD, and cancer. Baseline characteristics according to quintiles of each PUFA are shown in Tables S1–S17. Several serum PUFAs showed similar characteristics. For example, higher levels of DPAn3 (22:5 n3) and DHA (22:6 n3) were associated with older age, lower BMI and WC, and reduced smoking prevalence. Similarly, higher levels of LA (18:2 n6), EDA (20:2 n6), and NRA (24:1 n9) correlated with lower BMI and WC and lower smoking rates. Higher PA (16:1 n7) and VA (18:1 n7) levels were associated with reduced physical activity and a higher likelihood of hypertension or CVD.
Associations between different n‐3 and n‐6 PUFAs and T2DM prevalence are shown in Tables S18–S21. Among n‐3 PUFAs, ALA (18:3 n3) was positively associated with T2DM in Model 3 (OR = 1.891, 95% CI: 1.202–2.975, P trend = 0.004) (Figure 1). Higher DPAn3 (22:5 n3) levels were associated with lower T2DM prevalence (OR = 0.595, 95% CI: 0.375–0.942, p = 0.030). No association was observed between EPA (20:5 n3) or DHA (22:6 n3) and T2DM. For n‐5 and n‐7 MUFAs, there was no association between n‐5 or n‐7 MUFAs and T2DM prevalence in Model 3 (Figure S1).
Adjusted ORs for associations between different n‐3 PUFAs and T2DM.
With respect to n‐6 PUFAs, several findings were consistent. Compared with the lowest LA (18:2 n6) level (Q1 < 27.71), LA levels in Q3 (30.70–32.96) and Q5 (> 35.63) were associated with lower T2DM prevalence (Q3: OR = 0.457, 95% CI: 0.307–0.680, p = 0.001; Q5: OR = 0.277, 95% CI: 0.163–0.472, p < 0.014; P trend < 0.001). Similar associations were observed for DGLA (20:3 n6) and AA (20:4 n6). However, serum levels of GLA (18:3 n6), EDA (20:2 n6), DTA (22:4 n6), and DPA (22:5 n6) showed no correlation with T2DM (Figure 2).
Adjusted OR for associations between different n‐6 PUFAs and T2DM.
Regarding n‐9 MUFAs, OA (18:1 n9) was associated with increased odds of T2DM (OR = 3.541, 95% CI: 2.162–5.799, p < 0.001) after adjusting for age, sex, race, education, WC, BMI, PIR, smoking, drinking, physical activity, hypertension, CVD, and cancer (Figure 3). In contrast, NRA (24:1 n9) was associated with lower odds of T2DM (OR = 0.381, 95% CI: 0.171–0.593, p = 0.002). EA (20:1 n9) was associated with higher odds of T2DM (OR = 2.070, 95% CI: 1.097–3.904, p = 0.029).
Adjusted OR for associations between different n‐9 PUFAs and T2DM.
Nonlinear analyses were also conducted. For patients with T2DM, a linear relationship was observed between ALA (18:3 n3) and DPAn3 (22:5 n3) (P − Linear = 0.006; P − Linear = 0.011) (Figure S2). For n‐5 MUFAs, PA (16:1 n7) showed a linear association with T2DM (P − Linear = 0.023) (Figure S3). DGLA (20:3 n6) and AA (20:4 n6) demonstrated nonlinear associations in T2DM patients (DGLA: P − Nonlinear = 0.002; AA: P − Nonlinear = 0.039) (Figure 4). EA (20:1 n9) was nonlinearly associated with T2DM (P − Nonlinear = 0.023) (Figure S4).
Associations between serum LA (18:2 n6), GLA (18:3 n6), DGLA (20:3 n6), AA (20:4 n6), EDA (20:2 n6), DTA (22:4 n6), and DPAn6 (22:5 n6) with T2DM. Assessed by multivariable‐adjusted ORs using Logistic regression models and restricted cubic splines. The models were adjusted for age (years), sex (male/female), BMI (kg/m2), waist circumference (cm), race (non‐Hispanic White/others), education level (less than high school/high school or equivalent/college graduate or above), family income‐to‐poverty ratio (≤ 1.0/1.0–3.0/> 3.0), smoking status (never smoker/former smoker/current smoker), drinking status (nondrinker/low‐to‐moderate drinker/heavy drinker), physical activity (no activity/moderate activity/vigorous activity), hypertension (no/yes), cardiovascular disease (no/yes), and cancer (no/yes). LA, linoleic acid; GLA, gamma‐linolenic acid; DGLA, dihomo‐gamma‐linolenic acid; AA, arachidonic acid; EDA, eicosadienoic acid; DTA, docosatetraenoic acid; DPAn6, n‐6 docosapentaenoic acid.
4. Discussion
The research findings indicate that n‐3 PUFAs (DPAn3 [22:5 n3]), n‐6 PUFAs (LA [18:2 n6], DGLA [20:3 n6], and AA [20:4 n6]), and n‐9 MUFAs (NRA [24:1 n9]) were associated with lower odds of T2DM, whereas n‐3 PUFAs (ALA [18:3 n3]) and n‐9 MUFAs (EA [20:1 n9] and OA [18:1 n9]) were associated with a higher likelihood of T2DM. In contrast, other n‐3 PUFAs (EPA [20:5 n3] and DHA [22:6 n3]) and n‐6 PUFAs (GLA [18:3 n6], DPA [22:5 n6], DTA [22:4 n6], and EDA [20:2 n6]) showed no associations with T2DM. Additionally, n‐5 and n‐7 MUFAs were not associated with T2DM. The present study also revealed nonlinear associations of serum n‐6 PUFA DGLA (20:3 n6) and n‐9 MUFA EA (20:1 n9) with T2DM. These findings should be interpreted with caution, given the cross‐sectional design. The observed associations do not establish causality and may reflect protective or deleterious effects, or may be secondary to metabolic alterations in established diabetes.
Over recent decades, numerous studies have investigated the role of n‐3 PUFAs in T2DM development, yet results remain controversial. Our study found no association between total serum n‐3 PUFAs (Table S22) and T2DM, consistent with previous findings [18–20]. The relationship between ALA (18:3 n3) and T2DM has been inconsistent. Consistent with our findings, several studies have shown that ALA (18:3 n3) is positively associated with T2DM risk [21, 22]; however, some studies have reported that ALA (18:3 n3) is negatively [23, 24] or not associated with T2DM [25]. These inconsistencies in reporting might be attributed to dietary factors, dietary assessment bias, and sample sizes, or may hinge on the geographical regions [18, 26]. There was no significant association of n‐3 PUFAs (EPA [20:5 n3] and DHA [22:6 n3]) with T2DM in our study, which is consistent with other studies [9, 27, 28]. DPAn3 (22:5n3) is an intermediate metabolite of EPA (20:5n3) and DHA (22:6n3). Compared with DHA (22:6 n3) and EPA (20:5 n3), DPAn3 (22:5 n3) is a less well‐investigated n‐3 PUFA [29]. The mechanism underlying the effect of DPAn3 (22:5 n3) on glycemic control remains unclear [19, 30]. Moreover, few studies have examined the correlation between circulating DPAn3 (22:5 n3) and T2DM. We observed an inverse association between serum DPAn3 (22:5 n3) and T2DM; however, another similar study reported no association [31]. These results indicate that n‐3 PUFAs may play a role in the development of T2DM. However, since our study examined data from a cross‐sectional study, this association could also be interpreted as a consequence of altered metabolic states in established T2DM. In general, the role of n‐3 PUFAs in T2DM still needs further clarity.
In this study, we evaluated eight serum n‐6 PUFAs and their associations with T2DM. Total serum n‐6 PUFAs were inversely associated with T2DM, consistent with previous studies [32, 33]. Among n‐6 PUFAs, AA (20:4 n6) and LA (18:2 n6) are the most extensively studied. LA is the predominant n‐6 PUFA and may benefit glycemic regulation [7, 34]. We found that higher levels of LA were associated with reduced T2DM prevalence, consistent with a meta‐analysis of 20 cohort studies showing lower T2DM risk [35]. Although prospective data suggest a potentially protective effect, our cross‐sectional results may alternatively reflect reduced LA levels secondary to metabolic disruption. AA (20:4 n6), traditionally viewed as proinflammatory [36, 37], has more recently been shown to give rise to anti‐inflammatory metabolites and protect pancreatic β‐cells [38–40]. This aligns with our findings and other studies showing reduced T2DM risk with higher AA levels [20, 33] T2DM. However, other studies found no association [41, 42]. Such inconsistencies may reflect differences in populations, analytical approaches, and PUFA quantification methods.
Regarding less widely studied n‐6 PUFA species, including GLA (18:3 n6), DGLA (20:3 n6), EDA (20:2 n6), DTA (22:4 n6), and DPAn6 (22:5 n6), limited evidence exists on their association with T2DM. In the present study, serum DGLA (20:3 n6) and T2DM were inversely associated with T2DM, whereas another study reported a positive association [33]. Our findings suggested no association between GLA (18:3 n6) and T2DM, consistent with similar findings [41]. For DPAn6 and DTA, no significant associations with T2DM were observed. These observations underscore the importance of evaluating these specific n‐6 PUFA subtypes rather than just concentrating on the basic n‐6 PUFAs.
Although n‐3 and n‐6 PUFAs have been extensively studied, MUFAs remain relatively underexplored. In contrast to n‐3 and n‐6 fatty acids, MUFAs are considered “nonessential” [43, 44]. Few studies have evaluated serum n‐5, n‐7, and n‐9 MUFAs. MA (14:1 n5), a representative n‐5 MUFA, has been shown to induce apoptosis in LNCaP cells [45]. Some evidence suggests that n‐7 and n‐9 MUFAs may modulate insulin resistance [11, 46–48]. However, little epidemiological data exist on the relationship between serum MUFAs (n‐5, n‐7, and n‐9) and T2DM. In our study, n‐5 and n‐7 MUFAs were not associated with T2DM, whereas among n‐9 MUFAs, EA (20:1 n9) and OA (18:1 n9) were associated with increased odds of T2DM, and NRA (24:1 n9) was inversely associated. These opposing associations within the n‐9 group suggest complex subtype‐specific functions that may reflect metabolic changes related to T2DM. Given the limited available evidence, further epidemiological investigations are warranted.
A major strength of our study lies in evaluating the associations between objectively measured serum PUFA and MUFA biomarkers and T2DM prevalence using nationally representative NHANES data. We assessed specific n‐3 and n‐6 PUFAs as well as MUFAs (n‐5, n‐7, and n‐9). However, this study also has limitations. First, self‐reported information may introduce misclassification bias, including in sociodemographic variables. Although we adjusted for potential confounders, unmeasured factors such as dietary intake may influence the associations. Second, fatty acid data were available only for 2003–2004 and 2011–2012. In the future, a well‐designed large‐scale population study is needed to determine the relationship between FAs and the prevalence of T2DM. Thirdly, the utility of circulating fatty acid levels in guiding dietary intake may be limited by metabolic conversion and individual differences. Fourth, the single‐time measurement of circulating fatty acids, which may not adequately represent long‐term or stable exposure levels. Finally, due to the observational and cross‐sectional nature of our study, causal inference and temporal direction cannot be determined. Future prospective cohort and longitudinal studies are needed to clarify these associations.
5. Conclusions
Overall, this study identified distinct cross‐sectional associations between specific serum fatty acids and T2DM prevalence. Several serum n‐3 and n‐6 PUFAs were inversely associated with T2DM prevalence, whereas n‐9 MUFAs were positively associated with T2DM prevalence, and n‐5 and n‐7 MUFAs showed no association. These findings provide detailed descriptive data and underscore the need for further research to clarify causal relationships linking multiple circulating UFAs with T2DM.
Author Contributions
Shan Liu and Ying Liu contributed equally to the article. Shan Liu and Ying Liu wrote and revised the manuscript. Lipeng Liu, Fengxia Lv, Huijuan Wang, Xiuyun Zhang, and Shuxia Yue handled the data. Liwen Zhang and Jin Zhou conceived the study and provided supervision. All authors contributed to the article. Shan Liu and Ying Liu contributed equally to this work as co–first authors.
Funding
This work was supported by the Natural Science Foundation of Hebei Province, No.H2024206065; Medical Science Research Key Project Plan of Hebei Province, No.20181036; Key Research and Development Plan Hebei Province, No.19277795D; Science Research Project of Hebei Education Department, BJ2025204; the Chronic Disease Management Research Project of National Health Commission Capacity Buildingand Continuing Education Center, No.GWJJMB202510024187.
Disclosure
All authors approved the submitted version.
Ethics Statement
Ethical review and approval were not required for this study due to the source data of this study being from the NHANES. Informed consent from all participants was not required in the present study according to the national legislation and the institutional requirements.
Conflicts of Interest
The authors declare no conflict of interest.
Supporting information
Supporting information Additional supporting information can be found online in the Supporting Information section. Includes the baseline characteristics according to quintiles of serum PUFAs and MUFAs (Table S1–Table S17), adjusted OR for associations of PUFAs and MUFAs with the prevalence of T2DM (Table S18–Table S22). Adjusted OR for associations of different n‐5 and n‐7 PUFAs with the prevalence of T2DM (Figure S1), associations of n‐3 PUFAs with the prevalence of T2DM (Figure S2), associations of serum MA (14:1 n5), PA (16:1 n7), and VA (18:1 n7) with the prevalence of T2DM (Figure S3), associations of n‐9 MUFAs with the prevalence of T2DM (Figure S4).
The reference list from the paper itself. Each links out to its DOI / PubMed record.
- 1American Diabetes Association , 2. Classification and Diagnosis of Diabetes:Standards of Medical Care in Diabetes-2018, Diabetes Care. (2018) 41, no. Supplement_1, S 13–S 27, 10.2337/dc 18-S 002, 2-s 2.0-85039703274.29222373 · doi ↗ · pubmed ↗
- 2da Rocha F. J. , Ogurtsova K. , Linnenkamp U. , Guariguata L. , Seuring T. , Zhang P. , Cavan D. , and Makaroff L. E. , IDF Diabetes Atlas Estimates of 2014 Global Health Expenditures on Diabetes, Diabetes Research and Clinical Practice. (2016) 117, 48–54, 10.1016/j.diabres.2016.04.016, 2-s 2.0-84968877365.27329022 · doi ↗ · pubmed ↗
- 3Imamura F. , Micha R. , Wu J. H. , de Oliveira Otto M. C. , Otite F. O. , Abioye A. I. , and Mozaffarian D. , Effects of Saturated Fat, Polyunsaturated Fat, Monounsaturated Fat, and Carbohydrate on Glucose-Insulin Homeostasis: A Systematic Review and Meta-Analysis of Randomised Controlled Feeding Trials, P Lo S Medicine. (2016) 13, no. 7, e 1002087, 10.1371/journal.pmed.1002087, 2-s 2.0-84979640426, 27434027.27434027 PMC 4951141 · doi ↗ · pubmed ↗
- 4Zhuang P. , Liu X. , Li Y. , Li H. , Zhang L. , Wan X. , Wu Y. , Zhang Y. , and Jiao J. , Circulating Fatty Acids and Genetic Predisposition to Type 2 Diabetes: Gene-Nutrient Interaction Analysis, Diabetes Care. (2022) 45, no. 3, 564–575, 10.2337/dc 21-2048, 35089324.35089324 · doi ↗ · pubmed ↗
- 5Brown T. J. , Brainard J. , Song F. , Wang X. , Abdelhamid A. , and Hooper L. , Omega-3, Omega-6, and Total Dietary Polyunsaturated Fat for Prevention and Treatment of Type 2 Diabetes Mellitus: Systematic Review and Meta-Analysis of Randomised Controlled Trials, British Medical Journal. (2019) 366, l 4697, 10.1136/bmj.l 4697, 2-s 2.0-85069866781.31434641 PMC 6699594 · doi ↗ · pubmed ↗
- 6Ulven S. M. , Leder L. , Elind E. , Ottestad I. , Christensen J. J. , Telle-Hansen V. H. , Skjetne A. J. , Raael E. , Sheikh N. A. , Holck M. , Torvik K. , Lamglait A. , Thyholt K. , Byfuglien M. G. , Granlund L. , Andersen L. F. , and Holven K. B. , Exchanging a Few Commercial, Regularly Consumed Food Items With Improved Fat Quality Reduces Total Cholesterol and LDL-Cholesterol: A Double-Blind, Randomised Controlled Trial, British Journal of Nutrition. (2016) 116 · doi ↗ · pubmed ↗
- 7Telle-Hansen V. H. , Gaundal L. , and Myhrstad M. C. W. , Polyunsaturated Fatty Acids and Glycemic Control in Type 2 Diabetes, Nutrients. (2019) 11, no. 5, 10.3390/nu 11051067, 2-s 2.0-85066833972.PMC 656683431091649 · doi ↗ · pubmed ↗
- 8Meyer K. A. , Kushi L. H. , Jacobs D. R. , and Folsom A. R. , Dietary Fat and Incidence of Type 2 Diabetes in Older Iowa Women, Diabetes Care. (2001) 24, no. 9, 1528–1535, 11522694, 10.2337/diacare.24.9.1528, 2-s 2.0-0035463894.11522694 · doi ↗ · pubmed ↗