Diagnostic Value of Serum Pepsinogen and Helicobacter pylori Infection in Gastric Cancer Screening in Western Zhejiang
Dong-Hai Yan, Yu-Fang Li

TL;DR
This study evaluates how serum pepsinogen and Helicobacter pylori infection can help detect gastric cancer in western Zhejiang.
Contribution
The study introduces a noninvasive model combining pepsinogen and H. pylori for gastric cancer screening in a specific region.
Findings
Serum pepsinogen levels and H. pylori infection rates differ between gastric cancer and benign disease patients.
A model combining pepsinogen, H. pylori, age, and sex achieved an AUC of 0.851 for gastric cancer detection.
Pepsinogen levels correlate with tumor size, classification, and cancer stage in gastric cancer patients.
Abstract
The aim of this study is to assess the screening value of serum pepsinogen (PG) expression and Helicobacter pylori (Hp) infection for gastric cancer (GC) in western Zhejiang. A retrospective analysis was conducted on patients who underwent gastroscopy at the First People′s Hospital of Jiande between July 2020 and July 2023. Participants were classified into four groups: chronic nonatrophic gastritis, chronic atrophic gastritis, peptic ulcer, and GC, which included early gastric cancer (EGC) and advanced GC. Serum pepsinogen I (PGI), pepsinogen II (PGII), pepsinogen ratio (PGR), and anti‐Helicobacter pylori immunoglobulin G (Hp‐IgG) levels were measured. Group differences were assessed, and receiver operating characteristic (ROC) curve analysis was used to assess the diagnostic performance of PG alone and in combination with Hp‐IgG, age, and sex for GC and EGC. Significant differences…
Genes, proteins, chemicals, diseases, species, mutations and cell lines named across the full text — each resolved to its canonical identifier and authoritative record.
Click any figure to enlarge with its caption.
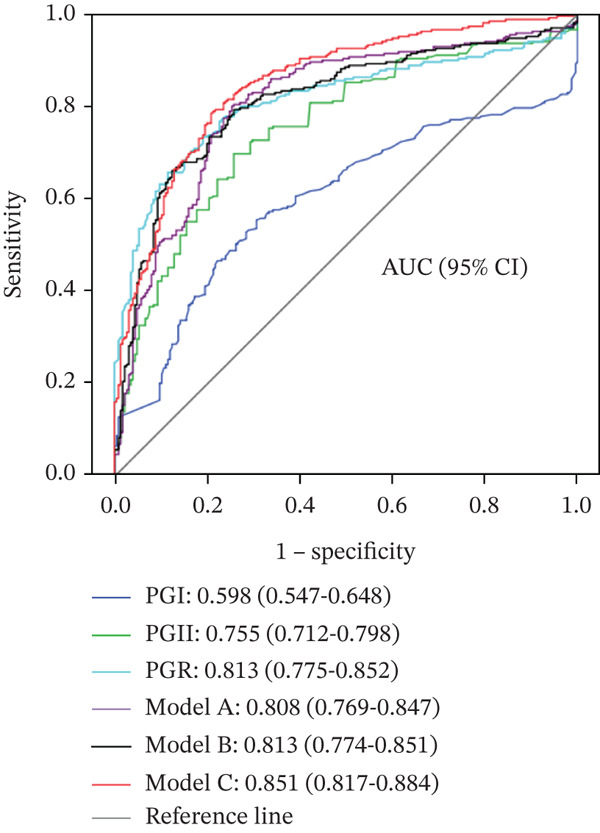 Figure 1
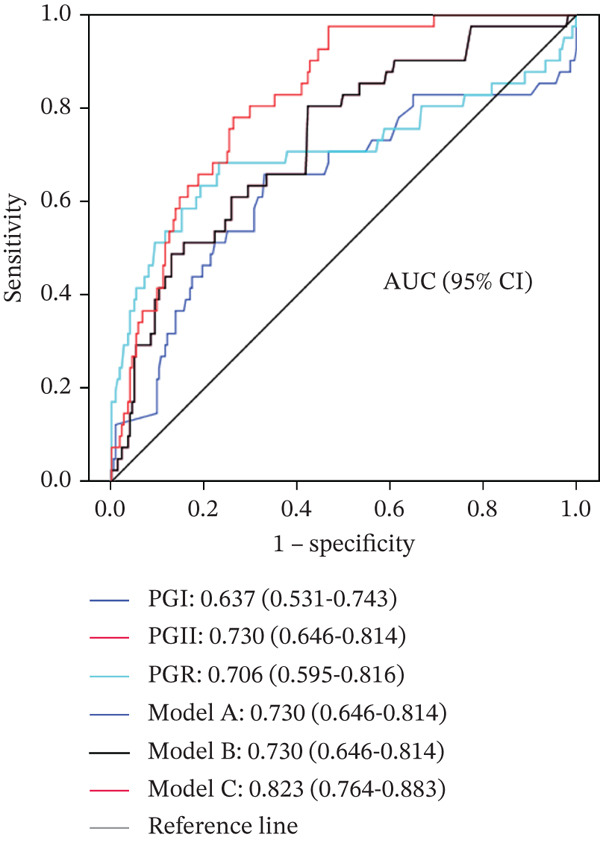 Figure 2
| Group [ |
| |||||
|---|---|---|---|---|---|---|
| CNAG ( | CAG ( | PU ( | GC ( |
| ||
| Sex | 22.111a | < 0.001 | ||||
| Male | 79 (53.4) | 15 (41.7) | 29 (70.7)& | 194 (71.3) ∗∗ && | ||
| Female | 69 (46.6) | 21 (58.3) | 12 (29.3)& | 78 (28.7) ∗∗ && | ||
| Age (year) | 55.5 ± 11.6 | 63.1 ± 12.4∗∗ | 61.7 ± 13.5∗ | 69.4 ± 11.2∗∗&&## | 46.544b | < 0.001 |
| Hp | 17.172a | 0.001 | ||||
| Positive | 83 (56.1) | 21 (58.3) | 36 (87.8) ∗∗ & | 146 (53.7)## | ||
| Negative | 65 (43.9) | 15 (41.7) | 5 (12.2) ∗∗ & | 126 (46.3)## | ||
| PGI ( | 68.0 (49.0–106.0) | 68.0 (49.5–103.2) | 106.0 (80.0–177.5) ∗ | 117.0 (60.3–192.0) ∗∗ | 24.284c | < 0.001 |
| PGII ( | 9.2 (5.7–15.8) | 8.3 (6.5–16.6) | 15.0 (10.1–33.5) ∗∗ | 28.0 (14.0–53.5) ∗∗ && | 108.201c | < 0.001 |
| PGR | 7.8 (6.2–9.3) | 7.0 (5.6–9.2) | 5.9 (4.8–8.9) | 3.4 (2.3–5.5) ∗∗ ##&& | 149.532c | < 0.001 |
|
| Serum PG level (median M(Q1–Q3)) | |||
|---|---|---|---|---|
| PGI ( | PGII ( | PGR | ||
| Degree of inflammation | ||||
| Mild | 75 | 69.0 (49.0–107.0) | 8.7 (5.7–15.4) | 7.8 (6.1–9.5) |
| Moderate | 26 | 94.5 (62.7–211.7) | 14.9 (9.7–25.4) | 6.4 (5.5–8.6) |
| Severe | 6 | 153.0 (72.0–226.0) | 17.6 (8.6–43.2) | 6.8 (4.3–11.7) |
|
| 7.664 | 8.143 | 2.377 | |
|
| 0.022 | 0.017 | 0.305 | |
| Activity of inflammation | ||||
| Inactive | 176 | 69.5 (49.0–111.0) | 8.9 (5.7–15.8) | 7.7 (4.2–9.3) |
| Active | 45 | 95.0 (58.5–154.0) | 14.7 (10.2–23.5) | 6.1 (4.5–9.1) |
|
| −2.578 | −3.659 | −2.498 | |
|
| 0.010 | < 0.001 | 0.013 | |
| Atrophy | ||||
| Nonatrophic | 183 | 76.0 (51.0–124.0) | 10.0 (6.0–19.3) | 7.7 (5.7–9.3) |
| Atrophic | 38 | 68.0 (50.5–106.2) | 8.3 (6.5–16.4) | 7.0 (5.5–9.1) |
|
| −0.862 | −0.258 | −0.891 | |
|
| 0.389 | 0.796 | 0.373 | |
| Degree of intestinal metaplasia | ||||
| None | 142 | 70.0 (49.0–119.0) | 9.5 (5.4–17.4) | 7.9 (5.9–9.5) |
| Mild | 69 | 77.0 (54.5–120.5) | 10.2 (6.7–17.7) | 7.1 (6.0–8.5) |
| Moderate–severe | 10 | 92.5 (60.2–154.7) | 15.8 (6.4–34.2) | 6.2 (4.2–8.0) |
|
| 1.686 | 3.065 | 4.338 | |
|
| 0.430 | 0.216 | 0.114 | |
|
| Serum PG level (median M(Q1–Q3)) | |||
|---|---|---|---|---|
| PGI ( | PGII ( | PGR | ||
| Tumor site | ||||
| Gastric fundus and cardia | 16 | 132.5 (88.8–250.0) | 27.0 (16.1–77.5) | 4.2 (2.3–6.8) |
| Gastric body | 28 | 142.6 (74.3–224.8) | 40.9 (17.5–71.5) | 3.9 (2.7–5.9) |
| Gastric angle | 21 | 117.0 (80.5–175.5) | 32.0 (20.0–49.5) | 2.8 (2.4–4.9) |
| Gastric antrum | 55 | 120.0 (43.0–209.0) | 24.0 (12.0–62.0) | 3.4 (2.0–5.5) |
|
| 2.726 | 3.127 | 1.183 | |
|
| 0.436 | 0.372 | 0.612 | |
| Tumor size (cm) | ||||
| < 3 | 55 | 117.0 (65.5–190.3) | 26.0 (12.0–46.0) | 3.8 (2.8–6.5) |
| 3~5 | 32 | 133.0 (67.5–250.0) | 37.0 (24.0–89.0) | 3.2 (1.7–5.3) |
| > 5 | 31 | 131.0 (65.6–209.0) | 30.0 (16.0–72.0) | 3.2 (2.0–5.4) |
|
| 1.186 | 7.602 | 4.617 | |
|
| 0.553 | 0.022 | 0.099 | |
| Histologic type | ||||
| Adenocarcinoma | 88 | 126.5 (62.2–220.5) | 28.0 (14.0–52.0) | 3.7 (2.5–5.6) |
| Signet‐ring cell carcinoma | 32 | 131.0 (76.6–186.3) | 40.4 (18.0–73.7) | 3.0 (1.9–5.6) |
|
| −0.315 | −1.600 | −1.095 | |
|
| 0.753 | 0.110 | 0.274 | |
| Lauren classification | ||||
| Intestinal type | 65 | 122.0 (56.1–202.5) | 24.0 (12.0–50.0) | 3.8 (2.2–5.8) |
| Diffuse type | 55 | 131.0 (78.2–226.0) | 38.0 (22.0–72.0) | 3.3 (2.2–5.2) |
|
| −1.441 | −2.629 | −0.798 | |
|
| 0.150 | 0.009 | 0.425 | |
| Differentiation degree | ||||
| Poorly differentiated | 58 | 129.0 (73.1–194.0) | 33.1 (17.3–57.0) | 3.3 (2.1–5.1) |
| Poorly to moderately differentiated | 30 | 133.5 (88.7–210.2) | 26.0 (15.5–70.5) | 3.6 (2.2–6.7) |
| Moderately differentiated | 20 | 115.0 (61.4–243.7) | 30.0 (16.5–53.0) | 3.9 (2.6–6.8) |
| Well differentiated | 12 | 65.5 (32.2–184.0) | 16.0 (12.0–38.9) | 3.3 (2.3–5.5) |
|
| 2.987 | 2.503 | 1.055 | |
|
| 0.394 | 0.475 | 0.788 | |
| cTNM stage | ||||
| I | 51 | 120.0 (62.0–200) | 22.0 (12.0–46.0) | 4.0 (2.6–8.0) |
| II | 7 | 77.0 (9.0–350.0) | 44.0 (22.0–110.0) | 1.7 (0.9–3.7) |
| III | 13 | 138.0 (87.5–209.0) | 38.0 (25.0–50.0) | 3.4 (3.1–4.4) |
| IV | 49 | 132.0 (69.3–244.0) | 30.0 (15.7–73.7) | 3.3 (2.0–5.5) |
|
| 2.133 | 6.007 | 6.350 | |
|
| 0.545 | 0.111 | 0.096 | |
| Pathological stage | ||||
| Early | 41 | 126.0 (63.0–202.5) | 26.0 (12.0–49.5) | 4.0 (2.8–8.3) |
| Advanced | 79 | 127.0 (69.0–214.0) | 30.0 (18.0–70.0) | 3.2 (2.0–5.2) |
|
| −0.163 | −1.943 | −2.299 | |
|
| 0.870 | 0.052 | 0.021 | |
| Variable |
| SE | Wald |
| OR (95% CI) |
|---|---|---|---|---|---|
| Model A | |||||
| PGII | 0.032 | 0.006 | 29.100 | < 0.001 | 1.032 (1.020–1.044) |
| PGR | −0.138 | 0.033 | 17.027 | < 0.001 | 0.871 (0.816–0.930) |
| Constant | 0.242 | 0.290 | 0.697 | 0.404 | 1.274 |
| Model B | |||||
| PGII | 0.035 | 0.006 | 31.346 | < 0.001 | 1.036 (1.023–1.048) |
| PGR | −0.139 | 0.034 | 16.854 | < 0.001 | 0.871 (0.815–0.930) |
| Hp | −0.677 | 0.212 | 10.227 | 0.001 | 0.508 (0.336–0.769) |
| Constant | 0.573 | 0.313 | 3.345 | 0.067 | 1.774 |
| Model C | |||||
| PGII | 0.034 | 0.006 | 29.950 | < 0.001 | 1.035 (1.022–1.047) |
| PGR | −0.087 | 0.032 | 7.570 | 0.006 | 0.917 (0.862–0.975) |
| Hp | −1.195 | 0.253 | 22.228 | < 0.001 | 0.303 (0.184–0.497) |
| Age | 0.079 | 0.010 | 58.453 | < 0.001 | 1.082 (1.061–1.105) |
| Sex | −0.741 | 0.242 | 9.379 | 0.002 | 0.477 (0.297–0.766) |
| Constant | −4.197 | 0.725 | 33.515 | < 0.001 | 0.015 |
| Sensitivity (%) | Specificity (%) | Accuracy (%) | Positive predictive value (%) | Negative predictive value (%) | Positive likelihood ratio | Negative likelihood ratio | |
|---|---|---|---|---|---|---|---|
| All GCs | |||||||
| Model A | 77.6 | 76.4 | 77.0 | 79.9 | 73.8 | 3.29 | 0.29 |
| Model B | 79.1 | 73.8 | 76.7 | 77.9 | 75.1 | 3.00 | 0.30 |
| Model C | 80.9 | 76.4 | 79.3 | 80.6 | 76.8 | 3.43 | 0.26 |
| EGC | |||||||
| Model A | 80.5 | 57.7 | 61.2 | 25.7 | 61.9 | 1.90 | 0.33 |
| Model B | 80.5 | 57.7 | 61.2 | 25.7 | 61.9 | 1.90 | 0.33 |
| Model C | 78.0 | 72.9 | 73.7 | 34.4 | 94.8 | 2.88 | 0.30 |
- —Hangzhou Science and Technology Plan Guidance Project
Peer Reviews
No public reviews on file for this paper yet. If you reviewed it on a platform where reviews are public (OpenReview, ICLR, NeurIPS, ICML), you can paste yours below so the community can read it here.
Videos
No videos yet. Explain this paper in a talk, walkthrough, or lecture? Add one.
Taxonomy
TopicsHelicobacter pylori-related gastroenterology studies · Esophageal Cancer Research and Treatment · Gastric Cancer Management and Outcomes
1. Introduction
Over the past four decades, gastric cancer (GC) has remained the fifth most prevalent malignant tumor and the third leading cause of cancer‐related mortality worldwide [1]. In China, approximately 679,000 new cases of GC are diagnosed annually, with about 498,000 GC‐related deaths, accounting for nearly half of the global total [2]. A substantial proportion of patients diagnosed with GC are identified at an advanced stage, which is associated with a poor prognosis and a 5‐year survival rate of only 20%–30%. In contrast, the 5‐year survival rate for early gastric cancer (EGC) can reach 90% [3]. EGC can be managed through endoscopic mucosal resection or endoscopic submucosal dissection (ESD), which are minimally invasive techniques providing therapeutic outcomes comparable to surgical intervention [4]. These procedures preserve the gastric structure, thereby supporting better postoperative quality of life. Consequently, early detection and intervention for GC are of considerable clinical importance.
GC, particularly EGC, often presents without specific symptoms [5]. Although endoscopy combined with biopsy remains the gold standard for GC diagnosis, its application in large‐scale screening is limited by invasiveness, patient discomfort, lack of cost‐effectiveness, and other practical constraints [6]. Pepsinogen (PG), a precursor of pepsin, is classified into pepsinogen I (PGI) and pepsinogen II (PGII) based on biochemical properties and immunogenicity, with each type produced by different gastric mucosal cells [7]. PG levels reflect the functional status of the gastric mucosa, and approximately 1% of PG enters the bloodstream. Measurement of serum PG levels has been proposed as a noninvasive method for identifying populations at a high risk of GC, including EGC [8–14].
The serum PG level is influenced by multiple factors, including geographic region, ethnicity, age, sex, and the degree of differentiation and progression of GC, which contributes to variability in its diagnostic performance for GC [7, 15, 16]. The aim of this study was to assess serum PG expression levels and Helicobacter pylori (Hp) immunoglobulin G (Hp‐IgG) antibodies in patients with gastric diseases in western Zhejiang and to assess the diagnostic value of PG alone and in combination with other variables for GC, particularly EGC. The findings are intended to support the development of a simple and effective noninvasive screening approach for the early detection of GC in this region.
2. Data and Methods
2.1. Participants
Patients who underwent gastroscopy and biopsy, excluding those with duodenal ulcer, at the First People′s Hospital of Jiande between July 2020 and July 2023 were enrolled. Exclusion criteria were applied after medical histories were reviewed and included (1) a history of gastric surgery, (2) use of proton pump inhibitors or other gastric medications within the preceding month, (3) a history of other malignant tumors, and (4) a prior diagnosis of GC with receipt of antitumor treatment. Patients meeting the inclusion criteria provided written informed consent, and 5 mL of peripheral blood was collected for the detection of PG and anti‐Hp‐IgG.
A total of 497 patients were included in the study, with a mean age of 64.1 ± 13.1 years. The cohort comprised 317 males (63.8%) and 180 females (36.2%), and 286 patients (57.5%) tested positive for Hp. From the gastroscopy and biopsy findings, patients were categorized into the chronic nonatrophic gastritis (CNAG) group (n = 148, 29.8%), the chronic atrophic gastritis (CAG) group (n = 36, 7.2%), the peptic ulcer (PU) group (n = 41, 8.2%), and the GC group (n = 272, 54.7%). Among the GC group, 120 patients underwent surgical resection or ESD and had complete pathological data. Of these, 41 patients (34.2%) had EGC and 79 patients (65.8%) had advanced gastric cancer (AGC). According to the Lauren classification, 65 patients (54.1%) had intestinal‐type GC and 55 patients (45.9%) had diffuse‐type GC.
The protocol was reviewed and approved by the Ethics Committee of the First People′s Hospital of Jiande, and all procedures and examinations were conducted with a written informed consent of the patients.
2.2. Serum PG and Hp Antibody Detection
Serum was separated from peripheral venous blood samples and stored at −80°C until testing. Serum concentrations of Hp‐IgG, PGI, and PGII were measured using the enzyme‐linked immunosorbent assay (ELISA), and the pepsinogen ratio (PGR) was subsequently calculated. ELISA kits for both assays were obtained from Biohit (Finland), and all experimental procedures were performed in strict accordance with the instructions provided by the manufacturer.
2.3. Statistical Processing
The distribution characteristics of measurement indexes were assessed using the Kolmogorov–Smirnov test. Normally distributed measurement indexes were expressed as mean ± standard deviation (x¯±S) and compared using the t‐test or one‐way ANOVA. Nonnormally distributed measurement indexes were expressed as quartiles (M(Q1–Q3)) and compared using the Mann–Whitney U test or the Kruskal–Wallis test. Categorical variables were expressed as frequency and percentage, with comparisons performed using the chi‐squared test or Fisher′s exact probability test. A p value < 0.05 was considered indicative of statistical significance. Receiver operating characteristic (ROC) curves and the area under the curve (AUC) were used to assess the diagnostic value of individual indexes and diagnostic models. Diagnostic models were established using multivariate binary logistic stepwise regression analysis. All statistical analyses were performed using SPSS 22.0 software (IBM Corp., Armonk, New York, United States).
3. Results
3.1. Serum PG Levels and Hp‐IgG Positivity Rates Across Groups
Sex, age, Hp‐IgG, PGI, PGII, and PGR levels were statistically analyzed for patients across the four groups. Significant differences were observed in all indices among the groups. The GC group demonstrated the highest mean age, the greatest proportion of males, the highest median PGI and PGII levels, and the lowest PGR. The PU group exhibited the highest Hp‐IgG positivity rate. No significant differences were identified between the CNAG and CAG groups for any indices except age (Table 1). Notably, while the median PGR showed a decreasing trend from the CNAG group (7.8) to the CAG group (7.0), this difference did not reach statistical significance (p > 0.05, Table 1). The lack of significance may be attributed to the relatively small sample size of the CAG group (n = 36) compared to the CNAG group (n = 148), and the potential influence of confounding variables such as age, sex, and Hp infection status on PGR levels.
3.2. Comparison of Serum PG Levels According to Pathological Feature Subgroups of Gastric Mucosal Biopsies in Benign Gastric Diseases
Serum PG expression levels were analyzed according to pathological feature subgroups of gastric mucosal biopsies in patients with benign gastric diseases (Table 2). PGI and PGII levels were found to increase with a greater degree and activity of gastric mucosal inflammation, with the differences reaching statistical significance (p < 0.05). Levels decreased with worsening gastric mucosal atrophy and increased with more severe gastric mucosal intestinal metaplasia; however, these differences were not statistically significant.
3.3. Comparison of Serum PG Levels Among GC Subgroups
Among the 120 patients with GC who underwent endoscopic or surgical treatment, PGI, PGII, and PGR levels were analyzed according to complete postoperative pathological feature subgroups (Table 3). PGII expression levels were associated with tumor size and Lauren classification, and PGR values were higher in EGC than in AGC (p = 0.021). No significant differences in PGI, PGII, or PGR levels were observed among subgroups defined by tumor site, tissue type, degree of cellular differentiation, or clinical TNM stage.
3.4. Diagnostic Value of Serum PG as a Single Index and in Combination With Multiple Indexes for GC and EGC
The ROC curve was applied to assess the diagnostic value of PGI, PGII, and PGR individually and in combination with multiple indices for differentiating GC and EGC from benign gastric diseases (Figure 1). For the combined analysis, GC was designated as the case group and benign gastric diseases (CNAG + CAG + PU) as the control group. Three diagnostic models were developed using binary logistic stepwise regression analysis: (1) a model based on the combination of PGI, PGII, and PGR; (2) a model combining PG (PGI, PGII, and PGR) with Hp; and (3) a model combining PG (PGI, PGII, and PGR) with Hp, age, and sex:
Figure 1(a, b) ROC curves of serum PG as a single index and in combination with other indices for differentiating GC from benign gastric diseases.(a)(b)
Model A (Model A): logit (p) = 0.032PGII − 0.138PGR + 0.242,
Model B (Model B): logit (p) = 0.035PGII − 0.139PGR − 0.667Hp + 0.573, and
Model C (Model C) = 0.034PGII − 0.087PGR − 1.195Hp + 0.079Age − 0.741Sex − 4.197,
where the Hp‐negative value is 0, the Hp‐positive value is 1; the value of sex = male is 0, and the value of sex = female is 1.
The variables of each model and their data are presented in Table 4.
A: PG as a single index and diagnostic models combining PG with multiple indices for differentiating GC from benign gastric diseases; B: PG as a single index and diagnostic models combining PG with multiple indexes for differentiating EGC from benign gastric diseases. PGI: PGI; PGII: PGII; PGR: PG ratio; Hp: H. pylori. Model A : logit (p) = 0.032PGII − 0.138PGR + 0.242; Model B : logit (p) = 0.035PGII − 0.139PGR − 0.667H p + 0.573; Model C : logit (p) = 0.034PGII − 0.087PGR − 1.195H p + 0.079Age − 0.741Sex − 4.197.
The diagnostic performance indices of the three PG‐based models for distinguishing GC/EGC from benign gastric diseases were calculated (Table 5). Model C demonstrated the highest diagnostic efficacy for both GC and EGC, with accuracies of 79.3% and 73.7%, respectively.
4. Discussion
In this study, serum PG expression levels and Hp‐IgG positivity rates were assessed in patients with GC and benign gastric diseases in western Zhejiang. Patients with GC exhibited higher serum PGI and PGII levels and lower PGR values compared to those with benign gastric diseases. No significant difference in Hp‐IgG positivity was observed between patients with GC and those with gastritis; however, the positivity rate was lower than that observed in patients with PU. Further analysis indicated that serum PG levels were positively correlated with the degree and activity of chronic gastritis, while no significant associations were identified with pathological features or tumor stage of GC. PGI, PGII, and PGR individually demonstrated the diagnostic value for GC, including EGC, with PGII performing better than PGI and PGR showing the highest diagnostic value. The combination of the three PG indexes enhanced diagnostic performance for GC. No substantial improvement was observed when Hp was added to the three PG indices. However, combining PGI, PGII, and PGR with age and sex further improved the diagnostic value, yielding AUCs above 0.8 and accuracy rates of 79.3% and 73.7% for GC and EGC, respectively.
The three PG indices, whether individually or in combination, demonstrated a moderate diagnostic value for GC. Diagnostic performance was notably improved when combined with Hp‐IgG, age, and sex (Model C). Model C achieved a sensitivity of approximately 80% and a specificity exceeding 70% for all GC cases; specificity remained at 60% when sensitivity was adjusted to 90%, while sensitivity remained at 57% when specificity was adjusted to 90% (data not presented in the results). These findings indicate that Model C holds a considerable clinical value in GC screening. Owing to its simplicity and feasibility in clinical practice, Model C may serve as an effective screening tool for patients unable to undergo gastroscopy and may also be valuable for identifying high‐risk patients prior to gastroscopy.
The close association between Hp infection and the development of GC is well established. Some studies have reported that GC occurred exclusively in Hp‐positive patients, with no cases observed in Hp‐negative patients during follow‐up [17]. In this study, the overall Hp infection rate among patients with gastric diseases in western Zhejiang was 57.5%, which was generally consistent with the national average in China [18]. Compared with Model A, which incorporated the three PG indices, Model B, which combined the three PG indices with Hp, did not indicate a significant improvement in detection efficacy for GC or EGC. This finding indicates that the Hp status alone may have a limited screening value for GC in regions with high Hp infection prevalence, which is consistent with several previous reports [19–21].
The results of this study indicated that PGI and PGII levels increased, while PGR decreased, with increasing activity of gastric mucosal inflammation in patients with benign gastric diseases, and these differences were statistically significant. PGI and PGII levels demonstrated a positive correlation with the degree of gastric mucosal inflammation and a negative correlation with PGR, aligning with the findings of Kang et al. [22] These observations indicate that inflammation can promote PG secretion, particularly following Hp infection. In patients with atrophic gastric mucosa, PGI, PGII, and PGR levels were lower than those in patients with nonatrophic gastric mucosa; however, these differences were not statistically significant, which may be attributed to the small sample size and mild atrophy observed in the CAG group in this study. Notably, our subanalysis of CAG and CNAG groups revealed no statistical difference in PGR, despite a trend of lower PGR in the CAG group (7.0 vs. 7.8 in CNAG), which is consistent with the biological expectation that gastric mucosal atrophy reduces PGR by impairing PGI secretion (from gastric chief cells) while preserving PGII secretion (from mucous neck and pyloric glands). The lack of statistical significance may be further explained by two key factors: first, the substantial imbalance in sample sizes between the two groups (CNAG: n = 148 vs. CAG: n = 36), which may have limited statistical power to detect subtle differences; second, confounding variables including age, Hp infection status, and inflammatory activity, which are known to modulate serum PG levels and may have masked the association between atrophy and PGR. Future studies with larger cohorts of CAG patients and stratified analysis by atrophy severity, Hp infection status, and inflammatory activity are warranted to clarify this relationship in the western Zhejiang population. Due to the distinct distributions of cells responsible for PGI and PGII secretion, nonatrophic or mildly atrophic gastric mucosa can exhibit increased PG secretion (predominantly PGI) in response to inflammatory stimulation. With progression to severe atrophy, gastric chief cells and mucous neck cells are replaced by pyloric glands, resulting in decreased PGI secretion, while PGII levels remain largely unchanged. Consequently, the PGR declines significantly. Additionally, patients with diffuse‐type GC exhibited higher PGII levels compared to those with intestinal‐type GC, which is consistent with the findings of Ito et al., and may be related to the differing pathogenic mechanisms underlying these two GC subtypes [23].
This study has certain limitations. First, the study population comprised patients with gastric diseases in western Zhejiang; therefore, further research is required to determine whether the conclusions are applicable to patients with gastric diseases in other regions of China. Second, the small sample size of the CAG group may have affected the reliability of the results. Third, the uneven distribution of pathological specimens (primarily antral mucosa with few gastric body samples) and the substantially smaller CAG group size (n = 36 vs. CNAG n = 148) may have limited our ability to detect expected differences in PGR between atrophic and nonatrophic gastritis, as reported in the literature. Additionally, this study did not explore the relationship between PGR and OLGA/OLGIM staging, as this association is well‐documented in the literature and our focus was on developing a simplified screening model for resource‐limited settings. Future studies addressing these limitations are warranted.
5. Conclusion
GC develops based on gastric mucosal inflammation. To reduce the potential influence of race, dietary habits, and lifestyle, this study examined a noninvasive and straightforward screening method for GC, particularly EGC, in the population of western Zhejiang. Hp has been classified by international authorities as a class I carcinogen for GC, with its carcinogenic mechanism linked to the induction and progression of gastric mucosal inflammation. Given the differing distributions of PGI and PGII in gastric mucosal cells, notable differences in PG expression levels may occur under the influence of gastric mucosal inflammation. In this study, anti‐Hp‐IgG and serum PGI and PGII levels were measured using ELISA, and PGR was calculated. From the gastroscopy and biopsy pathology, patients were categorized into the CNAG, CAG, PU, and GC groups. Postoperative pathological classification of GC cases was further divided into EGC and AGC. Comparisons of serum PGI, PGII, and PGR levels, and Hp infection rates among the four groups were performed to further analyze the association between PG levels and gastric mucosal pathological features. The AUC of the ROC curve was applied to assess the diagnostic value of PG, both individually and in combination with multiple indices, in differentiating GC and EGC from benign gastric diseases.
From this study, a noninvasive and simple screening approach for GC in the local population was identified. However, further refinement is required due to study limitations. Incorporation of additional gastric function markers, such as gastrin levels, may further enhance screening efficacy for GC, particularly EGC.
NomenclaturePGpepsinogen Hp
H. pylori GCgastric cancerEGCearly gastric cancerAGCadvanced gastric cancerELISAenzyme‐linked immunosorbent assayHp‐IgGanti‐Helicobacter pylori immunoglobulin GPGIpepsinogen IPGIIpepsinogen IIPGRpepsinogen ratioAUCarea under the curveROCreceiver operating characteristic curveEMRendoscopic mucosal resectionESDendoscopic submucosal dissection
Author Contributions
Conception and design of the research, statistical analysis, obtaining financing, writing of the manuscript, and critical revision of the manuscript for intellectual content: Dong‐Hai Yan. Acquisition of data: Yu‐Fang Li. Analysis and interpretation of the data: Dong‐Hai Yan and Yu‐Fang Li.
Funding
This work was supported by the Hangzhou Science and Technology Plan Guidance Project (Agriculture and Social Development), 2016351Y162.
Disclosure
All authors read and approved the final draft.
Ethics Statement
This study was conducted with approval from the Ethics Committee of The First People′s Hospital of Jiande. This study was conducted in accordance with the Declaration of Helsinki. Written informed consent was obtained from all participants.
Consent
The authors have nothing to report.
Conflicts of Interest
The authors declare no conflicts of interest.
The reference list from the paper itself. Each links out to its DOI / PubMed record.
- 1Bray F. , Ferlay J. , Soerjomataram I. , Siegel R. L. , Torre L. A. , and Jemal A. , Global Cancer Statistics 2018: GLOBOCAN Estimates of Incidence and Mortality Worldwide for 36 Cancers in 185 Countries, Ca: A Cancer Journal for Clinicians. (2018) 68, no. 6, 394–424, 10.3322/caac.21492, 2-s 2.0-85053395052.30207593 · doi ↗ · pubmed ↗
- 2Chen W. , Zheng R. , Baade P. D. , Zhang S. , Zeng H. , Bray F. , Jemal A. , Yu X. Q. , and He J. , Cancer Statistics in China, 2015, CA: A Cancer Journal for Clinicians. (2016) 66, no. 2, 115–132, 10.3322/caac.21338, 2-s 2.0-84960796740, 26808342.26808342 · doi ↗ · pubmed ↗
- 3Lu J. , Huang C. M. , Zheng C. H. , Li P. , Xie J. W. , Wang J. B. , and Lin J. X. , Consideration of Tumor Size Improves the Accuracy of TNM Predictions in Patients With Gastric Cancer After Curative Gastrectomy, Surgical Oncology. (2013) 22, no. 3, 167–171, 10.1016/j.suronc.2013.05.002, 2-s 2.0-84883787621, 23787074.23787074 · doi ↗ · pubmed ↗
- 4Gotoda T. , Endoscopic Resection of Early Gastric Cancer, Gastric Cancer. (2007) 10, no. 1, 1–11, 17334711, 10.1007/s 10120-006-0408-1, 2-s 2.0-33847669835.17334711 · doi ↗ · pubmed ↗
- 5Tsukuma H. , Oshima A. , Narahara H. , and Morii T. , Natural History of Early Gastric Cancer: A Non-concurrent, Long Term, Follow Up Study, Gut. (2000) 47, no. 5, 618–621, 10.1136/gut.47.5.618, 2-s 2.0-0033756371, 11034575.11034575 PMC 1728114 · doi ↗ · pubmed ↗
- 6Zou W. B. , Yang F. , and Li Z. S. , How to Improve the Diagnosis Rate of Early Gastric Cancer in China, Journal of Zhejiang University. Medical Sciences. (2015) 44, no. 1, 9–14.25851969 10.3785/j.issn.1008-9292.2015.01.002PMC 10396879 · doi ↗ · pubmed ↗
- 7Lee S. Y. , Endoscopic Gastritis, Serum Pepsinogen Assay, and Helicobacter pylori Infection, Korean Journal of Internal Medicine. (2016) 31, no. 5, 835–844, 10.3904/kjim.2016.166, 2-s 2.0-84986903255, 27604795.27604795 PMC 5016293 · doi ↗ · pubmed ↗
- 8Miki K. , Ichinose M. , Ishikawa K. B. , Yahagi N. , Matsushima M. , Kakei N. , Tsukada S. , Kido M. , Ishihama S. , Shimizu Y. , Suzuki T. , and Kurokawa K. , Clinical Application of Serum Pepsinogen I and II Levels for Mass Screening to Detect Gastric Cancer, Japanese Journal of Cancer Research. (1993) 84, no. 10, 1086–1090, 10.1111/j.1349-7006.1993.tb 02805.x, 2-s 2.0-0027371774, 8226283.8226283 PMC 5919064 · doi ↗ · pubmed ↗