Individualized Atrophy‐Based Prediction of Dementia Progression in Familial Frontotemporal Lobar Degeneration With Bayesian Linear Mixed‐Effects Modeling
Shubir Dutt, Dana Leichter, Yann Cobigo, Amy Wolf, John Kornak, Annie Clark, Lucy L. Russell, Arabella Bouzigues, David M. Cash, Martina Bocchetta, Molly Olzinski, Brian Appleby, Ece Bayram, Barbara Borroni, Andrea Bozoki, Chris R. Butler, David Clark, Rhian S. Convery

TL;DR
This study uses brain imaging and a Bayesian model to predict dementia progression in people with a genetic risk for frontotemporal lobar degeneration.
Contribution
A Bayesian linear mixed-effects model is introduced to predict dementia conversion using individualized brain atrophy patterns.
Findings
BLME cluster volume predicted dementia conversion in f-FTLD mutation carriers overall and in specific gene groups.
BLME outperformed other methods in predicting dementia within 24 months with higher AUCs.
Accelerated gray matter loss identified by BLME was a strong predictor of dementia progression.
Abstract
Age of symptom onset is highly variable in familial frontotemporal lobar degeneration (f‐FTLD). Accurate prediction of onset would inform clinical management and trial enrollment. Prior studies indicate that individualized maps of brain atrophy can predict conversion to dementia in f‐FTLD. We used a Bayesian linear mixed‐effect (BLME) prediction method for identifying accelerated brain volume loss to predict conversion to dementia. Participants included 234 asymptomatic or prodromal carriers of C9orf72, GRN, or MAPT mutations (including 21 dementia converters) with ≥3 longitudinal magnetic resonance imaging (MRI) T1‐weighted scans. The BLME models established individual voxel‐wise gray matter trajectories using the first 2 scans. Person‐specific clusters of accelerated volume loss were estimated in subsequent scans and tested as predictors of dementia conversion compared with other…
Genes, proteins, chemicals, diseases, species, mutations and cell lines named across the full text — each resolved to its canonical identifier and authoritative record.
Click any figure to enlarge with its caption.
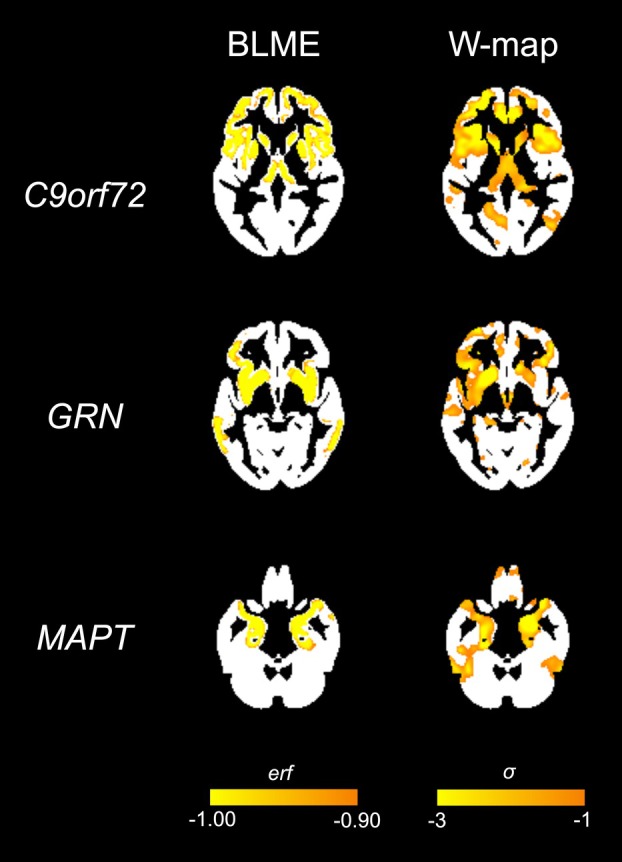 Figure 1
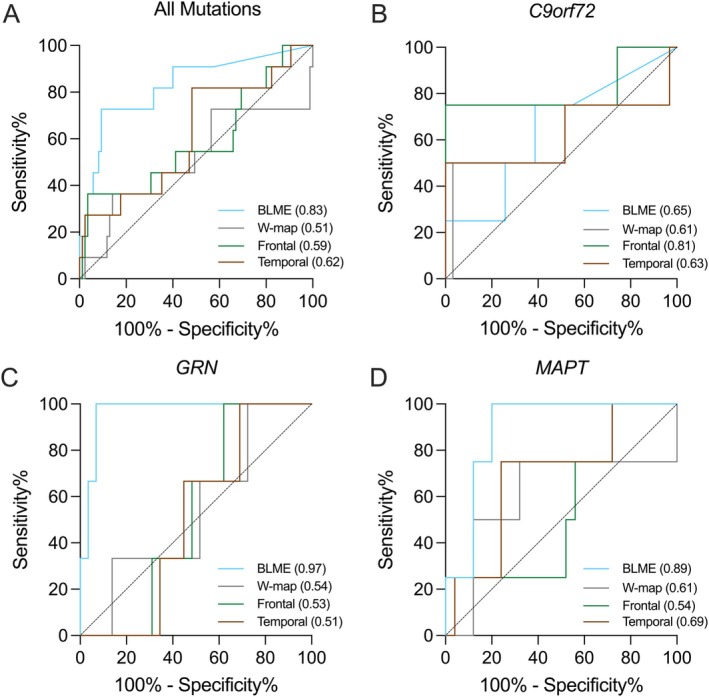 Figure 2
Peer Reviews
No public reviews on file for this paper yet. If you reviewed it on a platform where reviews are public (OpenReview, ICLR, NeurIPS, ICML), you can paste yours below so the community can read it here.
Videos
No videos yet. Explain this paper in a talk, walkthrough, or lecture? Add one.
Taxonomy
TopicsDementia and Cognitive Impairment Research · Amyotrophic Lateral Sclerosis Research · Alzheimer's disease research and treatments
Introduction
Although treatments are available to slow disease progression in some people with typical late-onset Alzheimer’s disease (AD), there are no disease-modifying treatments for other neurodegenerative pathologies, such as frontotemporal lobar degeneration (FTLD)^1–3^. Familial forms of FTLD (f-FTLD), most often caused by autosomal dominant mutations in the C9orf72, GRN, or MAPT genes, offer unique opportunities for treatment since each mutation involves a single gene and an increasingly well-delineated pathophysiological cascade^4,5^. In recent years, several targeted treatments have entered clinical trials for these genetic forms^2,6,7^. However, age of onset in f-FTLD varies substantially even among people with the same mutation or within the same family^8^. This unpredictability may impede selection of appropriate candidates for prevention trials and complicate decisions about when to initiate preventive treatments. For some neurodegenerative disorders, monitoring the status of typically affected brain regions (e.g., the hippocampus in Alzheimer’s disease) has been suggested as a strategy to estimate time to symptom onset^9^. However, in FTLD, spatial topography of pathology varies even within a genetic group, and monitoring changes in standard regions of interest may miss early signs of emerging neurodegeneration.
Our group previously demonstrated that individualized brain atrophy maps improve prediction of time to onset of dementia in FTLD mutation carriers beyond age alone^10^. We recently developed a framework designed to improve upon cross-sectional methodology by applying a Bayesian linear mixed-effects model (BLME)^11^ to longitudinal MRI scans to track subtle indications of neurodegeneration^12^. Based on hypothetical^13^ and data-driven^14^ models of f-FTLD disease progression showing that acceleration of brain volume loss precedes clinical symptom onset, our method proposes that detection of this acceleration might permit more accurate predictions than established methods. We initially studied amyloid-positive participants from the Alzheimer’s Disease Neuroimaging Initiative (ADNI) cohort who were unimpaired at enrollment and underwent at least three longitudinal scans^12^. Using the first two scans from a participant while cognitively intact (henceforth referred to as the “predictor scan pair”), we fit them to a control group’s trajectories to estimate individual voxel-wise rates of volume loss and identified clusters exhibiting accelerated atrophy relative to controls at subsequent timepoints. Both the size of these maps and the speed with which they grew predicted time to dementia conversion in AD more accurately than hippocampal volumes.
In the present study, we extend this framework to f-FTLD by applying the BLME model to a large cohort of C9orf72, GRN, or MAPT mutation carriers and family controls with longitudinal MRIs to test the accuracy of predicting conversion to dementia using survival analysis. We compare the performance of this method with other methods, including individualized atrophy maps from cross-sectional images and regional volumes measured uniformly across participants. To assess its anticipated utility in clinical trial design, we also evaluate its ability in ROC curve analyses to identify individuals who would convert to dementia (CDR ≥ 1) within a 24-month timeframe, a potential proximity marker with which to prioritize presymptomatic participants for clinical trials.
Methods
Participants
2.1
The present study included 234 carriers of mutations in the C9orf72, GRN, or MAPT genes. Study participants were included from 1) the ARTFL LEFFTDS Longitudinal Frontotemporal Lobar Degeneration (ALLFTD) Research Study^13,15^, 2) the Genetic Frontotemporal dementia Initiative (GENFI, data freeze 7)^16^, and 3) research studies at the UCSF Memory and Aging Center (MAC). ALLFTD and GENFI data have recently been harmonized through the FTD Prevention Initiative (FPI) (https://thefpi.org). ALLFTD enrolled participants from 28 sites across the USA and Canada (study enrollment 2015-present). GENFI enrolled participants from 25 sites across Canada and Europe and spanned two study phases: GENFI 1 (2012-2015) and GENFI 2 (2015-2023). Participants were included from both study phases. UCSF MAC participants were enrolled in longitudinal studies of FTLD who had similar brain imaging acquisitions and clinical/genetic data available as in the other two studies. All studies enrolled participants with a family history consistent with f-FTLD; for additional information regarding Inclusion/Exclusion criteria for each study’s recruitment, see Staffaroni et al., 2022^14^. Protocols at all sites received prior approval by appropriate Institutional Review Boards, and all subjects provided informed consent.
Clinical and Genetic Assessment
2.2
All participants in the ALLFTD, GENFI 2, and MAC studies underwent serial longitudinal examination including neurological history/examination, informant interview, and CDR^®^+NACC-FTLD. The CDR^®^+NACC-FTLD is a rating scale with eight domains assessed based on informant report; we used the global score to classify individuals as asymptomatic (0), questionably or mildly symptomatic (0.5), or symptomatic (≥1)^17,18^. Participants enrolled in the GENFI 1 study underwent neurological history/examination, informant interview, and assessment comparable to the CDR^®^+NACC-FTLD, which assessed whether participants were symptomatic or not in the domains of behavior, neuropsychiatric, language, cognition, and motor functioning. For the present study, individuals were included if they had ≥3 longitudinal MRI scans and were asymptomatic or minimally symptomatic at each of the first 2 scans. Sensitivity analyses were conducted in those who were asymptomatic at both initial timepoints (see 2.3 Neuroimaging below for additional details). A subset of individuals in the study “converted” to dementia over the course of their enrollment, defined as starting with a CDR^®^+NACC-FTLD of 0 or 0.5 and having a CDR^®^+NACC-FTLD ≥1 at a subsequent visit (see 2.5 Statistical Analyses for additional details).
ALLFTD and UCSF participants had genetic testing completed at the same laboratory at UCLA using previously published methods^19,20^. GENFI participants completed genotyping at individual sites^16^. All participants in this analysis had a pathogenic variation in the MAPT or GRN genes or a pathogenic expansion in the C9orf72 gene in themselves or in a family member. Non-carriers from mutation-carrying families were used to estimate normative rates of brain volume loss (see details below.)
Neuroimaging Acquisition
2.3
ALLFTD/MAC:
Participants underwent structural imaging using 3T scanners from one of three vendors: Siemens, Philips Medical System, or General Electric Medical Systems. A standard T1-weighted 3D magnetization prepared rapid gradient echo (MPRAGE) sequence was used with the following parameters: 240 x 256 x 256 matrix; about 170 slices; voxel size=1.05 x 1.05 x 1.25 mm^3^; flip angle, TE and TR varied by vendor. Additional details have been previously published ^21^.
GENFI:
Participants underwent structural imaging using 3T scanners from Siemens Trio and Skyra, Philips Achieva, and GE Discovery MR750 models. A standard T1-weighted MPRAGE sequence was used with the following parameters: 256 x 256 x 208 matrix; 208 slices; voxel size = 1.1-mm isotropic resolution volumetric; flip angle = 8°; TE and TR varied by vendor. Additional details have been previously published^16,22^.
Image Processing
2.4
Image pre-processing and processing:
Image processing was completed using previously described methods^12^. Briefly, all T1-weighted images were first visually inspected for quality control and images with excessive motion or imaging artifacts were excluded, bias field correction was applied with N3 algorithm, and images were segmented using SPM12 unified segmentation^23^. This was followed by intra-subject template creation, within-subject modulation, customized group template generation within the Large Deformation Diffeomorphic Metric Mapping framework, normalization, and smoothing (8 mm full width half maximum Gaussian kernel), with inspection at every step^24–27^. Modulated gray matter maps transformed into the single subject template and warped into the group template were ultimately used in the BLME models. Additionally, we used gray matter maps modulated in the group template to generate atrophy W-maps and quantify regional volumes (see specific sections below for additional information). Volumetric calculations were performed using FSL and ANTs^28,29^.
Bayesian Linear Mixed-Effects (BLME) modeling:
Our approach is based on the BLME model described in detail by Ziegler and colleagues^11^. Our extension of the method to create single-subject Bayesian predictions of regional gray matter volumes has been previously described in detail^11,12^. Briefly, we used Bayesian modeling to estimate the degree to which an individual participant’s atrophy deviates from their expected trajectory of change. All participants in the study were required to have at least three longitudinal MRI timepoints, with at least the first two (predictor scan pair) being acquired when they were asymptomatic or questionably/minimally symptomatic (CDR^®^+NACC-FTLD ≤ 0.5). Gray matter maps for the predictor scan pair were entered into a BLME model (including that individual and control scans) to quantify the rate of gray matter loss in that participant. This information was then used to predict the individual’s expected trajectory of neurodegeneration, assuming continued loss at that rate. Then, the observed volumes in the participant’s subsequent MRIs were compared with the predicted volumes in each voxel to identify regions where the observed volume was below the expected volume. Importantly, the predictor scan pair was only used to derive individualized trajectories of change, and all primary analyses across BLME, W-map, and volumetric methods used subsequent scans after the predictor scan pair.
In these subsequent scans, we used the error function (erf), which integrates the Bayesian predictive probability distribution for all possible volumes at each voxel for a given timepoint, to quantify the degree to which each observed value deviated from its expected value. The erf ranges from −1 to 1. Voxels with volumes close to the predicted volumes at that timepoint have small erf values (near 0), whereas large erfs indicate voxels with volumes far from expected values. Because our goal was identifying voxels with volume reductions compared with predictions, we only examined voxels with negative erf values. The number of voxels showing unexpectedly low volume was multiplied by voxel size to create a BLME atrophy cluster quantified in cubic millimeters (henceforth referred to as “BLME cluster volume”). The choice of erf threshold for creating these maps is arbitrary. Thus, similar to our previous work, we looked for potential effects of threshold by creating maps using erf thresholds ranging from −0.7 (which includes volumes closer to their expected value) to −0.999 (only including voxels with volumes very far from expected). All primary findings were seen at nearly all thresholds (see Results). All results are shown in the main manuscript at an erf threshold of −0.999, with analyses for additional thresholds displayed in Supplementary Materials.
Atrophy W-map creation:
As an alternative approach, we created W-maps of atrophy, representing gray matter atrophy in standard deviations from the reference group mean. W-scores were created for each subject at each voxel, adjusting for age, total intracranial volume (TIV), and MRI scanner as covariates. Biological sex was not included as a covariate in w-score calculation and was instead considered in post hoc sex-stratified analyses. For additional information, see Staffaroni et al., 2022^14^. All W-map results are shown at a whole brain σ threshold of −3.0 (corresponding to a probability of 0.0015 or less of observing this value under a normal distribution) to facilitate comparison with the erf threshold of −0.999 (representing voxels where the probability of seeing the observed value is 0.001 or less).
Region of interest (ROI) volume calculation:
As a third approach to estimating atrophy, regional volumes were estimated by calculating the mean of gray matter volume in ROIs from the Desikan-Killiany cortical atlas^30^, which was applied to each individual subject’s smoothed, modulated, gray matter image. For additional information, see Staffaroni et al., 2022^14^.
Statistical Analyses
2.5
Survival Analyses.
Metrics from each of the three image processing techniques (BLME, atrophy W-map, and ROI volume) were normalized via z-score and entered into separate Cox proportional hazard models with time-dependent predictors to perform survival analysis (using the Python lifelines package [https://zenodo.org/records/3969500]) with imaging metric as predictor, age (and TIV for ROI volume analyses) as covariates, and time to dementia conversion (i.e., CDR^®^+NACC-FTLD ≥ 1) as survival outcome. W-map and ROI volume values were taken from the same timepoints used for the BLME analysis (i.e., not including the two baseline scans used to model individual trajectories). Conversion to dementia was the event of interest, while non-converters were censored at their last observation in the study. Resulting hazard ratios (HR) are interpreted as increased risk of dementia conversion for each one standard deviation increase in the predictor. Due to previously established differences in disease vulnerability based on biological sex^31,32^, we performed sub-analyses for BLME and W-map models stratified by sex.
ROC Curve analyses.
A subset of participants was selected to conduct cross-sectional analyses assessing the utility of different imaging metrics in classifying individuals who converted versus did not convert to dementia within an approximately 24-month period to align with the length of a hypothetical clinical trial. To create our dementia converter subset (“24-month converters”), we first filtered out timepoints on or after the date of conversion (i.e., survival date), as well as any scans more than 27 months (24 months + 3 month buffer) prior to the date of conversion. This resulted in our 24-month converters subset of n=11, and for each of these participants, we only used the imaging timepoint closest to the specified test period (i.e., 27 months prior to the date of conversion). To create our non-converter subset (“24-month non-converters”), we used only non-converters from the main analysis who had an MRI scan at least 24 months prior to the date of last observation in the study. This approach was used to ensure that the non-converter group consisted of individuals who we were certain did not convert within at least a 24-month period. This resulted in our 24-month non-converters subset of n=85, and for each of these participants, we only used the imaging timepoint closest to the specified test period. Within this new subset of n=96 participants, we conducted separate cross-sectional receiver-operating characteristic curve (ROC) analyses with each imaging metric of interest (BLME cluster volume, atrophy W-map, ROI volume) to estimate the area under the curve (AUC) for differentiation of converters from non-converters. ROC curve analyses were performed separately for each imaging metric of interest in a combined sample of mutation carriers, as well as individually within each genetic mutation. We used Delong’s test to compare AUCs of different imaging metrics and assess whether they statistically differed in classifier performance.
Results
Demographics
3.1
Of the 234 f-FTLD mutation carriers included in the present study, 96 were C9orf72 carriers, 76 were GRN carriers, and 63 were MAPT carriers, with 1 participant having both a GRN and C9orf72 mutation. Of the 234 f-FTLD mutation carriers, 21 converted to dementia (i.e., CDR^®^+NACC-FTLD ≥ 1), which included 8 C9orf72 carriers, 4 GRN carriers, 8 MAPT carriers, and 1 carrier of both a GRN and a C9orf72 mutation. Participant demographics and characteristics for the full sample are presented in Table 1; demographics for the survival (n=234; 21 converters) and ROC (n=96; 11 converters) analysis subsets are shown in Supplementary Table 1.
Survival Analyses
3.2
Example single-subject images of BLME cluster volumes and W-map cluster volumes are shown for each mutation in Figure 1. At an erf threshold of 0.999, BLME cluster volume significantly predicted conversion to dementia in f-FTLD mutation carriers overall (n = 234; HR = 2.46, 95% CI [1.89, 3.20], p = 2.5 x 10^−11^) (Table 2). At a comparable threshold of σ = 3.0, overall W-map cluster volume also significantly predicted conversion to dementia across carrier groups (n=234; HR = 3.00, 95% CI [1.80, 3.65], p = 2.0 x 10^−6^). At the same 0.999 threshold, BLME cluster volume also significantly predicted conversion to dementia separately in each f-FTLD mutation, with the largest effect size observed in MAPT (n = 63; HR = 2.89, 95% CI [1.46, 5.72], p = 0.0022), followed by GRN (n = 76; HR = 2.67, 95% CI [1.55, 4.59], p = 0.0004) and C9orf72 (n = 96; HR = 1.77, 95% CI [1.37. 2.28], p = 0.00001) (Table 2). Comparable HRs were observed when examining W-map cluster volume or ROI volumes (frontal, temporal lobes) as predictors (Table 2). Using alternative BLME erf thresholds of 0.99, 0.9, 0.8, and 0.7, as well as alternative W-map σ thresholds of 2.5, 2.0, 1.5, and 1.0, both BLME cluster volume and W-map cluster volume still significantly predict conversion to dementia across all f-FTLD mutation carriers and within each individual mutation (Supplementary Materials). Sensitivity analyses limited to only those who were asymptomatic at baseline (i.e., CDR^®^+NACC FTLD = 0) showed significant prediction of conversion to dementia across all carriers for both BLME cluster volume (n = 165; HR = 3.23, 95% CI [1.79, 5.85], p = 0.00011) and W-map cluster volume (n = 165; HR = 9.51, 95% CI [2.68, 33.72], p = 0.00049). In sex-stratified models, BLME cluster volume significantly predicted conversion to dementia in a combined group of f-FTLD mutation carriers in females only (n = 133; HR = 2.36, 95% CI [1.76, 3.17], p = 1.1 x 10^−8^) and in males only (n = 101; HR = 2.69, 95% CI [1.05, 6.88], p = 0.0385). When examining W-map cluster volume as predictor, prediction of dementia conversion was significant in females (n = 133; HR = 3.34, 95% CI [2.11, 5.27], p = 2.3 x 10^−7^) but not in males (n = 101; HR = 1.93, 95% CI [0.60, 6.26], p = 0.27), although the effect was in the expected direction for males.
ROC Curve Analyses
3.3
BLME cluster volume demonstrated robust accuracy in differentiating converters from non-converters at an erf threshold of 0.999 (AUC = 0.83, 95% CI [0.68, 0.97], p = 0.0004), as well as at other erf thresholds (Table 3). BLME cluster volume performed better in discriminating between converters versus non-converters compared to W-map cluster volume at σ = 3.0 (n = 96; AUC = 0.51, 95% CI [0.30, 0.73], p = 0.89; Delong’s test Z = 2.68, p = 0.007), frontal lobe volume (n = 96; AUC = 0.59, 95% CI [0.39, 0.79], p = 0.34; Delong’s test Z = 1.59, p = 0.11), or temporal lobe volume (n = 96; AUC = 0.62, 95% CI [0.43, 0.80], p = 0.21; Delong’s test Z = 1.55, p = 0.12) (Table 3; Figure 2). The highest predictive accuracy for BLME cluster volume was observed in GRN (n = 32; AUC = 0.97, 95% CI [0.90, 1.00], p = 0.0088) followed by MAPT (n = 29; AUC = 0.89, 95% CI [0.77, 1.00], p=0.014), while the AUC for C9orf72 was not statistically significant (n = 35; AUC = 0.65, 95% CI [0.34, 0.95], p = 0.35) (Table 3; Figure 2). Supporting the robustness of this approach, similar results were observed across thresholds (Supplementary Materials).
Discussion
This study demonstrated the utility of Bayesian-modeled individualized atrophy scores in predicting progression to dementia among f-FTLD mutation carriers. We expand on prior work from our group that has 1) used cross-sectional atrophy-based scores to predict dementia in f-FTLD^10^, and 2) used a similar Bayesian-modeled atrophy score approach to predict conversion to AD dementia^10,12^. We extend those findings by using longitudinal neuroimaging to quantify the extent to which an individual’s atrophy diverges from their expected trajectory of volume loss and show that these estimates predict conversion to dementia in presymptomatic f-FTLD mutation carriers. ROC curve analyses suggest BLME cluster volume can identify participants at higher risk of developing dementia within a 24-month period, highlighting the potential to inform clinical trial design. In 24-month analyses, BLME cluster volumes that leveraged longitudinal data outperformed cross-sectional estimates (using both W-maps and standard ROI approaches) for distinguishing between converters and non-converters, supporting the hypothesis that estimates of atrophy that consider information from “run-in” scans may better capture symptom onset than traditional atrophy maps. Our BLME approach offers unique advantages over classic linear models for predicting future outcomes. Whereas frequentist methods provide point estimates and associated uncertainty for current observations, the Bayesian approach yields a prediction framework for all possible future observations, allowing probabilistic statements about them. In addition, the Bayesian framework includes prior distributions and naturally incorporates regularization to reduce overfitting. Together, our results position BLME cluster volume as a potentially useful biomarker for early-stage dementia detection in f-FTLD that may support personalized intervention strategies and improve clinical trial design.
Our findings contribute to the growing literature on the utility of structural MRI in predicting disease onset and symptom progression in f-FTLD and related neurodegenerative disorders^10,14,21,33–37^. Prior work from our group found that regional brain atrophy using standard W-map quantification, along with plasma NfL, emerged as the first observable abnormal biomarkers in f-FTLD^14^. Recent work has suggested initial hemispheric lateralization of brain atrophy is important in f-FTLD progression, which may be captured by using person-specific atrophy trajectories^38^. Our study builds on these prior findings by using a data-driven, probabilistic BLME framework to quantify individual deviations from expected trajectories of brain atrophy. Our subgroup analyses, though limited by smaller sample sizes, suggested the greatest utility of BLME cluster volume was for prediction in MAPT and GRN mutations rather than C9orf72. One possible explanation is the relatively more severe and rapid acceleration of neurodegeneration associated with these mutations^33,34^. In contrast, C9orf72 mutation carriers tend to be more heterogeneous in their presentations (e.g., bvFTD, ALS) and have more prolonged and relatively more linear trajectories of volume loss^14,35,39,40^. Linear trajectories may be particularly problematic for this methodology given the reliance on detecting deviations from one’s own trajectory, which would thus be insensitive to linear volume loss. This explanation remains speculative, and future efforts will systematically examine how linearity may affect the utility of BLME methods. Despite these mutation-specific differences, BLME-derived atrophy volumes consistently predicted conversion across all genetic variants, providing robust evidence for structural MRI as a prodromal biomarker that may transcend the clinical heterogeneity of f-FTLD. Prior work has highlighted potential differences in vulnerability to neurodegenerative diseases between women and men^31,32^, prompting our exploratory sex-stratified analyses. BLME cluster volume significantly predicted dementia conversion in both sexes, with similar effect sizes; p-values were smaller in women, potentially reflecting the larger sample size of females. In contrast, W-map cluster volume showed larger effect sizes in women and was significant only in females, potentially suggesting that the BLME approach is more robust to sex differences. Alternatively, TIV is a covariate in the w-score adjustments, and given the strong association of TIV with sex, this adjustment may remove important disease related effects and reduce predictive accuracy. Definitive conclusions about sex-specific effects cannot yet be drawn given the small sample sizes here, and future studies with adequately powered cohorts will be critical to determine whether sex differences exist across methodologies and mutation carrier groups.
The predictive utility of BLME-derived cluster volume has potential implications for clinical trial design, as identifying mutation carriers with a high probability of developing dementia within 24 months allows for more targeted participant selection and may in turn improve trial efficiency. This is crucial in f-FTLD trials, which are difficult to power due to rarity and clinical heterogeneity^14,41^. A future direction is to not only predict when someone will become clinically symptomatic, but the type of clinical symptoms they may first experience based on prodromal brain atrophy patterns. Inclusion of quantitative clinical and cognitive outcomes would complement structural imaging and may provide greater sensitivity to detect subtle clinical changes in the asymptomatic to minimally symptomatic transition stage. Combining multimodal data (e.g., cognitive and imaging) may be particularly helpful in C9orf72 carriers given the clinical heterogeneity and relatively prolonged trajectories often observed in this group. Future studies may also include additional genetic modifiers known to influence disease progression, such as TMEM106B, to refine risk stratification and increase the applicability of our method to broader populations. Future studies that incorporate cortical thickness metrics, in both combined models and sex-stratified models, may provide complementary insights into neurodegenerative patterns in f-FTLD, as cortical thickness measures can capture subtle changes in the cerebral cortex that may not be fully reflected in volumetric measures.
BLME cluster volume may be a promising marker for predicting disease onset, but there are several remaining challenges. Although AUCs for BLME cluster volumes were more robust than other metrics, HRs from longitudinal survival analyses were largely comparable across BLME cluster volume, atrophy W-map, and ROI volume as predictors. Thus, the BLME method may not outperform other structural imaging methods, highlighting the importance of avoiding overinterpretation of differences. Future studies incorporating direct comparisons with other established longitudinal MRI methods (e.g., tensor-based morphometry, boundary-shift integral) will be important in determining the unique value of BLME metrics. Similarly, there are inherent limitations in comparing the cross-sectional 24-month ROC curve analyses to the longitudinal survival analyses due to the different samples used (n=96 vs. n=234, respectively) and the different data used in each model (single timepoint vs. multiple timepoints, respectively). Additionally, the ROC curve analyses involved a subsample of participants, introducing potential bias and limiting generalizability. Our BLME method is also more resource intensive, as a minimum of three longitudinal MRI scans are required. Requiring a minimum of three MRI scans may increase the financial and time burden for researchers and participants, and it is important to consider whether the advantages of a BLME approach over simpler approaches outweigh the costs. In particular, percentile maps are generated in workflows of numerous existing clinical research and trial settings, and we envision a detailed evaluation of cost-effectiveness, feasibility, and clinical integration of this approach versus our BLME metric as an important future direction. Threshold selection can influence predictive performance and remains an area for methodological refinement. In this study, we explored a range of thresholds based on prior applications in AD^12^, with results demonstrating consistent significance across this range. Future work will explore more granular, data-driven optimization approaches (e.g., ROC-based or cross-validated selection) to further enhance robustness and reproducibility. Furthermore, our study only examined negative erf values, as the goal of our study was to focus on regions that were far from the expected value, and future efforts may also examine the predictive value of positive erf values (i.e., areas that are a less-than-expected decrease). The present study, which sampled across North American and European f-FTLD research networks, had a relatively large longitudinal sample given the rarity of the disease and the restricted inclusion criteria, but sample sizes were nonetheless relatively small for each genetic group. We included some individuals with mild symptoms (CDR^®^+NACC-FTLD = 0.5) due to sample size considerations, but also because mild symptoms are not always indicators of neurodegeneration and participants with mild symptoms can revert to being asymptomatic and may remain so for a number of years^42^. Therefore, disease-specific, biomarker-based metrics of neurodegeneration are very important to assess in these cases. The expected effect of including these cases would be to decrease the BLME’s sensitivity to detecting atrophy at future timepoints, as atrophy rates for some of these participants may have already begun accelerating. As recruitment of asymptomatic members of families affected by these mutations become more common, regular scans well before disease pathophysiology affects brain volume may become more available.
Our study demonstrates that BLME cluster volume predicts dementia conversion in f-FTLD mutation carriers, with particular utility in the GRN and MAPT mutations. This innovative methodology, which can be combined with other biomarkers (e.g., plasma NfL, PET imaging), may help with refining participant selection and trial outcome optimization to tailor mutation-specific therapeutics (Supplementary Figure 2).
Supplementary Material
Supplementary Materials
The reference list from the paper itself. Each links out to its DOI / PubMed record.
- 1Boxer AL, Sperling R. Accelerating Alzheimer’s therapeutic development: The past and future of clinical trials. Cell 2023;186:4757–4772.37848035 10.1016/j.cell.2023.09.023PMC 10625460 · doi ↗ · pubmed ↗
- 2Tsai RM, Boxer AL. Therapy and clinical trials in frontotemporal dementia: past, present, and future. J Neurochem 2016;138:211–221.27306957 10.1111/jnc.13640 PMC 5217534 · doi ↗ · pubmed ↗
- 3Knopman DS, Roberts RO. Estimating the number of persons with frontotemporal lobar degeneration in the US population. J Mol Neurosci 2011;45:330–335.21584654 10.1007/s 12031-011-9538-y PMC 3208074 · doi ↗ · pubmed ↗
- 4Greaves CV, Rohrer JD. An update on genetic frontotemporal dementia. J Neurol 2019;266:2075–2086.31119452 10.1007/s 00415-019-09363-4PMC 6647117 · doi ↗ · pubmed ↗
- 5Roberson ED, Hesse JH, Rose KD, Frontotemporal dementia progresses to death faster than Alzheimer disease. Neurology 2005;65:719–725.16157905 10.1212/01.wnl.0000173837.82820.9f · doi ↗ · pubmed ↗
- 6Boeve BF, Boxer AL, Kumfor F, Advances and controversies in frontotemporal dementia: diagnosis, biomarkers, and therapeutic considerations. Lancet Neurol 2022;21:258–272.35182511 10.1016/S 1474-4422(21)00341-0 · doi ↗ · pubmed ↗
- 7Neylan KD, Miller BL. New Approaches to the Treatment of Frontotemporal Dementia. Neurotherapeutics 2023;20:1055–1065.37157041 10.1007/s 13311-023-01380-6PMC 10457270 · doi ↗ · pubmed ↗
- 8Barbier M, Camuzat A, Houot M, Factors influencing the age at onset in familial frontotemporal lobar dementia. Neurol Genet 2017;3:e 203.29264395 10.1212/NXG.0000000000000203 PMC 5730818 · doi ↗ · pubmed ↗