Veterans Affairs Clinical Resource Hubs and Rates of Mental Health Community Care Referrals
Samantha L. Connolly, Erin L. Jaske, Chelle Wheat, Lawrence J. Wahlberg, Karin Nelson, Idamay Curtis, Bradford Felker

TL;DR
This study finds that VA clinics using mental health resource hubs have fewer referrals to community care, suggesting better access to care within the VA system.
Contribution
The study demonstrates that higher use of VA Clinical Resource Hubs is associated with reduced reliance on community care referrals for mental health.
Findings
Clinics with high Clinical Resource Hub (CRH) utilization had 20 fewer community care referrals per 1000 patients per month.
Successful CRH implementation is linked to decreased reliance on VA-purchased community care for mental health services.
Abstract
This cohort study reports on the association of veterans’ use of Department of Veterans Affairs’ Clinical Resource Hubs for mental health care with the number of referrals to community care. Is increased use of Clinical Resource Hubs (CRHs) associated with decreased referrals to community care (CC) for mental health care within the US Department of Veterans Affairs (VA)? In this cohort study of 1149 mental health clinics within the VA, clinics with greater use of CRHs had a mean of 20 fewer referrals to CC per 1000 patients per month. Results of this study suggest that successful CRH implementation is associated with fewer CC referrals and that clinics with higher CRH utilization become less reliant on VA-purchased CC. In an effort to increase access to care, the US Department of Veterans Affairs (VA) has created 2 additional pathways for veterans to receive mental health (MH)…
Genes, proteins, chemicals, diseases, species, mutations and cell lines named across the full text — each resolved to its canonical identifier and authoritative record.
Click any figure to enlarge with its caption.
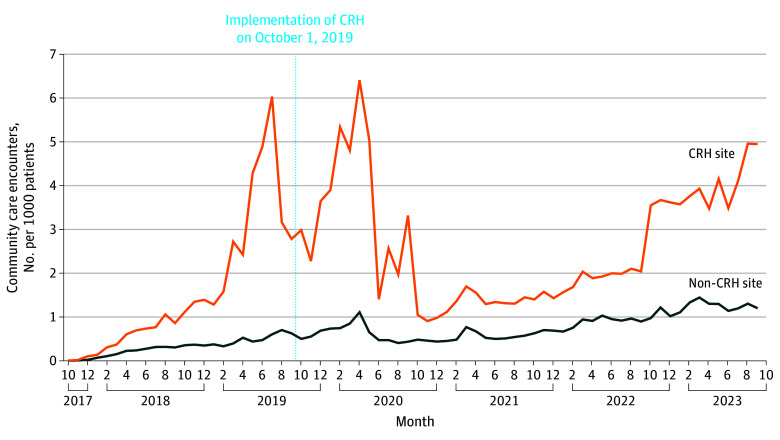 Figure 1
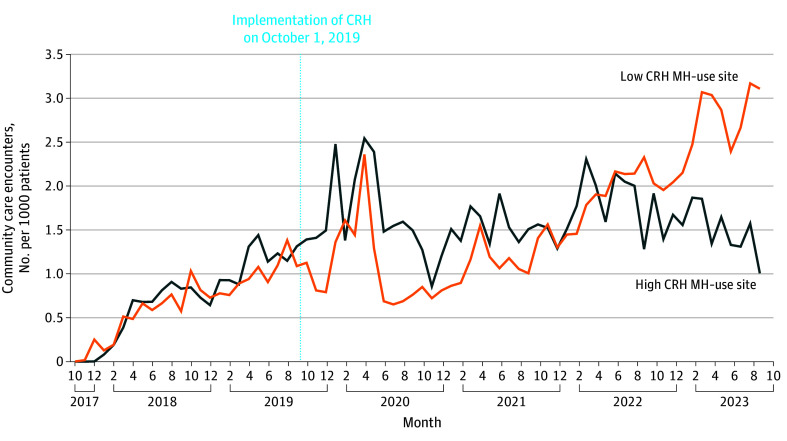 Figure 2
| Characteristic | Non–CRH-engaged clinic (n = 730) | CRH-engaged clinic (n = 419) | |
|---|---|---|---|
| Patient characteristics (n = 1 120 250) | |||
| Age, y | 57.40 (4.25) | 56.72 (3.14) | .001 |
| Sex, % | |||
| Female | 14.76 (6.38) | 14.75 (4.46) | .20 |
| Male | 78.08 (8.64) | 78.11 (6.21) | .70 |
| Race and ethnicity, % | |||
| American Indian or Alaska Native | 2.17 (9.38) | 1.70 (4.25) | .33 |
| Asian | 0.89 (2.07) | 1.00 (2.12) | .76 |
| Hispanic | 8.59 (13.11) | 8.13 (10.82) | .55 |
| Native Hawaiian | 0.52 (0.62) | 1.38 (6.99) | .001 |
| Non-Hispanic Black | 18.36 (19.55) | 15.14 (17.45) | .01 |
| Non-Hispanic White | 66.42 (23.36) | 69.25 (21.72) | .04 |
| Other Pacific Islander | 0.09 (0.21) | 0.10 (0.16) | .76 |
| Multiple races/other | 1.98 (1.63) | 2.29 (1.59) | .002 |
| Marital status, % | |||
| Married | 46.13 (13.66) | 43.77 (10.50) | <.001 |
| Not married | 52.67 (13.83) | 54.77 (10.61) | <.001 |
| Priority status, % | |||
| No disability | 5.37 (3.22) | 5.52 (2.39) | .005 |
| Low income | 16.08 (11.15) | 17.83 (7.85) | <.001 |
| Low/moderate disability | 17.46 (6.55) | 18.51 (5.48) | <.001 |
| High disability | 53.82 (13.38) | 50.48 (10.98) | <.001 |
| Socioeconomic status decile | 4.13 (1.26) | 4.15 (0.99) | >.90 |
| Rurality, % | |||
| Urban | 51.05 (31.42) | 49.66 (28.45) | .20 |
| Rural | 34.89 (27.39) | 36.44 (24.79) | .069 |
| Highly rural/insular islands | 6.34 (13.12) | 6.49 (11.57) | <.001 |
| Drive distance to PC clinic, miles | 17.64 (18.37) | 17.54 (15.93) | .20 |
| Gagne score | 0.53 (0.43) | 0.58 (0.26) | <.001 |
| History of homelessness, % | 5.10 (8.30) | 6.39 (6.59) | <.001 |
| Comorbid conditions, % | |||
| ADHD | 3.4 (2.2) | 4.1 (2.2) | <.001 |
| Anxiety | 33.33 (10.15) | 34.31 (7.33) | .035 |
| Bipolar disorder | 7.91 (4.95) | 9.47 (4.12) | <.001 |
| Cognitive disorder | 6.40 (5.13) | 6.75 (2.94) | <.001 |
| Depression | 46.62 (11.55) | 48.46 (8.31) | .009 |
| PTSD | 38.12 (13.58) | 39.54 (9.12) | .030 |
| Substance use disorder | 21.02 (12.54) | 25.05 (10.97) | <.001 |
| Schizophrenia | 3.22 (5.84) | 3.37 (3.07) | <.001 |
| Traumatic brain injury | 1.19 (18.50) | 1.27 (1.05) | .002 |
| Utilization | |||
| MH visits | 2.517 (2.364) | 2.978 (1.869) | <.001 |
| PCMHI visits | 0.51 (1.00) | 0.48 (0.78) | .010 |
| Primary care visits | 1.30 (0.40) | 1.33 (0.37) | .20 |
| PCMM visits | 10.61 (4.24) | 11.03 (2.57) | <.001 |
| Outpatient visits | 10.75 (4.25) | 11.20 (2.58) | <.001 |
| Clinic characteristics | |||
| Clinic size, No. of enrolled unique patients | 4553.69 (4617.31) | 8192.79 (8059.80) | <.001 |
| PC staffing ratio | 3.06 (1.09) | 3.05 (1.07) | .60 |
| CBOC, No./total No. (%) | 499/730 (68) | 245/419 (58) | <.001 |
| MH underserved score, No./total No. (%) | 71/724 (9.8) | 96/418 (23) | <.001 |
| Medically underserved areas | 0.07 (0.09) | 0.08 (0.10) | <.001 |
| MH population coverage | 0.02 (0.44) | −0.12 (0.45) | <.001 |
| Outpatient MH staff to patient ratio | 7.03 (1.30) | 7.33 (1.46) | .002 |
| Outpatient MH population staffing ratio | 1.96 (0.43) | 1.94 (0.46) | .061 |
| Community care referrals count/1000 unique patients | 3.08 (10.84) | 6.38 (22.39) | <.001 |
| Model | DID (95% CI) | SE | |
|---|---|---|---|
| CRH MH-engaged clinics vs non–CRH MH-engaged clinics | 0.525 (0.181 to 0.868) | 0.175 | .003 |
| High-penetration CRH MH clinics vs low-penetration CRH MH clinics | –20.00 (–21.90 to –18.20) | 0.943 | <.001 |
| Variable | Low CRH MH–penetration clinic (n = 121) | High CRH MH–penetration clinic (n = 115) | |
|---|---|---|---|
| Patient characteristics (n = 259 950) | |||
| Age, y | 56.33 (2.26) | 57.27 (4.13) | .049 |
| Sex, % | |||
| Female | 14.36 (3.46) | 14.49 (5.60) | .90 |
| Male | 78.52 (4.66) | 78.67 (7.88) | .50 |
| Race and ethnicity, | |||
| American Indian or Alaska Native | 1.17 (1.95) | 3.34 (7.81) | .03 |
| Asian | 1.18 (1.68) | 0.79 (2.43) | .12 |
| Hispanic | 9.11 (12.23) | 8.07 (9.58) | .44 |
| Native Hawaiian | 0.61 (0.53) | 2.78 (12.33) | .11 |
| Non-Hispanic Black | 21.59 (17.61) | 8.97 (16.68) | <.001 |
| Non-Hispanic White | 63.07 (20.59) | 73.76 (22.43) | <.001 |
| Other Pacific Islander | 0.11 (0.13) | 0.13 (0.27) | .09 |
| Multiple races/other | 2.08 (0.76) | 2.80 (2.40) | .01 |
| Marital status, % | |||
| Married | 36.55 (9.34) | 50.21 (10.34) | <.001 |
| Not married | 62.12 (9.59) | 48.13 (10.05) | <.001 |
| Priority status, % | |||
| No disability | 4.88 (1.50) | 6.39 (3.27) | <.001 |
| Low income | 19.69 (7.29) | 17.61 (9.24) | .007 |
| Low/moderate disability | 17.10 (3.87) | 21.31 (7.21) | <.001 |
| High disability | 50.74 (9.06) | 47.33 (13.07) | .04 |
| Rurality, % | |||
| Urban | 66.08 (21.56) | 28.35 (26.30) | <.001 |
| Rural | 23.25 (17.78) | 51.09 (25.69) | <.001 |
| Highly rural/insular islands | 3.45 (6.07) | 12.95 (17.79) | <.001 |
| Drive distance to PC clinic, miles | 12.79 (4.66) | 28.30 (27.08) | <.001 |
| Gagne score | 0.73 (0.24) | 0.43 (0.25) | <.001 |
| Socioeconomic status decile | 4.14 (1.00) | 4.05 (1.16) | .40 |
| History of homelessness, % | 11.29 (7.41) | 3.24 (4.29) | <.001 |
| Comorbid conditions, % | |||
| ADHD | 3.76 (1.87) | 3.24 (2.12) | .002 |
| Anxiety | 34.79 (6.70) | 32.65 (7.40) | .03 |
| Bipolar disorder | 10.75 (3.23) | 8.16 (4.57) | <.001 |
| Cognitive disorder | 7.16 (2.46) | 6.00 (3.19) | <.001 |
| Depression | 48.26 (6.82) | 47.01 (8.70) | .60 |
| PTSD | 38.24 (7.30) | 40.13 (10.15) | .30 |
| Substance abuse disorder | 32.84 (11.70) | 20.52 (8.92) | <.001 |
| Schizophrenia | 5.08 (3.55) | 2.07 (2.75) | <.001 |
| Traumatic brain injury | 1.39 (0.72) | 1.20 (1.21) | <.001 |
| Utilization | |||
| MH visits | 4.312 (2.085) | 1.927 (0.897) | <.001 |
| PCMHI visits | 0.41 (0.24) | 0.45 (0.60) | .005 |
| Primary care visits | 1.30 (0.24) | 1.36 (0.49) | .60 |
| PCMM visits | 12.51 (2.55) | 9.76 (2.25) | <.001 |
| Outpatient visits | 12.71 (2.58) | 9.93 (2.19) | <.001 |
| Clinic characteristics | |||
| Clinic size, No. of enrolled unique patients | 12 623.37 (8677.29) | 2825.16 (3399.95) | <.001 |
| PC staffing ratio | 2.82 (0.66) | 3.32 (1.76) | .04 |
| CBOC, No./total No. (%) | 29/95 (31) | 74/105 (70) | <.001 |
| MH underserved score, No./total No. (%) | 14/94 (15) | 41/105 (39) | <.001 |
| Medically underserved areas | 0.11 (0.08) | 0.05 (0.10) | <.001 |
| MH population coverage | 0.04 (0.51) | −0.24 (0.43) | <.001 |
| Outpatient MH staff to patient ratio | 7.56 (1.58) | 7.54 (1.62) | .80 |
| Outpatient MH population staffing ratio | 2.10 (0.54) | 1.89 (0.50) | .001 |
| Community care referrals/1000 unique patients | 4.51 (8.64) | 5.29 (6.28) | .002 |
Peer Reviews
No public reviews on file for this paper yet. If you reviewed it on a platform where reviews are public (OpenReview, ICLR, NeurIPS, ICML), you can paste yours below so the community can read it here.
Videos
No videos yet. Explain this paper in a talk, walkthrough, or lecture? Add one.
Taxonomy
TopicsPrimary Care and Health Outcomes · Emergency and Acute Care Studies · Healthcare Systems and Technology
Introduction
Ensuring that veterans have access to high-quality mental health (MH) care is a key priority of the US Department of Veterans Affairs (VA), the nation’s largest integrated health care system. In addition to providing MH services to veterans at nearby VA facilities, VA has expanded access by offering 2 additional care pathways: VA Clinical Resource Hubs (CRHs) and VA-purchased community care (CC). CRHs are regionally based telehealth contingency staffing hubs through which MH clinicians deliver virtual care to veterans at facilities experiencing MH staffing shortages. CRHs were developed in response to a congressional mandate for VA to increase access to care via the VA Maintaining Internal Systems and Strengthening Integrated Outside Networks (MISSION) Act. The implementation of these hubs began in 2019, and 1 hub now exists in each of the 18 VA geographic regions.^1^ The VA also increased access to care via its VA-purchased CC program, in which the VA pays for veterans to receive MH services from a non-VA clinician in their local community. Access to CC increased when the Veterans Choice Act was passed by Congress in 2014, and eligibility expanded further when the MISSION Act was signed into law in 2018.^2^ The VA can pay for CC if any of the following conditions are met: (1) the veteran needs a service that is not provided at a VA facility, (2) the veteran lives in a state or territory that does not have a full-service VA health facility, (3) it is in the veteran’s best medical interest, (4) VA cannot provide that service in a way that meets its quality standards, or (5) VA cannot provide care within its standards for drive and wait times (<30-minute average drive time or <20-day wait time for an MH appointment).^3^
Findings comparing the relative quality of VA MH services and CC have been mixed. In 1 study^4^ comparing patients who received care via CRHs with those who received CC, those in the CRH group reported substantially fewer barriers to access, while satisfaction scores and clinical outcomes did not differ between the groups. However, a recent survey^5^ found that veterans rated the overall quality of their MH clinician as lower when receiving CC compared with either CRH or non-CRH VA care, and another study^6^ found that CC behavioral health clinicians had fewer years of training compared with VA clinicians. An additional study^7^ found that veterans with MH conditions had significantly lower satisfaction ratings for CC compared with those without MH conditions, although the study did not compare ratings with VA care. There may be challenges coordinating care between VA and CC, which could impact quality.^2^ In addition, compared with VA clinicians, CC clinicians may be less likely to have received training in topics such as military culture and MH conditions that are more prevalent among veterans, including posttraumatic stress disorder, which may impact quality of care.^2^ Qualitative analyses found that veterans tended to prefer receiving their care within the VA when possible, although some respondents emphasized the importance of being able to choose where they received their care.^8^
Given these potential differences in quality and preference, it is important to examine whether the relative use of CRH is associated with CC MH services within clinics. Both programs are intended to increase the availability of MH care, particularly at sites that may be experiencing staffing shortages or longer wait times. It is possible that clinics with higher CRH utilization have fewer CC referrals, as these clinics may have developed stronger infrastructures for CRH referrals and are able to accommodate more of their patients via this pathway, thereby decreasing the need for CC. Alternatively, clinics with local care shortages may rely on both CRH and CC at similar levels to ensure adequate access to services for their patients. This study assesses whether use of VA CRH for MH is associated with number of referrals to CC.
Methods
This retrospective longitudinal cohort study analyzed MH CC referrals from October 1, 2017, through September 30, 2023, across all VA clinics. Data were analyzed from August 20, 2024, to July 15, 2025. This evaluation is part of an ongoing quality-improvement effort at the VA and is not considered research activity as determined by the Office of Primary Care; thus, it is not subject to institutional review board review and waivers and informed consent were not required. This study follows the Strengthening the Reporting of Observational Studies in Epidemiology (STROBE) reporting guideline for observational studies and includes all required information as outlined in the STROBE Cohort Study checklist.^9^
The cohort included 1149 VA clinics and 1 120 250 enrolled veterans with at least 1 VA outpatient MH encounter during the pre-CRH implementation period (2018-2019). CC referrals, patient demographics (including age, gender, self-reported race and ethnicity^10^), marital status, priority status,^11^ rurality, drive distance to the nearest primary care clinic, Gagne score,^12^ and MH comorbid conditions), and clinic-level covariates (including clinic size, primary care staffing ratio,^13^ flags for community-based outreach clinics, MH underserved scores,^14^ medically underserved scores, and measures of MH population covered [eTable 1 in Supplement 1] and MH staffing [eTables 2 and 3 in Supplement 1]) were obtained via the VA Corporate Data Warehouse. Race and ethnicity were included because racially and ethnically minoritized people have been shown to have lower rates of mental health utilization and access.^15^ Clinics were considered engaged in CRH if they had 5 or more CRH MH encounters for at least 2 consecutive months. Each patient was assigned an indicator if they received care at a site offering CRH MH care. Data were aggregated at the facility level, and clinics were classified as either using CRH or being a non-CRH site. A measure of the percentage of clinic-level MH care that was delivered by CRH (the CRH MH–penetration score) was used to assess the amount of CRH MH care that clinics were receiving relative to other CRH clinics. CRH-engaged clinics were assigned an indicator if their CRH MH–penetration scores were among the top 25% (high CRH penetration) or bottom 25% (low CRH penetration). This method has been used in previously published CRH analyses.^10^
Statistical Analysis
Descriptive comparisons between CRH and non-CRH clinics, and between high and low CRH MH–utilizing clinics, were conducted using t tests and χ^2^ tests. Clinics were weighted and matched using inverse probability weighting, adjusting for key covariates that may differ between groups in an effort to prevent confounding, including proportion of the MH population covered (eTable 1 in Supplement 1), MH staffing levels (eTables 2 and 3 in Supplement 1), proportion of rural and female veterans, facility type (VA medical center vs community-based outpatient clinic), region, the number of monthly CC referrals at baseline, clinic size, and the number of MH visits at baseline. Covariates were chosen given that they have shown significant differences based on CRH MH site status in previous studies.^10^ The estimates from a logistic regression model were used to generate propensity scores and subsequent inverse probability weights. Covariate balance was assessed before and after weighting using the cobalt package in RStudio 2025.05.1 Build 513(R Foundation for Statistical Computing) with good overall balance (standardized mean difference < 0.10). No weight stabilization or truncation was needed.
We applied a difference-in-differences (DID) approach to evaluate changes in CC MH referral rates for CRH MH–engaged clinics vs non–CRH MH-engaged clinics between the pre–CRH implementation period (2018-2019) and post–CRH MH implementation (2020-2023) using the propensity-matched cohorts. Specifically, we used the Puhani DID estimator to estimate the pre-post change in outcome and calculated SEs using the delta method.^16^ We assessed the parallel trends assumption by visual inspection of graphical trends of the outcome, as well as by estimating regressions that included a linear time trend, group assignment, and the interaction between time trend and group assignment. Although there is no direct way to test if the parallel trends assumption holds, visual inspection of trend graphs and no evidence of an interaction between group assignment and time in the logistic regression model provide evidence in support of this assumption. We then used the same approach to evaluate changes in CC MH referral rates for high CRH MH–penetration vs low CRH MH–penetration sites. Two-sided P values < .05 were considered statistically significant. Analyses were conducted using SAS EG version 9.3 (SAS Institute) and RStudio 2025.05.1 Build 513 (R Foundation for Statistical Computing).
Results
The overall study sample included 1 120 250 patients (mean [SD] age, 60.04 [15.38] years; 15.99% female and 84.01% male). Self-reported race and ethnicity categories were American Indian or Alaskan Native, 1.06%; Asian, 1.27%; Hispanic, 10.11%; Native Hawaiian, 0.77%; Non-Hispanic Black, 25.83%; Non-Hispanic White, 57.66%; Other Pacific Islander, 0.10%; and multiple races or other, 2.13%.
CRH vs Non-CRH Clinics
At baseline, clinics that used CRH MH services (n = 419) were larger (mean [SD] clinic size, 8192.79 [8059.80] vs 4553.69 [4617.31] unique enrolled patients; P < .001), had fewer mean (SD) MH visits per patient (2.978 [1.869] vs 2.517 [2.364]; P < .001), and were more likely to be medical centers vs community-based outpatient clinics (58% community-based clinics vs 68% medical centers; P < .001) compared with clinics that were not engaged with CRH MH (n = 730). Patients at CRH MH–engaged clinics had significantly higher mean (SD) rates of several comorbid MH conditions, including bipolar disorder (9.47% [4.12%] vs 7.91% [4.95%]; P < .001), depression (48.46% [8.31%] vs 46.62% [11.55%]; P < .001), and substance use disorder (25.05% [10.97%] vs 21.02% [12.54%]; P < .001) compared with clinics that were not providing CRH care (Table 1). At baseline, CRH-engaged clinics referred more patients to CC compared with non-CRH clinics (mean [SD] 6.38 [22.39] referrals/1000 patients at CRH clinics vs 3.08 [10.84] referrals/1000 patients at non-CRH clinics; P < .001). We then used DID analysis to compare preintervention and postintervention referral rates between CRH MH clinics and non-CRH MH clinics to see how the number of referrals changed following CRH implementation efforts. CRH MH clinics generated a mean (SD) of 0.53 (0.43) more CC MH referrals in the postimplementation period (DID, 0.525; 95% CI, 0.181-0.868; P = .003) compared with non–CRH MH clinics (Figure 1, Table 2).
Line Graph of Monthly Trends of Community Care MH Referrals Before and After CRH MH Implementation at Non–CRH-Engaged vs CRH-Engaged ClinicsCRH indicates Clinical Resource Hub; MH, mental health.
High vs Low CRH–Penetration Clinics
At baseline, high-penetration CRH MH clinics (n = 115) had mean (SD) fewer MH visits (19.3 [9.0] vs 43.1 [20.9]; P < .001), were more likely to be rural (51.1% [25.7%] vs 23.3% [17.8%]; P < .001), and were more likely to be community-based outpatient clinics (70% vs 31%; P < .001) compared with the low-penetration CRH MH clinics (n = 121). Patients at low CRH MH–penetration clinics had higher, significant percentages of several MH comorbid conditions, including bipolar disorder (10.8% [3.2%] vs 8.2% [4.6%]; P < .001), substance use disorder (32.8% [11.7%] vs 20.5% [8.9%]; P < .001), and schizophrenia (5.1% [3.6%] vs 2.1% [2.8%]; P < .001) compared with high CRH MH–penetration clinics. Clinics with high CRH MH penetration had small but significant differences in CC referral rates at baseline compared with clinics with low CRH MH penetration (mean [SD], 4.51 [8.64] referrals/1000 patients at low-penetration CRH MH clinics vs 5.29 [6.28] referrals/1000 patients at high-penetration CRH MH clinics; P < .001; Table 3). DID models showed that clinics with high CRH MH penetration experienced a significant reduction in CC MH referrals in the postimplementation period, generating, on average, 20 fewer referrals per month compared with low-penetration clinics (DID, –20.00; 95% CI, –21.90 to –18.20; SE, 0.94; z score, –21.20; P < .001) (Table 3, Figure 2).
Line Graph of Monthly Trends of Community Care Mental Health (MH) Referrals Before and After Clinical Resource Hub (CRH) MH Introduction at Low CRH MH–Penetration vs High CRH MH–Penetration Clinics
Discussion
The current study examined whether increased use of VA CRHs was associated with decreased CC referrals for veterans receiving MH services. When comparing clinics with any CRH MH referrals with clinics with no CRH MH referrals, there was a slight but significant increase in CC referrals among CRH MH–engaged clinics in the postimplementation period. These findings suggest that clinics falling into the any CRH MH utilization category are generally underresourced facilities that may turn to both CRH and CC for referral support. However, when classifying CRH clinics as either high or low penetration based on their relative utilization of CRH MH visits (top or bottom 25%), a substantially larger effect emerged in the opposite direction. Specifically, high-penetration CRH clinics had a mean (SE) of 20 (0.943) fewer CC encounters per month compared with low-penetration clinics at the end of the CRH implementation period. Clinics that utilize CRHs are, by definition, sites with MH access shortages. However, our findings demonstrate an important difference based on whether sites were classified based on having any CRH use vs having CRH use that fell in the top 25% (high-penetration sites). Use of the any CRH use definition identified underresourced sites more generally that rely on both CRH and CC, but this definition was not sensitive enough to determine whether CRH referrals had been fully integrated into site processes. Conversely, the high-penetration definition identified a unique subset of sites that made CRH referrals more frequently and demonstrated substantial decreases in CC referrals over time. This finding suggests that successful implementation of CRHs may be associated with decreased reliance on CC.
These results underscore the importance of having strong infrastructures and adequate staffing to support the development of CRHs and achieve optimal rates of uptake. The rollout of CRHs included a bundle of implementation strategies, such as mandating program elements, involving leadership, engaging in strategic planning, providing national trainings, and developing tools to collect feedback and track progress.^1,17^ While these strategies were offered to all clinics, the difference in CRH penetration rates observed in the current study suggests that there was variability in implementation success across facilities. Similarly, clinics may differ in the degree to which CC referral processes have been successfully implemented; indeed, some clinics may struggle with identifying adequate networks of CC clinicians and may encounter challenges and confusion around reimbursement and eligibility requirements, while other clinics may face fewer barriers and may therefore use CC more frequently.^18^ High CRH–penetration clinics were more likely to be smaller, community-based outpatient clinics in rural locations. These site-level characteristics may allow CRH MH services to more rapidly integrate into the routine workflow of these smaller clinics, although additional research is needed to better understand what factors led to these sites utilizing CRHs at greater rates relative to CC. Future, more in-depth work will be necessary to understand factors contributing to site-level differences in both CRH and CC uptake.
The findings have relevance for non-VA settings as well. Multiple other health systems, including those serving rural and low-income populations, have turned to telemental health hub models to meet patient demand; via these programs, patients receive telemental health care from an alternative facility within the same or affiliated health system.^19,20^ Current findings lend support to the premise that these models can be successful in retaining patients within health systems. This is particularly important as receiving MH services outside of one’s primary health network has been found to have higher costs and lead to more fragmented care.^21,22,23^ The development of robust telehealth hub models may serve to positively benefit MH care provision in a wide variety of settings, both within and outside of the VA.
Strengths and Limitations
Strengths of this work include its use of rigorous statistical methods to examine differences between sites with high and low CRH utilization. We utilized inverse probability weighting, which accounted for covariates that may differ between groups, such as clinic size, staffing, and rurality, in an effort to reduce potential confounding.
The current study also has several limitations. First, as a retrospective observational study, it cannot establish causality and unmeasured confounding may affect findings. Clinics were labeled as CRH sites if they had 2 or more consecutive months of use within a fiscal year, which may not fully capture the consistency or integration of CRH MH services across clinics. CC referrals were used as a proxy for unmet demand, but this metric may reflect administrative factors or patient preference rather than actual MH access gaps. The current study did not differentiate between therapy and medication management visits. It will be important to examine whether there are differences between high and low CRH–utilizing sites with regard to the types of appointments most frequently offered. It is also worth noting that the postimplementation phase of the study occurred during the COVID-19 pandemic. However, as CRH implementation was a nationwide initiative, we would not expect that CRH clinics would be differentially impacted by COVID-19 compared with non-CRH clinics. Finally, while this study describes patterns of utilization, it did not evaluate clinical outcomes or patient satisfaction, which are critical for understanding the effectiveness of the CRH program. However, recent work has demonstrated higher patient ratings of care quality for CRH compared with CC,^5^ and other studies have shown advantages of VA MH care over CC, including greater patient satisfaction^7^ as well as the availability of more highly trained clinicians within VA.^6^ Qualitative work has also found that veterans tended to prefer receiving care within VA, although the ability to choose the location of care was also deemed to be important.^8^
Conclusions
Findings of this study suggest that successful implementation of CRHs, VA’s regional telehealth contingency staffing program, was associated with decreased CC utilization. Given that veterans may rate their satisfaction with VA MH services, including those provided via CRHs, as higher than CC, these results emphasize the importance of supporting clinics in developing strong CRH infrastructures. As veterans now have an increasing degree of choice in how they receive their MH care, it will be critical to continue studying factors that impact the relative utilization of VA MH services and CC.
The reference list from the paper itself. Each links out to its DOI / PubMed record.
- 1Rubenstein LV, Curtis I, Wheat CL, . Learning from national implementation of the Veterans Affairs Clinical Resource Hub (CRH) program for improving access to care: protocol for a six year evaluation. BMC Health Serv Res. 2023;23(1):790. doi:10.1186/s 12913-023-09799-537488518 PMC 10367243 · doi ↗ · pubmed ↗
- 2Rasmussen P, Farmer CM. The promise and challenges of VA community care: veterans’ issues in focus. Rand Health Q. 2023;10(3):9.37333666 PMC 10273892 · pubmed ↗
- 3US Department of Veterans Affairs. Eligibility for community care outside VA. Updated September 11, 2025. Accessed September 15, 2025. https://www.va.gov/resources/eligibility-for-community-care-outside-va/
- 4Fortney JC, Carey EP, Rajan S, Rise PJ, Gunzburger EC, Felker BL. A comparison of patient-reported mental health outcomes for the Department of Veterans Affairs’ regional telehealth and Community Care Programs. Health Serv Res. 2022;57(4):755-763. doi:10.1111/1475-6773.1399335467011 PMC 9264470 · doi ↗ · pubmed ↗
- 5Rose D, Guo R, Jackson N, . Ratings of communication and providers among VA Clinical Resource Hub and Community Care patients, FY 2020-2023. Presented at: Academy Health 2025 Annual Research Meeting; June 7-10, 2025; Minneapolis, MN.
- 6Vanneman ME, Rosen AK, Wagner TH, . Differences between VHA-delivered and VHA-purchased behavioral health care in service and patient characteristics. Psychiatr Serv. 2023;74(2):148-157. doi:10.1176/appi.ps.20210073036039555 PMC 10069743 · doi ↗ · pubmed ↗
- 7Vanneman ME, Roberts ET, Li Y, . Experiences with VA-purchased community care for US veterans with mental health conditions. JAMA Netw Open. 2025;8(5):e 2511548-e 2511548. doi:10.1001/jamanetworkopen.2025.1154840397443 PMC 12096262 · doi ↗ · pubmed ↗
- 8Sayre GG, Neely EL, Simons CE, Sulc CA, Au DH, Michael Ho P. Accessing care through the Veterans Choice Program: the veteran experience. J Gen Intern Med. 2018;33(10):1714-1720. doi:10.1007/s 11606-018-4574-830039494 PMC 6153225 · doi ↗ · pubmed ↗