Sex based disparities in glycemic control and hospitalization outcomes of medical patients with diabetes mellitus—a historical cohort study
Ronit Koren, Matan Elkan, Arielle Barouch, Tomer Ziv-Baran

TL;DR
This study finds that men with diabetes in hospitals have worse blood sugar control and higher rehospitalization rates compared to women.
Contribution
The study reveals sex-based disparities in inpatient diabetes management and outcomes, which were previously less understood.
Findings
Men had higher rates of hyperglycemia and severe hyperglycemia compared to women.
Men were more likely to be rehospitalized within 30 days than women.
Men were more frequently treated with chronic aspirin therapy than women.
Abstract
While sex differences in type 2 diabetes mellitus (T2DM) are well-documented in outpatient settings, data on inpatient disparities remain limited. This study examines the relationship between sex and glycemic control, chronic treatment patterns, and hospitalization outcomes in patients with T2DM. A historical cohort of 5,133 adult T2DM patients hospitalized for > 24 h at a tertiary Israeli medical center in 2023 was analyzed. Outcomes included hypoglycemia, hyperglycemia, length of stay, 30-day readmission, and mortality. Propensity score matching and multivariable regression were applied to adjust for confounding variables. Men were more frequently treated with chronic aspirin therapy than women (35.8% vs. 29.4%; p < 0.001), a difference that remained significant after multivariable adjustment (aOR 1.31; 95% CI: 1.13–1.52; p < 0.001). Male sex was also associated with higher rates of…
Genes, proteins, chemicals, diseases, species, mutations and cell lines named across the full text — each resolved to its canonical identifier and authoritative record.
Click any figure to enlarge with its caption.
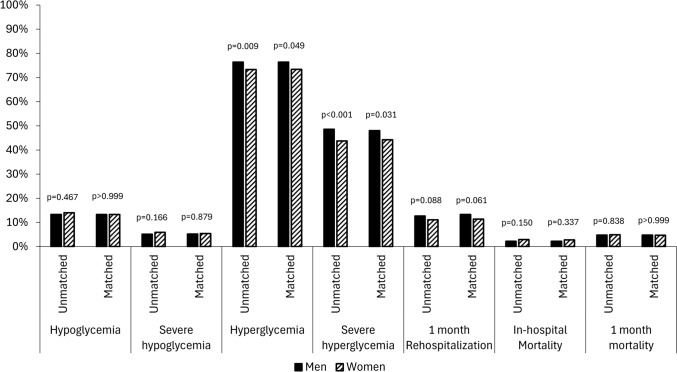 Figure 1
- —Ministry of Innovation, Science and Technology and the Ministry of Health
- —Tel Aviv University
Peer Reviews
No public reviews on file for this paper yet. If you reviewed it on a platform where reviews are public (OpenReview, ICLR, NeurIPS, ICML), you can paste yours below so the community can read it here.
Videos
No videos yet. Explain this paper in a talk, walkthrough, or lecture? Add one.
Taxonomy
TopicsHyperglycemia and glycemic control in critically ill and hospitalized patients · Diabetes Treatment and Management · Diabetes, Cardiovascular Risks, and Lipoproteins
Introduction
Sex plays a crucial role in precision medicine, influencing nearly all aspects of disease pathophysiology, including mechanism, prevalence, progression, treatment response, and prognosis [1]. In diabetes, well-documented sex differences exist in metabolic regulation and cardiovascular risk [2]. Men have a higher prevalence of type 2 diabetes mellitus (T2DM) in young and middle-aged populations, whereas women exhibit a higher prevalence of undiagnosed diabetes and an increased diabetes risk after the age of 70 [3, 4]. Men more frequently present with impaired fasting glucose, while women more commonly exhibit impaired glucose tolerance [5].
Disparities in clinical care and treatment patterns parallel these sex-based biological differences. In a large outpatient cohort, diabetes care was of poorer quality in women compared with men, including in achieving glucose and lipid targets and diabetic foot monitoring [6]. Furthermore, sex-based disparities exist in medication prescriptions. It seems that the perception of cardiovascular risk is lower for women; hence, preventive measures are recommended less often [7]. For example, men with cardiovascular disease or heart failure (HF) receive sodium-glucose co-transporter-2 (SGLT2) inhibitors more often and at an earlier stage than women [8, 9]. Similarly, women are less frequently prescribed cardioprotective medications such as statins, aspirin, and angiotensin-converting enzyme (ACE) inhibitors [10, 11], and anti-diabetic guideline directed medical therapy [12]. Patient adherence to prescribed therapies may represent an additional factor contributing to sex-based differences in care. Large cohorts demonstrate increase in cardiovascular morbidity and mortality in women with diabetes (but not with prediabetes) compared with men [13]. Differences in care and lifestyle may only partly explained the higher incidence of coronary heart disease and cardiovascular mortality in diabetic women [14, 15].
Despite well-established sex differences in outpatient diabetes care, data on disparities among hospitalized patients with diabetes remain limited. Compared to the general population, individuals with diabetes face an increased risk of hospitalization [16], and readmission [17]. Sex-based differences have been reported in hospitalization and readmission rates, causes of admission, risk of hypoglycemia, and discharge destination [18, 19].
Although sex disparities in glycemic control have been extensively described in the outpatient setting, little is known about sex-based differences among hospitalized patients with T2DM. The inpatient environment presents unique challenges for glucose management due to acute stress responses, altered nutritional intake, intensive monitoring, and different treatment algorithms compared to the outpatient setting. Importantly, both hyperglycemia and hypoglycemia during hospitalization have been shown to adversely impact short- and long-term outcomes.
[20] Most guidelines recommend initiating insulin therapy in critically ill and non-critically ill patients with glucose levels >180 mg/dL, aiming for glycemic targets of 100–180 mg/dL [21]. However, data on sex differences in inpatient glycemic control are scarce, with limited evidence such as a small study reporting greater insulin resistance in critically ill women [22].
This study aims to evaluate sex-based differences in glycemic control, hospital length of stay, and short- and long-term mortality among patients with T2DM, adjusting for baseline comorbidities and clinical characteristics. Addressing these gaps is critical, as identifying sex-specific disparities in may inform tailored management strategies and ultimately improve outcomes for both sexes.
Methods
Study design and participants
This was a historical cohort study including all consecutive adult patients (aged >18 years) with type 2 diabetes mellitus (T2DM) who were hospitalized for more than 24 h in medical wards at Shamir Medical Center (SMC) between January 1, 2023, and December 31, 2023.
SMC is a 904-bed university-affiliated tertiary medical center located in Israel’s central region and serves urban and rural populations. SMC comprises 7 internal medicine departments with a total of 269 beds. Hospitalization outcomes were assessed through February 2024. Patients were excluded if they were admitted for acute diabetes-related complications (diabetic ketoacidosis or hyperosmolar state), were pregnant, or had type 1 diabetes mellitus.
Data collection
Data was accessed via the Israeli Ministry of Health’s Kineret Platform. Kineret is a cloud-based service that facilitates secure, anonymized analysis of electronic health records structured within the Observational Medical Outcomes Partnership (OMOP) Common Data Model [23]. The cohort was designed and characterized using ATLAS [24], an open-source tool developed by the Observational Health Data Sciences and Informatics (OHDSI) community [25]. Ethical approval was obtained from the local institutional ethics committee before study initiation (approval number 0224-24ASF).
Study variables, measurements, and definitions
Comorbidities were identified using International Classification of Diseases (ICD-9-CM) codes, while medications were classified according to the Anatomical Therapeutic Chemical (ATC) system (Supplementary Tables S1 and S2).
Laboratory indices, including hemoglobin, albumin, creatinine, electrolytes, and C-reactive protein (CRP), were collected from the first available post-admission results up to 24 hours from arrival. Glomerular filtration rate (GFR) was calculated using the “CKD-EPI” equation. Acute kidney injury (AKI) was defined as an increase in serum creatinine of ≥0.3 mg/dL during hospitalization.
We also collected data on chronic cardioprotective treatment such as the use of antiplatelets (aspirin, clopidogrel), ACE inhibitors, angiotensin receptor blockers (ARBs), statins, and SGLT2 inhibitors before hospitalization.
The primary outcomes were based on 4 levels of glycemic control during hospitalization: hypoglycemia (≤70 mg/dL), severe hypoglycemia (≤54 mg/dL), hyperglycemia (>180 mg/dL), and severe hyperglycemia (>250 mg/dL). We analyzed the percentage of all measurements in range of 100–180 mg/dL during hospitalization. Data were derived from blood tests and point-of-care glucose monitoring.
Additional outcomes included length of stay, rehospitalization within one month, and all-cause mortality during hospitalization and within 30-days since hospital admission. Mortality data were obtained from the Israeli Ministry of Interior’s national registry.
Sample size
A two-group design was employed to investigate whether the proportions of the studied outcome differ between men and women. The sample size calculation was made using a two-sided, two-sample Z-test, with a Type I error rate (α) of 0.01, a power of 90%, and an equal number of patients in each group. To detect a small effect (effect size = 0.2) of sex on the studied outcomes, the number of subjects needed in each group was 744.
Statistics
Categorical variables were described as frequencies and percentages. Continuous variables were evaluated for normal distribution using histograms and reported as means and standard deviations or as medians and interquartile ranges (IQR). The chi-square test was used to compare categorical variables between the sex groups, and the independent samples t-test and Mann-Whitney tests were applied to compare continuous variables. Multivariable logistic regression was applied to evaluate the association between sex and the studied outcomes while controlling for possible known confounders. Each regression contained two blocks. In the first block, sex and age were forced into the regression. In the second block, the following variables were considered for inclusion using the forward selection method (the Wald test was used and p < 0.05 was the criterion for inclusion): Chronic Obstructive Pulmonary disease (COPD)/asthma, pulmonary embolism, liver disease, rheumatic disease, chronic infection, hypertension (HTN), HF, ischemic heart Disease, atrial fibrillation/flutter, cardiac arrhythmias, peripheral artery disease (PVD), dyslipidemia, past stroke\transient ischemic attack (TIA), dementia, malignancy, systemic steroids, white blood cells (WBC), lymphocytes, neutrophils, hemoglobin, platelets, C-reactive protein (CRP), albumin, estimated GFR (eGFR), calcium, corrected calcium level, potassium, sodium, diastolic blood pressure (BP), systolic BP, pulse, temperature, glucose levels, high density lipoprotein (HDL), triglycerides, low density lipoprotein (LDL), and body mass index (BMI).
The two sex groups were matched according to the probability of a patient being a male. The probability (propensity score) was calculated using a logistic regression model. The following parameters were used to calculate the propensity score: age, BMI, systemic steroids, COPD/asthma, liver disease, chronic infection, HTN, HF, ischemic heart disease (IHD), atrial fibrillation flutter, acute arrhythmia, PVD, dyslipidemia, past stroke/TIA, dementia, and malignancy.
To strengthen our findings [26], propensity score matching was performed using 1:1 nearest neighbor matching with a 0.05 caliper width to balance covariates between groups. Standardized differences were calculated to compare the two sex groups, before and after matching. A standardized difference < 0.1 was considered a negligible difference, and a difference between 0.1 and 0.2 was considered a small difference (Supplementary Table S3). The matched groups were compared using the McNamar test for categorical variables, and the paired t-test or Wilcoxon test for the continuous variables.
All the statistical tests were two-sided, and p < 0.05 was considered statistically significant. Statistical analysis was performed using R (version 4.1.2, R Foundation for Statistical Computing, Austria, 2023).
Results:
Study population – unmatched cohort
Overall, 5133 patients met the criteria and were included in the study. Of them, 2,845 were men and 2,288 were women. Their demographic characteristics, comorbidities, and chronic medications are presented in Table 1. Before matching, women were older (median 77 vs. 74 years, p < 0.001) and had a higher BMI (median 28.1 vs. 27.3 kg/m^2^, p < 0.001). Women had higher rates of HTN (52.7% vs. 47.0%), while men had more IHD (26.6% vs. 13.6%), cerebrovascular disease (11.7% vs. 8.7%), CKD (17.2% vs. 14.1%), and PVD (5% vs. 1.8%), p < 0.001 for all comparisons. Men were more frequently treated with aspirin (35.8% vs. 29.5%, p < 0.001) and clopidogrel (11% vs. 7.2%, p < 0.001). Overall, few people were treated with GLP1 agonists or SGLT2 inhibitors. Men were more likely to receive SGLT2 inhibitors (7.8% vs. 5% p < 0.001) and long-acting insulin (40% vs. 35.4 %, p < 0.001). Women were more likely to be treated for HTN (44.7% vs. 41.5%, p = 0.024). There were no significant differences (p > 0.05) in the use of ACE inhibitors or ARBs. Table 1. Baseline characteristics, before and after matchingUnmatched cohortMatched cohortMen (n = 2845)Women (n = 2288)P-valueMen (n = 1755)Women (n = 1755)P-valueAge, years, median [IQR]74 [66–81]77 [70–85] < 0.00175 [68–82]75 [68–83]0.243BMI, kg/m^2^, median [IQR]27.3 [24.5–30.9]28.1 [24.8–32.4] < 0.00127.7 [24.7–31.2]27.7 [24.2–31.6]0.981Comorbidities HTN, n (%)1337 (47.0%)1206 (52.7%) < 0.001881 (50.2%)882 (50.3%) > 0.999 Dyslipidemia, n (%)1331 (46.8%)1118 (48.9%)0.138857 (48.8%)839 (47.8%)0.555 CHF, n (%)280 (9.8%)224 (9.8%)0.951159 (9.1%)160 (9.1%) > 0.999 IHD, n (%)758 (26.6%)312 (13.6%) < 0.001296 (16.9%)277 (15.8%)0.297 Atrial fibrillation/flutter, n (%)369 (13.0%)359 (15.7%)0.005230 (13.1%)250 (14.2%)0.358 Past CVA/TIA, n (%)334 (11.7%)198 (8.7%) < 0.001167 (9.5%)161 (9.2%)0.764 CKD, n (%)488 (17.2%)322 (14.1%)0.003286 (16.3%)232 (13.2%)0.012 COPD/Asthma, n (%)300 (10.5%)242 (10.6%)0.970183 (10.4%)179 (10.2%)0.866 Liver disease, n (%)83 (2.9%)99 (4.3%)0.00761 (3.5%)63 (3.6%)0.924 Connective tissue disease, n (%)36 (1.3%)110 (4.8%) < 0.00125 (1.4%)85 (4.8%) < 0.001 PVD, n (%)143 (5.0%)42 (1.8%) < 0.00143 (2.5%)40 (2.3%)0.812 Dementia, n (%)51 (1.8%)72 (3.1%)0.00240 (2.3%)37 (2.1%)0.82 Malignancy, n (%)260 (9.1%)218 (9.5%)0.633174 (9.9%)169 (9.6%)0.819 Charlson Index^b^, median [IQR]5 [4–7]5 [4–7] < 0.0015 [4–7]5 [4–7]0.201Chronic Medications Metformin, n (%)1257 (44.2%)1043 (45.6%)0.315787 (44.8%)814 (46.4%)0.360 Long-acting Insulin, n (%)379 (13.3%)281 (12.3%)0.268229 (13.0%)210 (12.0%)0.332 Short-acting Insulin, n (%)153 (5.4%)116 (5.1%)0.62379 (4.5%)91 (5.2%)0.345 SU, n (%)141 (5.0%)87 (3.8%)0.04689 (5.1%)70 (4.0%)0.123 Non-SU, n (%)151 (5.3%)100 (4.4%)0.12296 (5.5%)65 (3.7%)0.012 DPP4, n (%)154 (5.4%)143 (6.2%)0.20295 (5.4%)102 (5.8%)0.608 GLP1 agonists, n (%)147 (5.2%)111 (4.9%)0.607100 (5.7%)95 (5.4%)0.761 SGLT2 inhibitor, n (%)223 (7.8%)115 (5.0%) < 0.001135 (7.7%)97 (5.5%)0.013 Any BP Medication n (%)^a^1181 (41.5%)1022 (44.7%)0.023734 (41.8%)745 (42.5%)0.707 Ace inhibitors/ARB1310 (46.0%)1091 (47.7%)0.242831 (47.4%)814 (46.4%)0.581 Plavix, n (%)313 (11.0%)165 (7.2%) < 0.001168 (9.6%)136 (7.7%)0.059 Aspirin, n (%)1019 (35.8%)674 (29.5%) < 0.001609 (34.7%)515 (29.3%) < 0.001 Statins, n (%)1532 (53.8%)1150 (50.3%)0.011931 (53.0%)879 (50.1%)0.085 Thiazolidinediones, n (%)36 (1.3%)31 (1.4%)0.77920 (1.1%)27 (1.5%)0.304 Diuretics, n (%)404 (14.2%)394 (17.2%)0.003253 (14.4%)278 (15.8%)0.239 Systemic Steroids, n(%)271 (9.5%)231 (10.1%)0.494182 (10.4%)170 (9.7%)0.500 Long-acting Insulin, n (%)1137 (40.0%)809 (35.4%) < 0.001697 (39.7%)639 (36.4%)0.044 Short-acting Insulin, n (%)1066 (37.5%)815 (35.6%)0.172657 (37.4%)656 (37.4%)0.972ACE, angiotensin converting enzyme; ARB, angiotensin receptor blockers; BMI, body mass index; CHF, congestive heart failure; CKD, chronic kidney disease; COPD, chronic obstructive pulmonary disease; CVA, cerebrovascular accident; DPP4, Dipeptidyl peptidase-4; GLP-1, Glucagon-like peptide-1; HTN, hypertension, IHD, ischemic heart disease; PVD, peripheral vascular disease; SU, sulfonylurea; SGLT2, sodium-glucose transport protein 2; TIA, transient ischemic stroke^a^Including- ACE inhibitors, ARB, thiazide diuretics, alpha antagonists, beta blockers^b^Charlson index [39]
The cause of admission differed between men and women. Acute infection was slightly more common in men than in women (33.6% vs. 30.1%, p = 0.007). Chest pain and acute coronary syndrome (ACS) were more frequent in men (17.3 % vs. 12.8%, p < 0.001, and 32.9% vs. 18.4% p < 0.001, respectively), manifested in higher troponin levels in men (median 25 vs. 21 ng/L, p < 0.001). Women had higher rates of pulmonary embolism (2.1% vs 0.7% p < 0.001). LDL levels were higher in women (median 73 vs. 62mg/dL p < 0.001), which correlated with lower statin use in women (50.3% vs. 53.8%, p = 0.012). Men were also treated more often with SGLT2 inhibitors (7.8% vs. 5% p > 0.001). (Table 2) Table 2. Hospitalization characteristics, before and after matchingUnmatched cohortMatched cohortMen (n = 2845)Women (n = 2288)P-valueMen (n = 1755)Women (n = 1755)P-valueCause of admission Acute infection, n (%)956 (33.6%)688 (30.1%)0.007585 (33.3%)521 (29.7%)0.019 Chest pain, n (%)491 (17.3%)294 (12.8%) < 0.001293 (16.7%)241 (13.7%)0.016 Dyspnea, n (%)273 (9.6%)282 (12.3%)0.002171 (9.7%)205 (11.7%)0.071 COPD/Asthma, n (%)326 (11.5%)261 (11.4%)0.954198 (11.3%)193 (11.0%)0.829 ADHF, n (%)465 (16.3%)386 (16.9%)0.614285 (16.2%)286 (16.3%) > 0.999 ACS, n (%)936 (32.9%)420 (18.4%) < 0.001430 (24.5%)364 (20.7%)0.002 Acute atrial fibrillation, n (%)457 (16.1%)442 (19.3%)0.002300 (17.1%)308 (17.5%)0.755 Acute TIA/CVA, n (%)489 (17.2%)332 (14.5%)0.009271 (15.4%)248 (14.1%)0.295 AKI^a^, n (%)468 (16.5%)340 (14.9%)0.112286 (16.4%)252 (14.4%)0.116 Acute arrhythmia, n (%)114 (4.0%)89 (3.9%)0.83082 (4.7%)72 (4.1%)0.465 Pulmonary embolism, n (%)21 (0.7%)47 (2.1%) < 0.00114 (0.8%)29 (1.7%)0.031Laboratory results upon admission: WBC, count/µL, median [IQR]9.2 [7.2–12.2]9.3 [7.2–12.4]0.7039.1 [7.2–12.1]9.3 [7.2–12.4]0.212 Lymphocytes, count/µL, median [IQR]1.3 [0.8–1.9]1.4 [0.9–2.0] < 0.0011.3 [0.8–1.8]1.4 [0.9–2.0] < 0.001 Neutrophils, count/µL, median [IQR]6.7 [5.0–9.5]6.7 [4.9–9.8]0.9466.6 [4.9–9.4]6.7 [4.9–9.8]0.653 Hemoglobin, g/dL, mean ± SD12.8 (± 2.3)11.8 (± 2.0) < 0.00112.8 (± 2.3)11.8 (± 2.0) < 0.001 Platelets, count/µL, median [IQR]214 [168–274]247 [197–310] < 0.001213 [167–270]247 [199–312] < 0.001 CRP, mg/L, median [IQR]17 [4–77]14 [4–58]0.00317 [4–77]13 [4–57]0.003 Albumin, g/dL, mean ± SD3.65 (± 0.54)3.61 (± 0.54)0.0123.66 (± 0.54)3.63 (± 0.55)0.100 Creatinine, mg/dL, median [IQR]1.15 [0.89–1.67]0.96 [0.72–1.39] < 0.0011.15 [0.90–1.64]0.93 [0.71–1.37] < 0.001 eGFR, mL/min/1.73 m^2^, median [IQR]67 [42–89]61 [38–87] < 0.00166 [42–89]64 [40–88]0.087 Glucose, mg/dL, median [IQR]160 [123–221]155 [121–214]0.102157 [122–212]155 [121–214]0.961 Potassium, mmol/L, median [IQR]4.30 [4.00–4.70]4.30 [3.90–4.70] < 0.0014.30 [4.00–4.70]4.30 [3.90–4.70]0.007 Sodium, mmol/L, median [IQR]136 [134–139]137 [133–139]0.563137 [134–139]137 [133–139]0.554 HbA1c (%), %, median [IQR]^b^6.9 [6.2–8.1]6.8 [6.1–8.0]0.1006.9 [6.1–8.0]6.9 [6.1–8.1]0.841 HbA1c(mmol/mol) median [IQR]^b^52.0 [43.5–64.0]49.0 [43.0–61.0]0.04250.0 [43.0–62.2]49.0 [42.0–60.0]0.206 Troponin, ng/L, median [IQR]^b^25.0 [13.8–42.6]21.0 [6.5–38.6] < 0.00125.8 [14.9–42.5]19.3 [6.5–36.0] < 0.001 LDL cholesterol, mg/dL, median [IQR]62 [45–85]73 [52–99] < 0.00163 [45–87]73 [53–99] < 0.001 HDL cholesterol, mg/dL, median [IQR]36 [9, 10, 22, 29–41]42 [33–53] < 0.00137 [9, 10, 22, 30–42]42 [33–52] < 0.001 TG, mg/dL, median [IQR]120.0 [88.0–169.0]123.0 [92.0–172.2]0.031118 [86.0–163.0]126 [94.0–179.0] < 0.001Vital signs upon admission Systolic BP, mmHg, mean ± SD138 (± 26)140 (± 27)0.004138 (± 25)140 (± 27)0.031 Diastolic BP, mmHg, mean ± SD75 (± 15)74 (± 15)0.00675 (± 15)74 (± 15)0.049 Pulse, beats/min, median [IQR]82 [71–95]82 [71–96]0.99282 [71–96]82 [71–95]0.548 Temperature, °C, median [IQR]36.8 [36.6–37.1]36.8 [36.6–37.0]0.67836.8 [36.6–37.1]36.8 [36.6–37.0]0.651ACS, acute coronary syndrome; ADHF, acute decompensated heart failure; AKI, acute kidney injury; BP, blood pressure; COPD, chronic obstructive pulmonary disease; CRP, C-reactive protein; CVA, cerebrovascular accident; eGFR, estimated glomerular filtration rate (using CKD-EPI equation); HDL, high density lipoprotein; PVD, peripheral vascular disease; LDL, low density lipoprotein; TG, triglycerides; TIA, transient ischemic stroke; WBC, white blood cells^a^AKI- acute kidney injury, was estimated as an increase in laboratory creatinine levels by > 0.3 mg/dL,^b^Troponin and Hba1C levels were available for 60.1% of men and 57.7% of women, and after matching for 60.5% of men and 58% of women and HbA1c levels were available in 16.5% of men and 16.8% of women and after matching in 15.8% of men and 16.9% of women
Glucose levels upon admission were not statistically different between women and men (p = 0.102), nor were HbA1c levels (p = 0.1, available for only 21.5% and 22.9% of patients, respectively).
In-hospital glucose control and hospitalization outcomes
During hospitalization, men suffered more often from hyperglycemic episodes (76.4% vs. 73.3%, p = 0.009), and severe hyperglycemic episodes (48.6% vs. 43.7%, p < 0.001) compared with women. Overall, women had more measurements in range during hospitalization (60% vs. 57.1%, p = 0.036). Rehospitalization after 1 month was higher in men – 12.8% vs. 11.1%, though this difference was not statistically significant (p = 0.088). There were no differences in mortality outcomes (Table 3; Figure 1). Table 3. In-Hospital glucose control and outcomes before and after matchingUnmatched cohortMatched cohortMen (n = 2845)Women (n = 2288)P-valueMen (n = 1755)Women (n = 1755)P-valueHypoglycemia^a^, n (%)378 (13.3%)320 (14.0%)0.467234 (13.3%)233 (13.3%) > 0.999Severe hypoglycemia^a^, n (%)144 (5.1%)136 (5.9%)0.16691 (5.2%)94 (5.4%)0.879Hyperglycemia^a^, n (%)2175 (76.4%)1676 (73.3%)0.0091340 (76.4%)1288 (73.4%)0.049Severe hyperglycemia^a^, n (%)1384 (48.6%)999 (43.7%) < 0.001842 (48.0%)776 (44.2%)0.031Measurements in range^a^ (%)57.1 [33.3–80.0]60.0 [36.1–80.0]0.03658.3 [35.4–80.0]60.0 [36.0–80.0]0.328Hospitalization Length (days), median [IQR]5 [4–9]6 [4–10]0.1236 [4–10]6 [4–9]0.459Rehospitalization 1 M, n (%)353 (12.7%)247 (11.1%)0.088229 (13.3%)194 (11.4%)0.061In hospital Mortality, n (%)64 (2.2%)66 (2.9%)0.15039 (2.2%)49 (2.8%)0.3371 M mortality, n (%)137 (4.8%)113 (4.9%)0.83884 (4.8%)83 (4.7%) > 0.999m-P value using McNemar after propensity score matching for: BMI, age, gender, steroid intake, COPD asthma, liver disease, chronic infection, HTN, CHF, IHD, Atrial fibrillation flutter, cardiac arrhythmias, PVD, dyslipidemia, past stroke TIA, dementia, and malignancy^a^Hypoglycemia ≤ 70 mg/dL, severe hypoglycemia ≤ 54 mg/dL, normal glucose values- 71–180 mg/dL, hyperglycemia 181 <, and severe hyperglycemia 250 < mg/dL Range- 100–180 mg/dL, 1M- 1 monthFig. 1Sex based disparities in the in-hospital glucose control and hospitalization outcomes
The association between sex and main hospitalization characteristics and outcomes
Men were treated more often with aspirin both in univariate analysis [OR 1.33 (95%CI 1.18–1.5), p < 0.001 and after adjustment in multivariable analysis [aOR 1.31 (95%CI 1.13–1.52) p < 0.001]. SGLT treatment was not more common in men after multivariable analysis aOR 1.25 (95%CI (0.94–1.64), p = 0.113]. Male sex was associated with hyperglycemia [OR 1.18 (95% CI 1.04–1.34), p = 0.008] and severe hyperglycemia [OR 1.22 (95%CI (1.09–1.36 p < 0.001)]. It remained independently associated with hyperglycemia [aOR 1.23 (95%CI 1.03–1.46 p = 0.02)] and severe hyperglycemia [aOR 1.28 (95% CI (1.09–1.49, p = 0.002)] after adjustment in multivariable analysis. 1-month rehospitalization rates tended to be higher in men [OR 1.16 (95% CI 0.97–1.38, p = 0.088] in univariate analysis, and became significant after adjustment in multivariable analysis [aOR 1.27 (95%CI 1.03–1.55, p = 0.02)] (Table 4). Table 4. The association between male sex and main hospitalization characteristics and outcomesOR (95%CI)P-valueaOR^c^ (95%CI)P-valueChronic medications Aspirin1.33 (1.18–1.50) < 0.0011.31 (1.13–1.52) < 0.001 Plavix1.59 (1.3–1.93) < 0.0011.29 (1.01–1.63)0.036 Statin1.15 (1.03–1.28)0.0101.10 (0.96–1.26)0.131 GLP1 agonist1.06 (0.83–1.37)0.6070.82 (0.61–1.11)0.201 SGLT2 inhibitor1.6 (1.27–2.02) < 0.0011.25 (0.94–1.64)0.113 Ace inhibitors1.33 (1.18–1.50) < 0.0011.31 (1.13–1.52) < 0.001In-hospital glucose control^a^ Hyperglycemia^a^1.18 (1.04–1.34)0.0081.23 (1.03–1.46)0.020 Severe hyperglycemia^a^1.22 (1.09–1.36) < 0.0011.28 (1.09–1.49)0.002 Hypoglycemia^a^0.94 (0.80–1.10)0.4671.11 (0.91–1.34)0.298 Severe hypoglycemia^a^0.84 (0.66–1.07)0.1661.05 (0.79–1.39)0.741Hospitalization outcomes Rehospitalization 1 M1.16 (0.97–1.38)0.0881.27 (1.03–1.55)0.020 In hospital mortality0.77 (0.54–1.09)0.1510.89 (0.60–1.32)0.558 30-day mortality0.97 (0.75–1.25)0.8381.15 (0.85–1.56)0.360 Mortality or prolonged stay^b^0.90 (0.80–0.99)0.0701.12 (0.97–1.29)0.119ACE, angiotensin converting enzyme; GLP-1, Glucagon-like peptide-1; SGLT2, sodium-glucose transport protein 2^a^Hypoglycemia ≤ 70 mg/dL, severe hypoglycemia ≤ 54 mg/dL, normal glucose values- 71–180 mg/dL, hyperglycemia 181 <, and severe hyperglycemia 250 < mg/dLRange- 100–180 mg/dL^b^Prolonged stay-hospitalization > 7 daysM- month^c^aOR adjusted odds ratio- adjusted for male sex, age and variables with p < 0.1 using a stepwise forward regression analysis
Matched cohorts
Study population – matched cohort
The matched cohort consisted of two similar groups, comprising 1,755 men and women (Table 1 and Supplementary Table S3). Men had higher rates of CKD (16.3% vs. 13.2%, p = 0.012) and women had higher rates of connective tissue disease (4.8% vs. 1.4%, p < 0.001). Men were more frequently treated with aspirin (34.7% vs. 29.3%, p < 0.001) and SGLT2 inhibitors (7.7% vs. 5.5%, p = 0.013). LDL levels were higher in women (median 73 mg/dL vs. 63 mg/dL, p < 0.001) despite similar statin use.
The cause of admission differed between men and women: Acute infection was more common in men than in women (33.3% vs. 29.7%, p = 0.019). Chest pain and ACS were also more common in men (16.7% vs. 13.7%, p = 0.016, and 24.5% vs. 20.7%, p = 0.002, respectively), which was manifested in higher troponin levels in men (25.8 ng/L vs. 19.3 ng/L p < 0.001). Women were more often diagnosed with pulmonary embolism (1.7% vs. 0.8%, p = 0.031).
In-hospital glucose control and hospitalization outcomes
During hospitalization, men suffered more often from hyperglycemic episodes (76.4% vs. 73.4%, p = 0.049), and severe hyperglycemic episodes (48% vs. 44.2%, p = 0.031) compared with women. Overall, women had more measurements in the desirable range during hospitalization (60% vs. 57.1%, p = 0.036). Rehospitalization after 1 month was higher in men (13.3% vs. 11.4%), though this difference was not statistically significant (p = 0.061). No significant differences in mortality were observed post-matching (Table 3; Figure 1).
Discussion
This study highlights sex-based differences in hospitalized patients with T2DM, particularly in baseline cardiovascular risk, chronic treatment patterns, glycemic control, and hospitalization outcomes. Men had a higher burden of cardiovascular disease (IHD, CKD, and PVD) and were more frequently prescribed cardioprotective medications (statins, aspirin, and SGLT2 inhibitors). Ischemic complications were a more common cause of hospitalization in men. Importantly, male sex was independently associated with worse outcomes, including an increased risk of hyperglycemia, severe hyperglycemia, and 1-month rehospitalization.
Hyperglycemia during hospitalization is related to worse outcomes across a range of clinical conditions, in both diabetic and non-diabetic patients [27–29]. However, the interaction between sex and hyperglycemia-related outcomes remains less clearly defined. For example, in patients hospitalized with acute coronary syndrome, admission hyperglycemia was independently associated with increased mortality in men but not in women [30, 31]. Conversely, another study reported that elevated HBA1c levels were associated with rehospitalization in women with CVD but not in men [32].
In our study, men experienced a higher frequency of hyperglycemia events during hospitalization. In general, in-hospital treatment protocols do not differ between men and women and typically involve initiating insulin treatment when blood glucose levels are > 180 mg/dL in ≥ 2 measurements, using weight-based dosages. Despite this standardized approach, previous studies suggest that glycemic control may differ between hospitalized men and women with diabetes. For example, a study focusing on anthropometric and body composition measurements found men to have higher blood glucose fluctuations [33]. Sex hormones play a key role in glucose regulation and may contribute to these differences. Testosterone deficiency in older men is related to metabolic syndrome, visceral adiposity and increased insulin resistance [34], while androgen excess in women is related to increased risk of diabetes. Elevated levels of sex hormone-binding globulins appear to have a protective effect, particularly in women [35]. In contrast, a clinical study of critically ill patients reported greater insulin resistance in women than in men, highlighting the variability of sex-based metabolic responses under different physiological conditions [22].
Beyond hospitalization characteristics and outcomes, our study also revealed sex-based differences in chronic treatment, co-morbidities and reasons for acute admission. Notably, men were more likely to receive cardioprotective therapies, such as antiplatelet agents, even after propensity score matching and multivariable adjustment. Previous studies have shown that men with diabetes are more likely than women to receive guideline-directed treatment for cardiovascular risk and complications [7–9].
It is well established that treatment with SGLT2 inhibitors reduces the risk of major cardiovascular events and all-cause mortality in patients with T2DM when added to standard care [36, 37]. Accordingly, current diabetes treatment guidelines recommend SGLT2 as a standard therapy for adults with T2DM and established or high risk of atherosclerotic cardiovascular disease, HF, or CKD [38]. A large meta-analysis, found no significant sex differences in HbA1c reduction or major adverse cardiovascular outcomes (MACE) with either SGLT2 inhibitors or GLP1 agonists [39]. Consistent with previous research, this study demonstrates low overall SGLT2 inhibitors or GLP1 agonists treatment. However, men were more frequently prescribed with SGLT2 inhibitors than women [OR 1.39 (95%CI 1.061–1.828), p = 0.0169]. Similar results were reported in a large retrospective study involving 934,737 patients, where women were less likely than men to receive SGLT2 inhibitors; aOR, 0.84; 95% CI, 0.82–0.85 [9].
Statins have the same effectiveness in men and women with similar cardiovascular risk factors [40]. Yet, women used statins less often than men (RR 0.90; 95% CI 0.86, 0.93) [10]. In our study, women had higher LDL levels (p < 0.001) and men were more often chronically treated with statins (p = 0.011), though this was not significant after matching and multivariable regression.
Women have lower in-hospital mortality rate than men for a wide variety of medical conditions, both infectious [41] and non-communicable diseases [40]. Yet, diabetic women have similar or even higher mortality rates compared to men [42]. This was also demonstrated in our study, though we could not address the causes of death. Treatment disparities may partly explain the lack of observed sex-based differences in mortality.
Study limitations
This retrospective, large-scale study has inherent limitations due to its observational nature and is subject to residual confounding. We relied on coded data, and it is possible that some information was not recorded. For example, physicians may not have coded all the medications a patient received or all comorbid conditions. Nevertheless, such underreporting is unlikely to differ between men and women. Therefore, if present, it would most likely attenuate the observed association (i.e., non-differential misclassification bias). Glucose levels were assessed using point-of-care measurements rather than continuous glucose monitoring (CGM), which is currently being evaluated in ongoing studies [40]. CGM offers advantages, particularly in detecting hypoglycemia, including nocturnal events, which may differ by sex and are difficult to capture with routine measurements.
[43] Since our study had limited number of glucose measurements, a native-binomial regression model with length of stay in the denominator could have provided additional information. However, since the duration of hospitalization did not differ significantly between men and women, both before and after matching, and given that the current sample size provides high power to detect even small differences in length of stay, we can assume that the occurrence of an event is likely unrelated to the duration of hospitalization.
Additionally, Shamir Medical Center serves a highly heterogeneous population with diverse religious, cultural, and socioeconomic backgrounds. Data on these variables were not systematically available and could not be incorporated into the current analyses. Therefore, potential interactions between these factors and sex on diabetes outcomes could not be evaluated.
Finally, the follow-up was limited to 30 days and different sex related outcomes may appear with longer follow up. Further research should explore sex-specific responses to inpatient glucose management interventions.
Conclusion
Our findings support the development of hospital protocols that integrate sex-specific glucose monitoring strategies and equitable medication prescribing practices. Since men are more prone to hyperglycemia, they may require closer monitoring and more aggressive insulin adjustment during hospitalization.
In addition, optimizing guideline-directed cardioprotective therapy, especially in women, is crucial. Given the persistent sex gap in statin and SGLT2 inhibitor prescriptions, further efforts are needed to ensure equitable treatment.
Supplementary Information
Below is the link to the electronic supplementary material.Supplementary file1 (DOCX 39 KB)
The reference list from the paper itself. Each links out to its DOI / PubMed record.
- 1ATLAS- A Unified Interface for the OHDSI Tools. Observational Health Data Sciences and Informatics. Available online: https://www.ohdsi.org/software-tools.