3D imaging‐based AI models outperform demographic models and excel in tibial sizing compared with 2D models in total knee arthroplasty planning: A systematic review
Randa Elsheikh, Zainab Aqeel Khan, George Mihai Avram, Rolf Huegli, Andrej M. Nowakowski, Michael T. Hirschmann

TL;DR
AI models using 3D imaging outperform demographic models and are more accurate for tibial sizing in knee replacement planning compared to 2D models.
Contribution
This study systematically compares AI models for TKA implant sizing, showing that 3D imaging-based models excel in tibial sizing.
Findings
3D imaging AI models outperformed demographic models in predicting tibial component sizes.
Multimodal AI models achieved high accuracy across all component predictions.
Demographic-only models had significantly lower accuracy compared to imaging-based models.
Abstract
Accurate preoperative implant sizing is a critical component of successful total knee arthroplasty (TKA). Artificial intelligence (AI) has emerged as a promising tool for enhancing preoperative planning. This is achieved through predictive modelling based on different input modalities, including computed tomography (CT), plain radiographs and patient demographic data. Despite growing interest, the comparative performance of these models remains unclear. This systematic review aims to evaluate and compare the predictive accuracy of AI‐based models for TKA component sizing across different input modalities. A systematic literature search was conducted in PubMed, Scopus, Embase and Cochrane Central following the Preferred Reporting Items for Systematic Reviews and Meta‐Analyses guidelines. Eligible studies included original research that developed or validated AI models for predicting…
Genes, proteins, chemicals, diseases, species, mutations and cell lines named across the full text — each resolved to its canonical identifier and authoritative record.
Click any figure to enlarge with its caption.
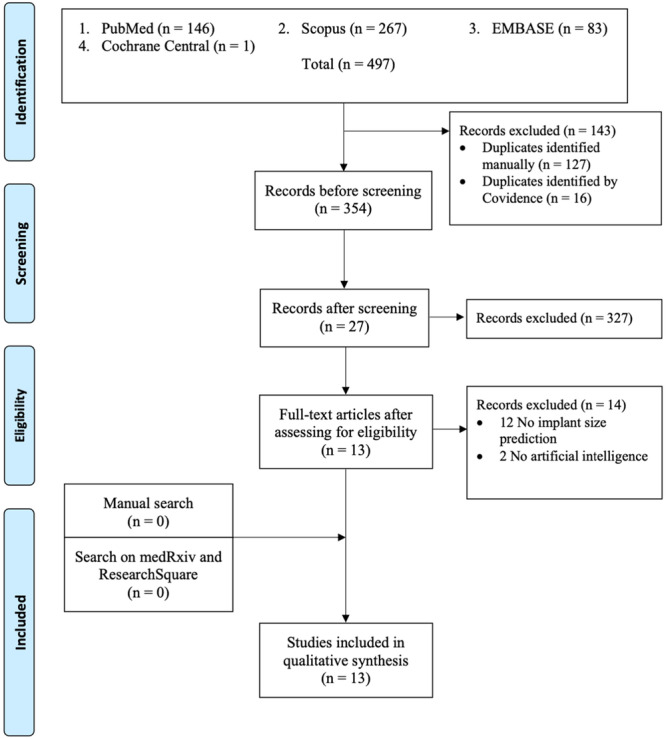 Figure 1
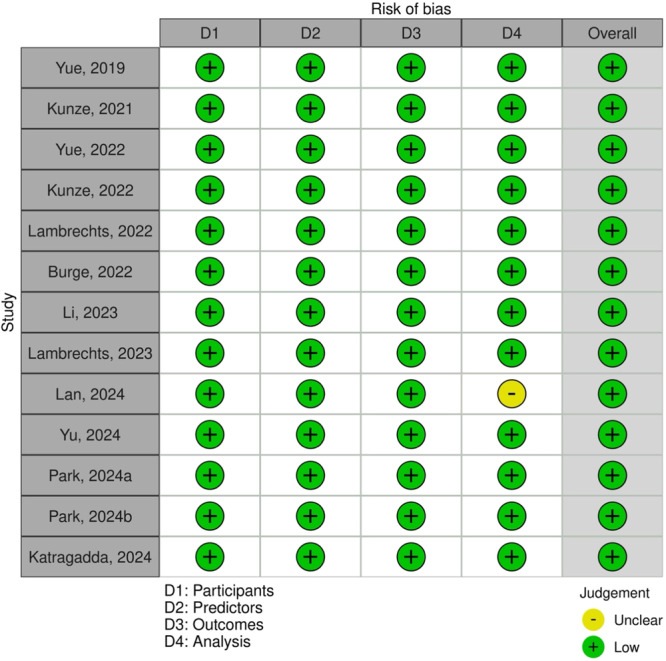 Figure 2
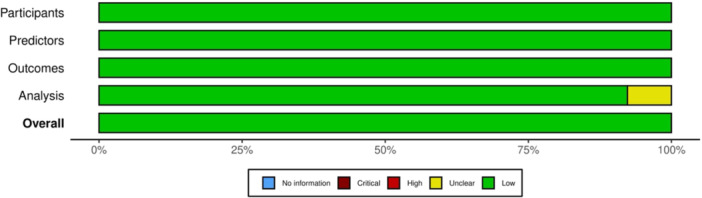 Figure 3
| Author, year | Country | Study design | Level of evidence | Sample size | Male | Female | Average age (years) | Body mass index (kg/m2) |
|---|---|---|---|---|---|---|---|---|
| Yue, 2019 [ | China | Retrospective validation | III | 308 | 69 (22.4%) | 239 (77.6%) | NR | NR |
| Kunze, 2021 [ | United States | Retrospective cohort | III | 17,283 | 7421 (42.9%) | 9862 (57.0%) | 66.3 ± 9.4 | 31.9 ± 6.4 |
| Yue, 2022 [ | China | Retrospective cohort | III | 308 | 68 (22.0%) | 240 (77.9%) | NR | NR |
| Kunze, 2022 [ | United States | Retrospective cohort | III | 11,777 | 5305 (45.0%) | 6472 (55.9%) | 66.5 ± 9.5 | 31.2 ± 5.6 |
| Lambrechts, 2022 [ | Belgium | Retrospective validation | III | 5409 | NR | NR | NR | NR |
| Burge, 2022 [ | United Kingdom | Retrospective validation | III | 78 | 33 (42.3%) | 45 (57.7%) | 62.5 ± 3.74 | NR |
| Li, 2023 [ | China | Retrospective case‐control | III | 42 | 14 (33.3%) | 6 (14.2%) | 67.95 ± 5.65 | 25.11 ± 3.53 |
| Lambrechts, 2023 [ | Belgium | Retrospective cohort | III | 446 | NR | NR | NR | NR |
| Lan, 2024 [ | China | Retrospective cohort | III | 30 | 10 (33.3%) | 20 (66.6%) | 69.10 ± 5.98 | 25.63 ± 3.00 |
| Yu, 2024 [ | South Korea | Retrospective cohort | III | 714 | NR | NR | NR | NR |
| Park, 2024 [ | South Korea | Retrospective validation | III | 234 | 43 (18.3%) | 191 (81.6%) | 71.5 ± 5.9 | NR |
| Park, 2024 [ | South Korea | Retrospective cohort | III | 81 | 9 (11.1%) | 63 (77.7%) | 72.0 ± 7.6 | 26.16 ± 4.9 |
| Katragadda, 2024 [ | United Kingdom | Retrospective validation | III | 292 | NR | NR | NR | NR |
| Author, year | Data sources | Model | Algorithm | Planning modality | Segmentation technique | Technique specificity | Implant specificity |
|---|---|---|---|---|---|---|---|
| Yue, 2019 [ | Local database | DL | ResNet | X‐ray and demographic data (mixed model) | Contrast‐limited adaptive histogram | NR | No |
| Kunze, 2021 [ | Local database | ML | SGB, RF, SVM, XGB, ENPLR | Demographic data | NA | NR | Zimmer Biomet, Corentec, DJ Orthopaedics, Exactech, DePuy Synthes, Stryker, Wright prostheses |
| Yue, 2022 [ | Local database | DL | CNN, ECOC, ResNet | X‐ray and demographic data (mixed model) | Contrast‐limited adaptive histogram | NR | Domestic AK posterior stable prostheses |
| Kunze, 2022 [ | Local database | ML | SVM, RF, SGB, ENPLR, XGB | Demographic data | NA | NR | Triathlon (Stryker) |
| Lambrechts, 2022 [ | Local database | ML | SVR, LAD‐SVR, MTL, Lasso, Group Lasso | CT and MRI | NR | PSI, Navigation, RAS | Vanguard (Zimmer Biomet), Persona (Zimmer Biomet), NexGen (Zimmer Biomet) |
| Burge, 2022 [ | OAI and KISTI | ML | U‐Net CNN, PDM, SSM | X‐ray | U‐Net CNN | NR | NexGen (Zimmer Biomet), SIGMA (DePuy Synthes), Legion (Smith & Nephew), Freedom (Maxx Orthopedics), Scorpio (Stryker) |
| Li, 2023 [ | Local database | AI | 3D U‐Net, HRNet | CT | 3D U‐Net, BN, ReLU | PSI | No |
| Lambrechts, 2023 [ | Local database | ML | Group Lasso, Elastic Net Linear Regression | MRI | Semi‐automatic segmentation, marching cubes algorithm for surface mesh conversion | NR | PS Vanguard (Zimmer Biomet) |
| Lan, 2024 [ | Local database | AI | G‐NET NN | CT | G‐NET NN | NR | DePuy Synthes prostheses |
| Yu, 2024 [ | Local database | DL | ResNet, SGD | X‐ray | NR | NR | PS NexGen (Zimmer Biomet) |
| Park, 2024 [ | Local database | DL | YOLO, CNN | X‐ray | YOLO | NR | PS and CR Triathlon (Stryker) |
| Park, 2024 [ | Local database | DL | CNN, HRNet | X‐ray | CNN | NR | CR Triathlon (Stryker) |
| Katragadda, 2024 [ | NR | ML | Linear regression | CT | Active appearance model | Conventional TKA, CAS, RAS, Navigation | PS and CR Triathlon (Stryker) |
| Author, year | Planning modality | Input variables | Output variables |
|---|---|---|---|
| Yue, 2019 [ | X‐ray and demographic data (mixed model) | AP and lateral radiographs, sex, height, weight | Exact femoral and tibial component sizes |
| Kunze, 2021 [ | Demographic data | Age, height, weight, BMI, sex | Exact, ±1 size, ±2 size femoral and tibial component size |
| Yue, 2022 [ | X‐ray and demographic data (mixed model) | AP and lateral radiographs, sex, height, weight | Exact femoral and tibial component size |
| Kunze, 2022 [ | Demographic data | Age, height, weight, BMI, sex | Exact, ±1 size, ±2 size femoral and tibial component sizes |
| Lambrechts, 2022 [ | CT and MRI | Landmark locations, measurements (femoral notching, mediolateral femoral implant overhang, tibial underhang/overhang), DOFs in MPPs, shape coefficients from SSM | DOFs of the surgeon corrected preoperative plan (including exact femoral and tibial implant sizes) |
| Burge, 2022 [ | X‐ray | AP and lateral radiographs | Exact, ±1 size femoral and tibial component sizes |
| Li, 2023 [ | CT | Centre of the femoral head, intercondylar fossa, medullary midpoint of the femur and tibia | Exact, ±1 size, ±2 size femoral and tibial component sizes, implant positioning (outlier of LDFA, outlier of MPTA, outlier of HKA, outlier of LDFA ≤ 3°, outlier of MPTA ≤ 3°, outlier of HKA ≤ 3°) |
| Lambrechts, 2023 [ | MRI | 3D femoral bone mesh vertex coordinates | Exact, ±1 size femoral component size |
| Lan, 2024 [ | CT | NR | Exact femoral and tibial component sizes, femoral valgus correction angle, HKA |
| Yu, 2024 [ | X‐ray | AP and lateral radiographs | Exact femoral and tibial component sizes |
| Park, 2024 [ | X‐ray | AP radiographs | Exact, ±1 size femoral and tibial component sizes |
| Park, 2024 [ | X‐ray | AP and lateral radiographs | Exact, ±1 size femoral and tibial component sizes |
| Katragadda, 2024 [ | CT | NR | Exact, ±1 size femoral and tibial component sizes |
| Performance metrics | 3D CT/MRI | 2D x‐ray | Demographic | Mixed |
|---|---|---|---|---|
| Accuracy | ||||
| Femur | ||||
| Exact | 79.98% | 86.7% | 45.72% | 86.27% |
| ±1 size | 97.67% | 96.35% | 92.35% | ‐ |
| ±2 size | 100.00% | ‐ | 99.10% | ‐ |
| Tibia | ||||
| Exact | 83.98% | 83.57% | 52.25% | 85.29 |
| ±1 size | 98.49% | 96.89% | 94.91% | ‐ |
| ±2 size | 100.00% | ‐ | 99.07% | ‐ |
| Error metrics | ||||
| Femur | ||||
| AUC | ‐ | 0.84 | ‐ | ‐ |
| MAE (mm) | 0.52 | ‐ | 1.68 | ‐ |
| RMSE (mm) | ‐ | 1.13 | 2.38 | ‐ |
| Max over/underhang (%) | ‐ | 71.79% | ‐ | ‐ |
| Tibia | ||||
| AUC | ‐ | 0.89 | ‐ | ‐ |
| MAE (mm) | 0.39 | ‐ | 1.68 | ‐ |
| RMSE (mm) | ‐ | 1.36 | 2.43 | ‐ |
| Max over/underhang (%) | ‐ | 72.82% | ‐ | ‐ |
| Computational efficiency | ||||
| Time to segmentation (min) | 2.49 ± 1.25 | NA | NA | NA |
| Time to component planning (min) | 5.98 ± 1.30 | 0.81 ± 0.03 | ‐ | ‐ |
| Time to PSI design (min) | 35.10 ± 3.98 | ‐ | ‐ | ‐ |
| Time to PSI printing [ | 19.86 ± 2.44 | ‐ | ‐ | ‐ |
Peer Reviews
No public reviews on file for this paper yet. If you reviewed it on a platform where reviews are public (OpenReview, ICLR, NeurIPS, ICML), you can paste yours below so the community can read it here.
Videos
No videos yet. Explain this paper in a talk, walkthrough, or lecture? Add one.
Taxonomy
TopicsTotal Knee Arthroplasty Outcomes · Orthopedic Infections and Treatments · Artificial Intelligence in Healthcare and Education
INTRODUCTION
Despite the pain and function, long‐term outcomes are closely linked to the precision of component positioning and sizing, with inaccurate sizing often being associated with reduced patient satisfaction and suboptimal joint kinematics, often leading to early revision [2, 44, 46].
To anticipate final component size, plan bone resections and assess alignment strategies, preoperative templating has traditionally been used by surgeons in TKA [25]. Currently, two‐dimensional (2D) radiographic templating using plain anteroposterior and lateral radiographs remains the most commonly used technique owing to its accessibility and low cost [38]. However, this approach is inherently limited by its inability to fully capture the three‐dimensional (3D) anatomy of the knee and is subject to magnification errors and operator‐dependent variability [41].
To improve accuracy, modern planning techniques such as patient‐specific instrumentation (PSI) have been introduced. These systems use morphometric data derived from preoperative computed tomography (CT) scans to generate a personalized surgical plan [45]. Despite the theoretical advantages of PSI, studies have reported discordance between predicted and implanted component sizes. Digital templating using plain radiographs has been shown to result in templating‐implant mismatches in up to 48% of femoral and 55% of tibial components [1, 47]. Even with PSI platforms, disagreement rates of up to 51.1% between the manufacturer's plan and the final implant size, and 26.6% between the manufacturer's and surgeon's plan, have been reported [8]. These mismatches may lead to inefficient instrument tray usage, increased operative time and higher costs, particularly in settings with limited implant inventory [7].
Artificial intelligence (AI) has emerged as a promising solution to the limitations of traditional templating. With applications spanning image segmentation, anatomical landmark detection and predictive analytics, AI has demonstrated strong potential in enhancing surgical planning [3]. In the setting of TKA, AI models have been developed to predict optimal implant sizes based on diverse planning modalities, including demographic features [20], 2D radiographic measurements [5] and 3D imaging data such as CT and magnetic resonance imaging [9, 24]. These models utilize machine learning (ML) and deep learning (DL) models to capture complex, non‐linear relationships between input features and implant sizing decisions [13, 21, 32, 33, 34, 42].
While individual studies have reported encouraging results [5, 17, 22, 24], a systematic synthesis of the predictive performance and clinical applicability of AI‐based implant sizing models in TKA is lacking. Importantly, it remains unclear how planning modality influences predictive accuracy and whether the added complexity of the computational demands of 3D imaging‐based models yields clinically meaningful improvements.
The aim of this systematic review is to evaluate and compare the performance of AI‐based models for preoperative implant size prediction in TKA. Specifically, model accuracy in predicting exact, ±1 and ±2 size matches for femoral and tibial components across different input modalities is assessed. Secondary objectives include the evaluation of computational efficiency, error metrics and comparison with human‐level predictions. It was hypothesized that AI models trained on 3D imaging data demonstrate superior predictive accuracy across all thresholds compared to those based on 2D radiographic or demographic data.
MATERIALS AND METHODS
Search strategy and eligibility criteria
This systematic review was conducted in alignment with the Preferred Reporting Items for Systematic Reviews and Meta‐Analyses 2020 guidelines [35] and was prospectively registered on the PROSPERO database (registration number: CRD420251007783). A structured literature search was conducted across four electronic databases: PubMed, Embase, Scopus and Cochrane Central Register from database inception to March 2025, with the prospective inclusion of in‐press online publications.
The search strategy combined terms related to AI (including ‘artificial intelligence’, ‘AI’, ‘machine learning’, ‘ML’, ‘deep learning’, ‘DL’, ‘neural network’ and ‘computational’) with terms related to knee arthroplasty (‘total knee arthroplasty’, ‘TKA’, ‘total knee replacement’, ‘TKR’, ‘total joint arthroplasty’ and ‘total joint replacement’) and planning‐specific keywords (‘planning’, ‘component size’, ‘implant size’, ‘implant sizing’, ‘component sizing’, ‘templating’ and ‘size’). The full applied search strategy is provided in Table S1.
Studies were included if they were original articles that developed or validated AI models for preoperative implant size prediction in TKA and reported measurable performance outcomes. Exclusion criteria included studies not conducted on human subjects, lack of explicit reference to TKA, no report of model performance metrics and non‐original studies like reviews, conference abstracts, book chapters or editorials.
Following duplicates removal, title and abstract screening, and full‐text screening were conducted by two independent reviewers using Covidence systematic review software (Veritas Health Innovation Ltd.). Any discrepancy during the screening process was resolved by consensus.
Data extraction
Data extraction was performed independently by two reviewers using a pre‐standardized extraction form. Disagreements were resolved by discussion. Extracted information included study design, country of origin, total sample size, patient age, sex distribution, body mass index (BMI) and laterality of the assessed knee.
Model‐related data included the source of the trained data, AI methodology (e.g., ML, DL or CNN), algorithm type, primary planning modality (e.g., CT, radiography or demographic‐based) and validation approach (internal or external). Additional variables included segmentation technique, anatomical landmark identification method, device or implant specificity, and whether the model had been clinically integrated. Key extracted outcome measures included model accuracy for femoral and tibial implant sizing. When reported, computational metrics such as average segmentation time, AI‐based component prediction time, patient‐specific implant (PSI) design time and total time from imaging to PSI printing were extracted.
Missing or non‐numeric data were treated as unavailable and excluded from numerical analyses.
Outcome measures
The primary outcomes of interest were the predictive accuracy of AI‐based models in estimating femoral and tibial implant sizes for preoperative TKA planning. Accuracy was assessed at three thresholds for each component: exact size match, prediction within ±1 size, and within ±2 sizes. Secondary performance metrics included the area under the receiver operating characteristic curve (AUC), mean absolute error (MAE), root‐mean‐squared error [16] and variant RMSE for predictions within ±1 size. When available, models were also evaluated for overhang/underhang prediction accuracy, including maximum correct prediction and prediction within ±1 size of correct over‐ or under‐sizing.
Ground truth determination methods were recorded to assess the reference standard against which model performance was evaluated. Additionally, comparisons with human‐level predictions were extracted when reported.
For analytical clarity, outcomes were stratified by the model's primary input modality: 3D imaging‐based models (CT or MRI), 2D radiography‐based models and models relying on demographic or clinical data alone.
Study quality, bias and characteristics
The methodological quality and risk of bias for each included study were assessed using the Prediction model Risk Of Bias ASsesment Tool (PROBAST) [49]. PROBAST is a validated framework specifically designed to assess the quality of studies that develop, validate or update multivariable prediction models. Four key domains are assessed: participants, predictors, outcomes and analysis. Each domain contains specific signalling questions that guide the assessment of whether the study design, data collection and analytical methods could introduce systematic bias into the model's development and validation. Based on the responses, each domain is rated as having low, high or unclear risk of bias.
Statistical analysis and data synthesis
Data synthesis was performed using descriptive statistical methods. Continuous variables were summarized using means and standard deviations, and categorical variables were described using frequencies and percentages. Data entries labelled as not reported or expressed in non‐numeric terms were excluded from quantitative synthesis.
Due to heterogeneity in model architectures, data modalities and reporting practices, formal meta‐analysis could not be performed. Instead, a structured qualitative synthesis was undertaken, with subgroup comparisons based on the planning approach. Computational performance metrics and model accuracies were compared across modalities where sufficient data were available.
All results were presented in tabular format to ensure clarity and facilitate cross‐study comparison. Data processing and visualization were conducted using Microsoft Excel (version 16.54, Microsoft Corporation).
RESULTS
Study characteristics
Of the 497 screened articles, a total of 13 studies met the eligibility criteria and were included in the final analysis (Figure 1). Based on the primary input modality used for model development, four studies utilized 3D imaging (CT or MRI) [17, 22, 23, 27], four relied on 2D radiographs [5, 36, 37, 50], two used demographic data [19, 20] and two combined demographic and radiographic data (mixed models) [51, 52].
PRISMA flow diagram showing the study selection process. PRISMA, Preferred Reporting Items for Systematic Reviews and Meta‐Analyses.
The total number of patients used for model training and validation across all studies was 37,002. The average age across the entire data set was 67.98 ± 3.04 years, and the pooled average BMI was 28.00 ± 2.93 kg/m^2^. Sex distribution was reported in most studies, with 17,138 females (46.31%) and 12,972 males (35.05%). Regarding laterality of the training data source, 355 (0.95%) left and 341 (0.92%) right knees were assessed. Further details about the included studies are provided in Table 1.
Risk of bias
Risk of bias was assessed using the PROBAST tool across four domains: participants, predictors, outcomes and analysis. All 13 included studies were rated as low risk in the participants, predictors and outcomes domains. Twelve studies [5, 17, 19, 20, 22, 23, 27, 36, 37, 50, 51, 52] were rated as low risk of bias in the analysis domain, while one study [24] had an unclear risk due to insufficient reporting of statistical methods but was retained given its methodological relevance and contribution to the evidence base. Overall, all included studies were judged to have a low risk of bias (Figures 2 and 3), suggesting a high methodological quality among the assessed studies.
Overall risk of bias in the included studies assessed using the PROBAST tool. Green represents a low risk of bias, and yellow represents unclear risk. PROBAST, Prediction model Risk Of Bias ASsesment Tool.
Domain‐specific risk of bias of the included studies assessed using the PROBAST tool. Green represents a low risk of bias, and yellow represents unclear risk. PROBAST, Prediction model Risk Of Bias ASsesment Tool.
Model characteristics
Substantial variation in data sources, AI structure, input modalities and clinical applications was present in the included studies. Most models were developed using institutional data sets, incorporating preoperative CT or MRI scans, standard radiographs and patient demographic data.
In terms of model architecture, six studies employed ML models [5, 17, 19, 20, 22, 23], five utilized DL models (primarily CNN‐based) [36, 37, 50, 51, 52] and two described broader AI approaches [24, 27]. Segmentation techniques ranged from fully automated CNN‐based methods to semi‐automated workflows. Landmark identification was achieved via neural networks in most models, though manual annotation was used in some.
Clinical integration varied across studies: several models were intended for PSI, surgical navigation, augmented or robotic‐assisted surgery, or standalone applications for preoperative templating and surgical planning. Similarly, several models were trained on implants from a single manufacturer [17, 20, 22, 24, 36, 37, 50, 51], while others incorporated components from several manufacturers and were, therefore, non‐device specific (Table 2).
Model validation was primarily internal, employing training/validation/test splits, k‐fold cross‐validation or retrospective comparisons within the training population. Only one study conducted external validation on a separate data set of patients who had undergone TKA [37].
Models were trained using a variety of imaging and non‐imaging inputs, with demographic and radiographic‐based models relying on a low number of variables and 3D‐based imaging models incorporating substantially higher input dimensionality, with one model using 149 features and another employing 22,476 variables [22, 23]. Output targets also differed by modality. While demographic‐based models generally predicted two output variables, 3D imaging‐based models ranged from predicting a single implant size to up to 14 surgical parameters, including implant dimensions, positioning and alignment metrics. Details about the input and output variables used to train the evaluated models are provided in Table 3.
Prediction accuracy
Model accuracy varied across planning modalities and implant components (Figure S1). For the femoral component, exact size prediction accuracy was highest for x‐ray‐based models at 86.70%, closely followed by models combining radiographs and demographic data (86.27%) and 3D CT/MRI‐based models (79.98%). Demographic‐only models demonstrated substantially lower exact accuracy at 45.72%. Accuracy within ±1 bucket size remained high across modalities, with CT/MRI achieving 97.67%, x‐ray 96.35% and demographic models 92.35%. ±2 size accuracy reached 100% for CT/MRI models and 99.10% for demographic data. No ±2 size data were reported for mixed or x‐ray‐based models.
For the tibial component, exact size accuracy was comparable between mixed models (85.29%), CT/MRI (83.98%) and x‐ray (83.57%), with demographic data displaying lower prediction accuracy at 52.25%. ±1 size accuracy exceeded 94% for all modalities, with models based on CTs and MRIs displaying the highest prediction accuracy at 98.49%, followed by x‐ray‐based models (96.89%) and demographic‐based models (94.91%). ±2 size tibial accuracy was reported only for models utilizing 3D CT/MRI (100%) and demographic data (99.07%) (Table 4).
Prediction error metrics
Error metrics were primarily available for demographic‐ and CT/MRI‐based models (Table 4). MAE was lowest in 3D imaging‐based models (femur: 0.52 mm; tibia: 0.39 mm) as compared to demographic models (1.68 mm for both components). Root‐mean square error [16] was 2.38 mm (femur) and 2.43 mm (tibia) for demographic data, and substantially lower for x‐ray‐based models (1.13 mm femur, 1.36 mm tibia); RMSE data were not available for CT/MRI‐based models or mixed models. Maximal over‐ or underhang correction accuracy was reported only in one study (femur 71.79%, tibia 72.82%) [5].
Computational efficiency
Computational efficiency was only reported in three studies [17, 27, 37]. For CT‐based AI models, segmentation required on average 2.49 ± 1.25 min. Component planning times differed substantially, with CT‐based planning taking on average 5.98 ± 1.30 min compared to 0.81 ± 0.03 min for x‐ray‐based models, rendering 2D models planning approximately 7.4 times faster. AI‐based PSI design time in models using CTs took 35.10 ± 3.98 min, with a total processing to printing time of 19.86 ± 2.44 h (Table 4).
Ground truth determination
Ground truth determination differed across studies depending on the input modality. Among CT/MRI‐based models, one study relied on 3D planning performed jointly by an engineer and surgeon, with independent verification by two blinded physicians using acetate templating on preoperative radiographs [27]. In other studies, ground truth was defined either by the actual prosthesis sizes used intraoperatively, surgeon‐corrected preoperative plans or sizes planned by a single experienced surgeon [17, 22, 23, 24].
In x‐ray‐based models, ground truth definitions included intraoperative sizing trials, actual implant sizes recorded in post‐operative surgical documentation [36, 37, 50], and, in one model, the best‐fit ground truth size was retrospectively calculated based on the lowest error relative to the patient's 3D MRI‐derived bone model [5].
For demographic‐based models, ground truth implant sizes were extracted from automated inventory systems, capturing the final femoral and tibial component sizes implanted during surgery [19, 20].
In mixed models, ground truth was based on surgical records of the actual implanted prosthesis size, as documented in operative reports or inventory systems [51, 52].
Comparison with human‐level prediction
CT/MRI‐based AI models consistently outperformed manufacturer default plans and manual templating techniques, with several studies reporting significantly higher accuracy and improved outlier rates in alignment metrics [17, 22, 23, 24, 27]. Similarly, x‐ray‐based models achieved higher implant size prediction accuracy than surgeons, showing a stronger correlation with actual implant size [5, 36, 37, 50]. Demographic‐only models were generally less accurate in exact sizing but performed well in ±1 and ±2 size accuracy, approaching or exceeding conventional planning methods in some cases [19, 20]. Mixed‐input models (combining imaging and demographic data) matched or surpassed the accuracy of experienced surgeons and outperformed baseline and traditional planning approaches [51, 52].
DISCUSSION
The most important findings of this study were that AI‐based models using imaging modalities, particularly plain radiographs and CT/MRI, achieved the highest accuracy in preoperative TKA implant sizing. While x‐ray‐based models showed the highest exact femoral sizing accuracy, CT/MRI‐based models showed superior accuracy within ±1 and ±2 thresholds for both femoral and tibial components. In contrast, demographic‐only models yielded substantially lower exact accuracy (45%–52%), though they maintained acceptable performance within broader sizing margins. Notably, plain radiograph‐based models also demonstrated significantly greater computational efficiency, with planning times up to seven times faster than CT‐based models. Integration of imaging‐based AI planning into clinical practice has the potential to minimize component misalignment and decrease intraoperative adjustments. By reducing operative variability and improving preoperative planning protocols, these models may contribute to improved patient outcomes and more efficient allocation of operative resources.
These findings are consistent with previous research indicating that CT‐based 3D templating methods consistently outperform conventional 2D radiograph‐based methods in preoperative TKA planning [10, 18, 39]. Specifically, studies evaluating 2D digital templating report exact implant size match rates ranging from 34% to 65% for both femoral and tibial components [12, 30, 41], while 3D templating achieves substantially higher accuracy, with exact matches between 80% and 96%, and near‐perfect prediction within one size increment [26, 28, 39].
Demographic data, such as height, weight and sex, have also been explored as predictors of implant size, given the established correlation with femoral component dimensions [43]. However, consistent with the current review, demographic‐only models have shown limited precision, with exact prediction accuracies ranging from 43% to 54% [29, 48]. The lower dimensionality and lack of anatomical context may explain their inferior precision, despite acceptable performance in broader size ranges. Notably, in line with our findings, combining demographic data with plain radiographs has demonstrated improved performance, supporting the potential utility of multimodal input strategies for enhancing preoperative planning accuracy [43].
AI has emerged as a transformative tool in preoperative TKA planning, enabling consistent, data‐driven and personalized surgical strategies [3]. Evidence shows that AI‐based planning models, particularly those utilizing CT imaging, outperform traditional templating in predicting femoral, tibial and liner component sizes, while also reducing operative time by up to 40%, decreasing intraoperative blood loss, improving lower limb alignment and accelerating early post‐operative recovery [11, 31]. Hiraoka et al. further demonstrated that AI‐driven robotic‐assisted workflows, combined with lean principles such as optimizing operating room setup, staffing and protocol standardization, reduced setup time by 4.3 min and minimized instrument set usage, highlighting that AI integration can enhance both surgical precision and overall operational efficiency [14].
In addition to predicting implant size, several AI models have expanded their scope to forecast optimal alignment targets and identify potential implant‐bone mismatches, such as mediolateral overhang, notching or overstuffing [6, 24, 40]. These parameters are a critical determinant of post‐operative outcomes, particularly with the increasing shift toward patient‐specific alignment strategies in TKA. By integrating component sizing with alignment simulation and bone morphology analysis, such models offer a more comprehensive planning solution, minimizing complications related to malalignment or suboptimal fit [15].
Despite these promising advancements, the generalizability of current AI‐based models remains a significant concern. Most existing models are trained on retrospective, single‐centre data sets with limited demographic diversity and standardized imaging protocols, which may not reflect the variation encountered in broader clinical practice. Variability in patient anatomy, implant systems and radiographic techniques can markedly influence model performance, limiting its applicability without further external validation. The lack of prospective clinical evaluation therefore raises uncertainty as to whether the reported predictive accuracy translates into meaningful improvements in patient outcomes, surgical decision‐making or workflow efficiency. Prospective, multi‐centre validation is therefore essential to confirm the clinical utility and reliability of these models.
These broader concerns are reflected by several limitations within this review. First, heterogeneity in data sources, model architecture and ground truth definitions limited the ability to make direct comparisons across studies. Another limitation is the influence of implant positioning on the definition of the optimal component size. In several of the included studies, ground truth was determined solely by the implanted prosthesis size or by preoperative planning records. However, implant size is not an isolated parameter, and it is inherently linked to alignment and positioning choices made intraoperatively. This interdependence complicates the determination of true prediction accuracy, as the same patient anatomy may reasonably accommodate more than one component size depending on the positioning strategy. Accounting for this interplay between sizing and positioning will require integrating both parameters into ground truth determination and prediction metrics. A practical standardized reference could define ground truth as the component size derived from validated 3D preoperative planning that incorporates defined alignment and positioning parameters and is independently confirmed by another experienced surgeon. This would ensure a reproducible anatomical‐functional benchmark for assessing predictive accuracy.
Second, the independent accuracy or robustness of individual algorithms, such as stochastic gradient boosting or support vector machine, was not evaluated. However, this was beyond the scope of the current analysis, which aimed to compare predictive performance across different planning modalities rather than perform a head‐to‐head assessment of individual algorithm designs.
Third, important clinical endpoints, such as long‐term patient‐reported outcomes and implant survivorship or complication rates, were not consistently reported and therefore could not be analyzed. Finally, computational efficiency was reported in only a minority of studies, which limited the ability to assess the practical feasibility of different AI planning systems in time‐sensitive clinical workflows.
Overall, these findings underscore the potential of AI‐based planning to enhance implant sizing in TKA planning. To support clinical adoption, future work should focus on multicenter validation, integration of alignment and implant‐fit parameters and assessment of clinical effectiveness in real‐world settings.
CONCLUSION
AI‐based models using imaging, particularly CT and MRI, demonstrate high accuracy for preoperative TKA implant sizing. While demographic‐only models are less precise, they may enhance performance when combined with imaging in multimodal approaches. Based on current evidence, x‐ray‐based models provide the best trade‐off between accuracy and practicality, while CT‐based models remain superior in precision but are less feasible for widespread clinical use.
AUTHOR CONTRIBUTIONS
Conceptualization: Michael T. Hirschmann and Randa Elsheikh. Methodology: Michael T. Hirschmann and Randa Elsheikh. Writing—original draft preparation: Randa Elsheikh. Writing—review and editing: Randa Elsheikh, George Mihai Avram, Zainab Aqeel Khan, Rolf Huegli and Andrej M. Nowakowski. Supervision: Michael T. Hirschmann. All authors have read and agreed to the published version of the manuscript.
CONFLICT OF INTEREST STATEMENT
The authors declare no conflicts of interest.
ETHICS STATEMENT
The ethics statement is not available.
Supporting information
Supplementary Material KSSTA.
The reference list from the paper itself. Each links out to its DOI / PubMed record.
- 1Arora J , Sharma S , Blyth M . The role of pre‐operative templating in primary total knee replacement. Knee Surg Sports Traumatol Arthrosc. 2005;13:187–189.15824932 10.1007/s 00167-004-0533-5 · doi ↗ · pubmed ↗
- 2Berend ME , Ritter MA , Hyldahl HC , Meding JB , Redelman R . Implant migration and failure in total knee arthroplasty is related to body mass index and tibial component size. J Arthroplasty. 2008;23:104–109.18722310 10.1016/j.arth.2008.05.020 · doi ↗ · pubmed ↗
- 3Bertolino L , Ranzini MBM , Favaro A , Bardi E , Ronzoni FL , Bonanzinga T . Use of artificial intelligence on imaging and preoperatory planning of the knee joint: a scoping review. Medicina. 2025;61:737.40283028 10.3390/medicina 61040737 PMC 12028754 · doi ↗ · pubmed ↗
- 4Bruns J , Kampen J , Kahrs J , Plitz W . Autogener meniskusersatz mittels rippenperichondrium: experimentelle ergebnisse. Orthopade. 2000;29:145–150.10743636 10.1007/s 001320050023 · doi ↗ · pubmed ↗
- 5Burge TA , Jones GG , Jordan CM , Jeffers JRT , Myant CW . A computational tool for automatic selection of total knee replacement implant size using X‐ray images. Front Bioeng Biotechnol. 2022;10:971096.36246387 10.3389/fbioe.2022.971096 PMC 9557045 · doi ↗ · pubmed ↗
- 6Chandrashekar AS , Suh Y , Fox JA , Mika AP , Moyer DC , Polkowski GG , et al. Development of a machine learning model for determining alignment in knees following total knee arthroplasty. J Arthroplasty. 2026;46(1):96–102.10.1016/j.arth.2025.06.01640499744 · doi ↗ · pubmed ↗
- 7Cichos KH , Hyde ZB , Mabry SE , Ghanem ES , Brabston EW , Hayes LW , et al. Optimization of orthopedic surgical instrument trays: lean principles to reduce fixed operating room expenses. J Arthroplasty. 2019;34:2834–2840.31473059 10.1016/j.arth.2019.07.040 · doi ↗ · pubmed ↗
- 8Cucchi D , Menon A , Compagnoni R , Ferrua P , Fossati C , Randelli P . Significant differences between manufacturer and surgeon in the accuracy of final component size prediction with CT‐based patient‐specific instrumentation for total knee arthroplasty. Knee Surg Sports Traumatol Arthrosc. 2018;26:3317–3324.29453487 10.1007/s 00167-018-4876-8 · doi ↗ · pubmed ↗