Difference in anterior tibial subluxation measured with the bone axis method predicts high‐grade pivot shift in ACL‐deficient knees: A multicenter cohort study
Nobuaki Hayashi, Shotaro Watanabe, Tsuyoshi Hamada, Manato Horii, Masahiko Saito, Yuta Muramatsu, Yusuke Sato, Taisuke Fukawa, Ryuichiro Akagi, Ryosuke Nakagawa, Seiji Kimura, Satoshi Yamaguchi, Seiji Ohtori, Takahisa Sasho

TL;DR
This study shows that a specific MRI measurement method can predict severe knee instability in ACL-injured patients, helping guide surgical planning.
Contribution
The study identifies the bone axis method for measuring anterior tibial subluxation as the best predictor of high-grade pivot shift in ACL-deficient knees.
Findings
D-ATS measured with BAM had the highest ROC-AUC (0.675) for predicting high-grade pivot shift.
A D-ATS value ≥3.8 mm using BAM was an independent predictor of high-grade pivot shift.
Female sex, contralateral knee hyperextension, and medial meniscal injury also predicted high-grade pivot shift.
Abstract
To determine which magnetic resonance imaging (MRI)‐based anterior tibial subluxation (ATS) measurement best reflects rotational instability under anaesthesia in anterior cruciate ligament (ACL)‐injured patients. This retrospective multicenter cohort study included 291 patients who underwent ACL reconstruction between October 2022 and December 2024. Preoperative MRI measurements of lateral ATS (L‐ATS) and difference between lateral and medial ATS (D‐ATS) were obtained using the plateau method (PM) and the bone axis method (BAM). Rotational instability was assessed under anaesthesia using the pivot shift test and categorized as low‐grade (LG‐PS) or high‐grade (HG‐PS). Receiver operating characteristic (ROC) curve analysis was performed to evaluate the discriminative ability of each measurement. Using the cutoff value derived from the Youden index of the ATS parameter that demonstrated…
Genes, proteins, chemicals, diseases, species, mutations and cell lines named across the full text — each resolved to its canonical identifier and authoritative record.
Click any figure to enlarge with its caption.
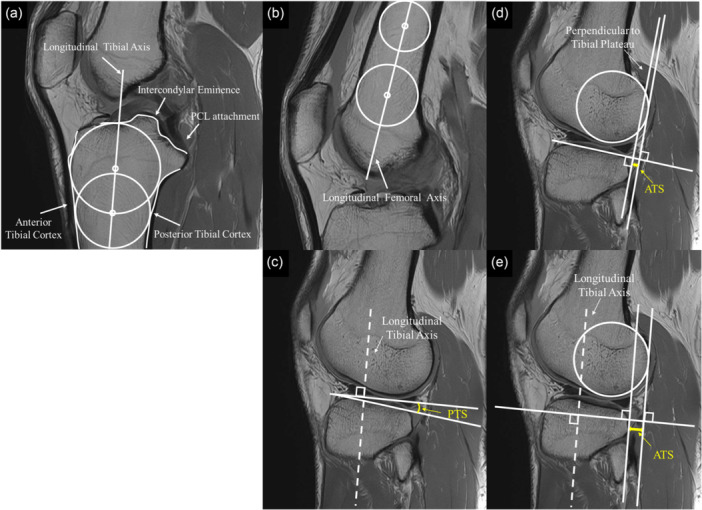 Figure 1
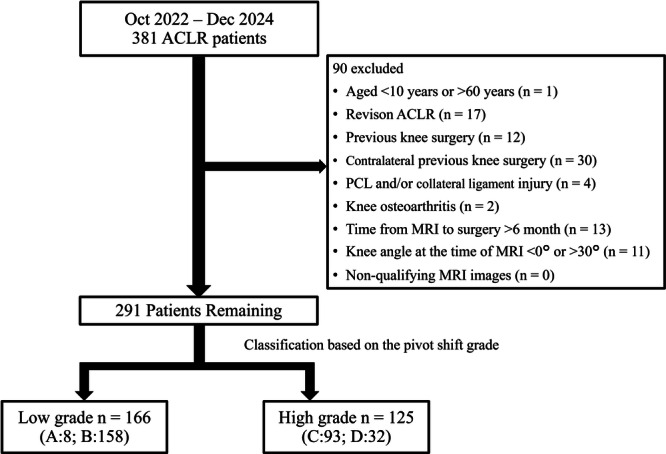 Figure 2
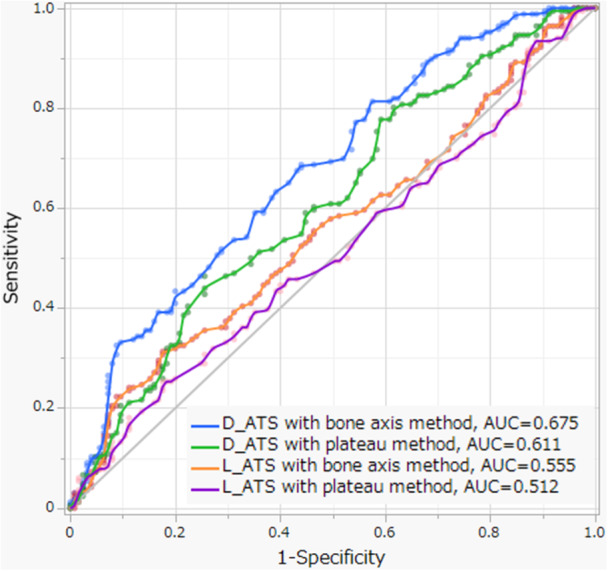 Figure 3
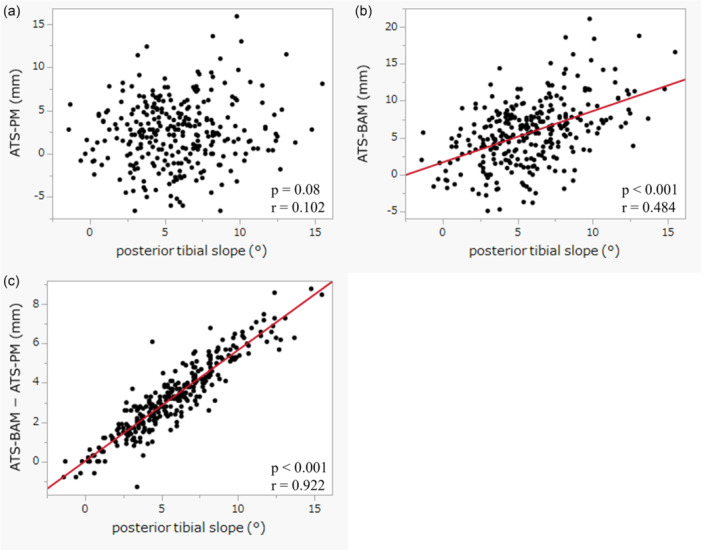 Figure 4
| All cases ( | LG‐PS ( | HG‐PS ( |
| |
|---|---|---|---|---|
| Age (years) | 28.4 ± 12.7 | 28.8 ± 12.4 | 27.9 ± 13.2 | 0.22 |
| Sex | 0.19 | |||
| Male | 158 (54.3%) | 96 (57.8%) | 62 (49.6%) | |
| Female | 133 (45.7%) | 70 (42.2%) | 63 (50.4%) | |
| Body mass index, kg/m2 | 23.8 ± 3.9 | 23.5 ± 3.6 | 24.1 ± 4.2 | 0.17 |
| Mechanism of injury | 0.95 | |||
| Contact | 67 (23.0%) | 38 (22.9%) | 29 (23.2%) | |
| Noncontact | 224 (77.0%) | 128 (77.1%) | 96 (76.8%) | |
| Tegner Activity Scale | 6 (6–7) | 6 (6–7) | 6 (6–7) | 0.71 |
| Time to surgery, months | 2 (1–5) | 2 (1–5) | 3 (1–6) | 0.14 |
| Knee hyperextension | 48 (16.5%) | 13 (7.8%) | 35 (28.0%) |
|
| Lachman test |
| |||
| Low grade (A or B) | 190 (65.3%) | 118 (71.1%) | 72 (57.6%) | |
| High grade (C or D) | 101 (34.7%) | 48 (28.9%) | 53 (42.4%) | |
| Meniscal tear | ||||
| Medial meniscus | 102 (35.1%) | 45 (27.1%) | 57 (45.6%) |
|
| Ramp lesion | 49 (16.8%) | 19 (11.5%) | 30 (24.0%) |
|
| Lateral meniscus | 147 (50.5%) | 79 (47.6%) | 68 (54.4%) | 0.25 |
| Lateral meniscus posterior horn | 21 (7.2%) | 7 (4.2%) | 14 (11.2%) |
|
| Intraclass correlation coefficient (standard error of measurement [mm]) | ||||
|---|---|---|---|---|
| L‐ATS | D‐ATS | |||
| Plateau method | Bone axis method | Plateau method | Bone axis method | |
| Intra‐observer | 0.954 (1.41) | 0.965 (1.07) | 0.963 (0.95) | 0.946 (1.26) |
| Excellent | Excellent | Excellent | Excellent | |
| Inter‐observer | 0.918 (1.34) | 0.943 (1.00) | 0.830 (1.40) | 0.870 (1.23) |
| Excellent | Excellent | Good | Good | |
| All cases ( | LG‐PS ( | HG‐PS ( |
| |
|---|---|---|---|---|
| Knee angle, degree | 12.0 ± 6.4 | 11.8 ± 6.2 | 12.2 ± 6.7 | 0.64 |
| Posterior tibial slope, degree | 5.8 ± 3.0 | 5.5 ± 2.9 | 6.2 ± 3.2 |
|
| Plateau method, mm | ||||
| L‐ATS | 2.40 ± 3.78 | 2.25 ± 3.75 | 2.60 ± 3.82 | 0.44 |
| D‐ATS | 1.70 ± 3.23 | 1.12 ± 3.04 | 2.46 ± 3.33 |
|
| Bone axis method, mm | ||||
| L‐ATS | 5.70 ± 4.34 | 5.24 ± 4.23 | 6.32 ± 4.42 |
|
| D‐ATS | 2.97 ± 3.56 | 2.00 ± 3.22 | 4.25 ± 3.58 |
|
| ROC‐AUC | Cutoff value (mm) | Youden Index | Sensitivity | Specificity | |
|---|---|---|---|---|---|
| Plateau method | |||||
| L‐ATS | 0.512 | –0.4 | 0.077 | 0.824 | 0.253 |
| D‐ATS | 0.611 | 1.0 | 0.208 | 0.744 | 0.464 |
| Bone axis method | |||||
| L‐ATS | 0.555 | 3.0 | 0.137 | 0.824 | 0.313 |
| D‐ATS | 0.675 | 3.8 | 0.247 | 0.560 | 0.687 |
| High‐grade pivot shift | ||
|---|---|---|
| Variables | OR (95% CI) |
|
| Age | 0.99 (0.97–1.01) | 0.22 |
| Sex | ||
| Male | 1.00 (Reference) | |
| Female | 1.88 (1.08–3.27) |
|
| Body mass index | 1.07 (1.00–1.15) | 0.058 |
| Time to surgery | 1.00 (1.00–1.01) | 0.22 |
| Knee hyperextension | 3.70 (1.74–7.89) |
|
| Medial meniscus tear | 2.27 (1.31–3.93) |
|
| Lateral meniscus tear | 1.11 (0.66–1.88) | 0.69 |
| Knee angle | 1.01 (0.97–1.06) | 0.57 |
| High D‐ATS with bone axis method | 3.92 (2.24–6.84) |
|
- —JSPS KAKENHI
- —The Japanese Knee Society, 2025
- —JST‐Mirai Program
- —Grant of The Japanese Knee Society, 2025
- —JST SPRING
Peer Reviews
No public reviews on file for this paper yet. If you reviewed it on a platform where reviews are public (OpenReview, ICLR, NeurIPS, ICML), you can paste yours below so the community can read it here.
Videos
No videos yet. Explain this paper in a talk, walkthrough, or lecture? Add one.
Taxonomy
TopicsKnee injuries and reconstruction techniques · Total Knee Arthroplasty Outcomes · Lower Extremity Biomechanics and Pathologies
INTRODUCTION
Anterior cruciate ligament (ACL) injuries result in both anterior and rotational instability of the knee [16]. Manual tests commonly used to evaluate knee instability include the Lachman test for anterior instability and the pivot shift test for rotational instability. A preoperative high‐grade pivot shift test under anaesthesia has been associated with an increased risk of ACL graft failure after reconstruction [10], and with residual rotational instability following ACL reconstruction (ACLR) [17, 18, 34].
Accurate assessment of rotational instability in awake patients is often limited owing to muscular guarding [3]. Lateral compartment translation and tibial acceleration during the pivot shift test are significantly smaller in awake patients compared with those under anaesthesia [4, 24]. Without an accurate evaluation of rotational instability until anaesthesia is administered on the day of surgery, appropriate surgical planning, graft selection and risk assessment may be less informed by the true magnitude of rotational laxity. Although these decisions are routinely made preoperatively using clinical examination, imaging findings and patient‐related factors, the ability to predict the pivot shift grade under anaesthesia could further refine surgical decision‐making, including optimal graft choice [14, 25, 30] and consideration of additional lateral extra‐articular procedures [6, 7, 8, 9, 31].
Since anterior tibial subluxation (ATS) was first reported to be associated with failed ACL reconstruction and knee instability [1, 5], numerous subsequent studies have been published. Magnetic resonance imaging (MRI) allows objective quantification of ATS, and two primary measurement methods have been described: the plateau method (PM), which uses a line perpendicular to the tibial articular surface, and the bone axis method (BAM), which references the longitudinal tibial axis. ATS can be measured separately in the medial and lateral compartments, and lateral ATS (L‐ATS) has been reported to correlate with pivot shift test grade under anaesthesia [2, 22, 23, 35]. Additionally, the difference between lateral and medial ATS (D‐ATS) has also been reported to correlate with the pivot shift test grade under anaesthesia [28, 37]. Notably, ATS measurements demonstrate satisfactory inter‐ and intra‐observer reliability [37, 38].
ATS can be assessed using L‐ATS or D‐ATS, each measured using either PM or BAM. However, it remains unclear which measurement method most accurately reflects rotational instability of the knee. Therefore, the primary aim of this study was to determine which MRI‐based ATS parameter best discriminates high‐grade pivot shift (HG‐PS) under anaesthesia in ACL‐injured patients. The secondary aim was to investigate whether the ATS parameter with the highest discriminatory ability is an independent predictor of HG‐PS after adjustment for clinically relevant covariates. It was hypothesized that the ATS parameter that best reflects pivot shift grade under anaesthesia would remain an independent predictor of HG‐PS.
MATERIALS AND METHODS
Study design
This retrospective multicenter cohort study utilized prospectively collected data from an ACL reconstruction database.
Patient selection
Patients who underwent ACL reconstruction at the participating facilities between October 2022 and December 2024 were included. All patients underwent manual physical examination and MRI before surgery, and ACL ruptures were confirmed arthroscopically. Clinical and imaging evaluations were performed by board‐certified orthopaedic surgeons specializing in knee surgery, each with more than 10 years of clinical experience.
Exclusion criteria were as follows: associated fractures; age <10 years or >60 years; revision ACLR; previous surgery on the affected or contralateral knee; combined ligament injuries (posterior cruciate ligament [PCL] and/or Grade 3 collateral ligament injuries) and radiographic evidence of osteoarthritis (Kellgren–Lawrence grade ≥2). Patients with Grade 1 or 2 collateral ligament injuries were not excluded. Meniscal injuries were not considered exclusion criteria. Additional exclusion criteria were: time from MRI to surgery exceeding 6 months; knee flexion angle <0° or >30° at the time of MRI; and non‐qualifying MRI images, defined as examinations performed on scanners with field strength <1.5 T or with imaging coverage insufficient to define the bone axis.
Data collection and variables
All participating institutions used a standardized registration form to record demographic data, including age, sex, and body mass index (BMI), Tegner Activity Scale (TAS) score [33], comorbidities, surgical history, cause and date of injury, range of motion, presence of contralateral knee hyperextension, Lachman test grade [11], pivot shift test grade [11], date of surgery and associated intra‐articular injuries including meniscal and cartilage lesions. All preoperative MRI images were acquired in the clinical setting as part of standard care and subsequently registered in the study database. Registration in the database was considered complete once all the required data were collected.
Evaluation of knee instability
Knee range of motion and instability were assessed under anaesthesia. Contralateral knee hyperextension was defined as >10°. The Lachman and pivot shift tests were performed on the injured knee and graded according to the International Knee Documentation Committee classification.
The Lachman test was performed with the knee in 25° of flexion, placing one hand medially on the tibia and the other laterally on the femur. Grades were defined as follows: Grade A, normal anterior translation; Grade B, nearly normal translation; Grade C, abnormal translation and Grade D, severely abnormal translation [11]. In this study, Grades A and B were considered low‐grade instability, and Grades C and D as high‐grade instability.
The pivot shift test was performed by holding the heel, applying internal rotation and valgus stress to the tibia and flexing the knee from full extension. Grading was as follows: Grade A, negative pivot shift (normal knee); Grade B, nearly normal pivot shift with a glide (+); Grade C, abnormal pivot shift with a clunk (++) and Grade D, severely abnormal pivot shift with a gross shift (+++) [11]. As with the Lachman test, Grades A and B were categorized as low‐grade instability and Grades C and D as high‐grade instability.
Across institutions, grading criteria and operational definitions for the pivot shift tests were aligned through inter‑institutional consensus meetings to promote consistency of performance and interpretation. In total, pivot shift testing and grading were performed by eight board‐certified knee surgeons across the participating institutions.
Evaluation of intra‐articular injuries
ACLR was performed under general or spinal anaesthesia. Intra‐articular assessment was conducted via anterolateral and anteromedial portals using a probe. ACL tears were confirmed arthroscopically. The medial and lateral menisci were probed to evaluate the size and type of tears, and findings were recorded. Meniscal injuries requiring repair or resection were defined as medial meniscal tears, ramp lesions, lateral meniscal tears and lateral meniscal posterior horn tears.
MRI measurement methods
Knee MRI scans obtained from the participating institutions were used for analysis. Sagittal proton density–weighted sequences were analysed. All measurements were performed by a single board‐certified orthopaedic surgeon specializing in knee surgery. Images were analysed using AZE VirtualPlace Plus (Canon Medical Systems Corporation).
The longitudinal tibial axis was assessed on the central sagittal slice, where the tibial intercondylar eminence, anterior tibial cortex and concave posterior tibial cortex were all visible. To define the longitudinal tibial axis, two circles were drawn: the proximal circle was fitted to the anterior, posterior and proximal cortical borders; the distal circle was positioned such that its centre laid on the circumference of the proximal circle and touched the anterior and posterior cortices. The longitudinal tibial axis was defined as the line connecting the centres of these two circles (Figure 1a) [32]. The longitudinal femoral axis was assessed on the sagittal slice most clearly showing the femoral shaft. Two circles were drawn, each fitted to the anterior and posterior cortical borders of the femoral shaft, and the longitudinal femoral axis was defined as the line connecting their centres (Figure 1b) [36].
Measurements of knee angle, ATS and PTS on sagittal magnetic resonance imaging. (a) To define the longitudinal tibial axis, two circles were drawn. The tibial axis was defined as the line connecting the centres of these two circles. (b) To define the longitudinal femoral axis, two circles were drawn. The femoral axis was defined as the line connecting the centres of these two circles. (c) PTS was defined as the angle between the tibial plateau and a line perpendicular to the longitudinal tibial axis. (d) ATS measured with the plateau method was defined as the distance between a vertical line of tibial plateau drawn from the posterior margin to the posterior femoral condyle and the posterior edge of the tibial articular surface. (e) ATS measured with the bone axis method was defined as the distance between a parallel line of the tibial axis drawn from the posterior margin to the posterior femoral condyle and a parallel line drawn from the posterior margin of the tibial articular surface. ATS, anterior tibial subluxation; PCL, posterior cruciate ligament; PTS, posterior tibial slope.
The knee flexion angle was measured as the angle between the femoral and tibial axes. The medial sagittal slice was defined as the slice where the medial head of the gastrocnemius tendon inserts into the femur. The lateral slice was defined as the slice at the medial‐most aspect of the proximal tibiofibular joint. Using these slices, ATS and posterior tibial slope (PTS) were measured.
The joint surface line was defined as the line connecting the anterior and posterior edges of the cartilage‐covered tibial plateau. PTS was measured as the angle between the tibial plateau and a line perpendicular to the tibial axis, representing the posterior inclination of the articular surface (Figure 1c) [15, 30].
ATS measured with PM (ATS‐PM) was defined as the distance between a vertical line from the posterior margin of a circle fitted to the posterior femoral condyle and a vertical line from the posterior edge of the tibial articular surface [15, 32]. ATS measured with BAM (ATS‐BAM) was defined as the distance between a line parallel to the tibial axis drawn from the posterior margin of the circle fitted to the posterior femoral condyle and a parallel line from the posterior margin of the tibial articular surface [37]. Anterior tibial translation was defined as positive (Figure 1d,e).
MRI measurements included knee flexion angle, lateral PTS, and L‐ATS and D‐ATS measured using both PM and BAM. The intraclass correlation coefficient (ICC) was calculated to assess intra‐ and inter‐observer reliability for L‐ATS and D‐ATS measured with both the plateau and BAMs in 20 cases. These cases were independently measured by a second board‐certified orthopaedic surgeon, and the first examiner repeated all measurements after an interval of more than 1 month.
Statistical analysis
Demographic characteristics and clinical features (age, sex, BMI, mechanism of injury, TAS, time from injury to surgery, contralateral knee hyperextension and Lachman grade) were compared between the low‐grade pivot shift (LG‐PS) and HG‐PS groups. Continuous variables were presented as mean ± standard deviation or median with interquartile range, as appropriate. Categorical variables were presented as number and percentage. Continuous variables were analysed using either the Student's t test or the Wilcoxon rank‐sum test, depending on data normality. Categorical variables were analysed using the χ ^2^ test.
Reliability of intra‐observer and inter‐observer measurements was assessed using the ICC, which ranges from 0 (no agreement) to 1 (perfect agreement) [19]. Specifically, ICC (1,2) was used for intra‐observer reliability and ICC (2,1) for inter‐observer reliability. In addition, the standard error of measurement was calculated to quantify absolute measurement error and is reported alongside ICC values.
For the primary analysis, Student's t tests compared L‐ATS and D‐ATS measured with both PM and BAM between LG‐PS and HG‐PS groups. Receiver operating characteristic (ROC) curves were generated using HG‐PS as the positive condition, and the area under the curve (AUC) was calculated to assess discriminatory ability. The optimal cutoff value for each parameter was determined using the Youden index (sensitivity − [1 − specificity]). Sensitivity and specificity at the optimal cutoff were calculated.
Using the ATS parameter that demonstrated the largest ROC‐AUC, multivariate logistic regression was performed to determine whether ATS remained a significant predictor of pivot shift grade after adjustment for other factors. Pivot shift grade was entered as the dependent variable, and age, sex, BMI, time from injury to surgery, knee hyperextension, medial meniscus tears, lateral meniscus tears, knee angle on MRI and ATS were categorized into high and low groups according to the cutoff value were included as independent variables.
As a secondary analysis, the relationship between ATS and PTS was examined to assess whether PM underestimates ATS compared with BAM due to the influence of PTS. Pearson correlation coefficients [21] were calculated between L‐ATS‐BAM and lateral PTS; L‐ATS‐PM and lateral PTS and the difference in L‐ATS between the two methods and lateral PTS.
All statistical analyses were conducted using JMP®, Version 18 (SAS Institute Inc., 1989–2025), with statistical significance set at p < 0.05.
RESULTS
Study participants and group allocation
A total of 381 patients underwent ACLR, of whom 90 were excluded. Ultimately, 291 patients were included in the final statistical analysis. Classification based on the pivot shift test under anaesthesia revealed 8 patients (2.7%) with Grade A, 158 (54.3%) with Grade B, 93 (32.0%) with Grade C and 32 (11.0%) with Grade D. Accordingly, 166 patients (57.0%) were allocated to the LG‐PS group and 125 patients (43.0%) to the HG‐PS group (Figure 2).
Flowchart of study participants. After excluding ineligible cases from the initial 381 knees, patients were classified into two groups based on the pivot shift test. ACLR, anterior cruciate ligament reconstruction; MRI, magnetic resonance imaging; PCL, posterior cruciate ligament.
Comparison of patient characteristics
Patient demographics and clinical characteristics are summarized in Table 1. There were no significant differences between the LG‐PS and HG‐PS groups with respect to age, sex, BMI, mechanism of injury, TAS score, time from injury to surgery or lateral meniscus tears. In contrast, significant differences were observed in the incidence of contralateral knee hyperextension (p < 0.001), Lachman test grade (p = 0.017), medial meniscal tears (p = 0.001), ramp lesions (p = 0.005) and lateral meniscal posterior horn tears (p = 0.023).
Table 1: Patient characteristics for all cases and by group. a
Reliability of intra‐ and inter‐observer measurements
Intra‐observer reliability was excellent for both L‐ATS and D‐ATS measured with PM and BAM. Inter‐observer reliability was also excellent for L‐ATS measured by both methods and good for D‐ATS measured by both methods (Table 2).
ATS measurements on MRI
When comparing the LG‐PS and HG‐PS groups, no significant difference was observed in L‐ATS‐PM (p = 0.44). However, D‐ATS‐PM (p < 0.001) and both L‐ATS and D‐ATS measured with BAM (p = 0.035 and p < 0.001, respectively) were significantly greater in the HG‐PS group. No significant difference in the knee flexion angle was noted between the two groups. Lateral PTS was significantly greater in the HG‐PS group (Table 3).
Table 3: Results of magnetic resonance imaging measurements. a
ROC‐AUC values were L‐ATS‐PM, 0.512; D‐ATS‐PM, 0.611; L‐ATS‐BAM, 0.555 and D‐ATS‐BAM, 0.675 (Table 4, Figure 3).
Receiver operating characteristic curves of L‐ATS and D‐ATS measured with the plateau and bone axis methods for high‐grade pivot shift. AUC, area under the receiver operating characteristic curve; D‐ATS, difference between lateral and medial anterior tibial subluxation; L‐ATS, lateral anterior tibial subluxation.
The cutoff values and corresponding Youden indices were L‐ATS‐PM, –0.4 mm (0.077); D‐ATS‐PM, 1.0 mm (0.208); L‐ATS‐BAM, 3.0 mm (0.137) and D‐ATS‐BAM, 3.8 mm (0.247).
Multivariate analysis with high‐grade pivot shift as the dependent variable
Among the ATS parameters, D‐ATS‐BAM showed the largest ROC‐AUC, with the cutoff value of 3.8 mm. Therefore, patients were dichotomized into two groups based on D‐ATS‐BAM of 3.8 mm, and this variable was included as one of the explanatory factors in the multivariate logistic regression analysis. Significant predictors of HG‐PS were female sex (odds ratio [OR]: 1.88, 95% confidence interval [CI]: 1.08–3.27, p = 0.025), contralateral knee hyperextension (OR: 3.70, 95% CI: 1.74–7.89, p < 0.001), medial meniscal tears (OR: 2.27, 95% CI: 1.31–3.93, p = 0.004) and high D‐ATS‐BAM (OR: 3.92, 95% CI: 2.24–6.84, p < 0.001) (Table 5).
Table 5: Multivariate logistic regression analysis for high‐grade pivot shift. a
Correlation between ATS and PTS
No significant correlation was observed between L‐ATS‐PM and lateral PTS (r = 0.102, p = 0.081). In contrast, L‐ATS‐BAM demonstrated a moderate correlation with lateral PTS (r = 0.484, p < 0.001). Furthermore, the difference between L‐ATS measured with BAM and PM showed an extremely strong correlation with PTS (r = 0.922, p < 0.001) (Figure 4).
Correlation between lateral ATS and lateral PTS. (a) Correlation between lateral ATS measured with the plateau method and lateral PTS. (b) Correlation between lateral ATS measured with the bone axis method and lateral PTS. (c) Correlation between the difference in lateral ATS values measured with the bone axis and plateau methods, and lateral PTS. ATS‐BAM, anterior tibial subluxation measured with the bone axis method; ATS‐PM, anterior tibial subluxation measured with the plateau method; PTS, posterior tibial slope.
DISCUSSION
In this study, preoperative MRI‐based ATS was associated with the pivot shift grade under anaesthesia in patients undergoing ACLR. D‐ATS‐BAM provided the best discrimination for HG‐PS (ROC‐AUC 0.675), and a cutoff of ≥3.8 mm independently predicted HG‐PS.
Several previous studies have reported that L‐ATS‐PM is associated with rotational instability [2, 22, 23, 35]. More recently, based on the concept that D‐ATS may reflect tibial internal rotation, an association between D‐ATS and rotational instability has also been reported [28, 38]. In a retrospective study analysing 156 knees using weight‐bearing MRI, patients with D‐ATS‐PM > 6.0 mm had a significantly higher incidence of HG‐PS compared to those with D‐ATS < 3.0 mm. Multivariate analysis in that study identified D‐ATS and lateral meniscal posterior horn tears as significant predictors of HG‐PS [28]. Another retrospective study comparing 104 ACL‐injured and 104 uninjured patients reported significantly greater L‐ATS and D‐ATS values, both measured with BAM, in the ACL‐injured group [38]. Furthermore, in a study investigating the relationship between D‐ATS‐BAM and anterolateral complex injury, the mean D‐ATS‐BAM among ACL‐injured patients with anterolateral complex injury was 5.6 ± 3.2 mm [39]. In this cohort, D‐ATS had a higher ROC‐AUC than L‐ATS when measured with either method, suggesting that D‐ATS may better reflect rotational instability than L‐ATS. Multivariate analysis confirmed that D‐ATS‐BAM ≥ 3.8 mm was a significant predictor of HG‐PS, even when controlling for other covariates. Female sex, contralateral knee hyperextension and medial meniscal injury were also found to be independent predictors, and D‐ATS‐BAM ≥ 3.8 mm showed the largest odds ratio among the explanatory variables. These findings suggest that patients with high D‐ATS‐BAM ≥ 3.8 mm, as well as those with these clinical risk factors, may require careful consideration regarding surgical strategy.
Although most previous studies on MRI‐based assessment of ATS have evaluated ATS‐PM, several recent reports have described ATS‐BAM [37, 38]. The methodological difference between PM and BAM has been attributed to the influence of tibial morphology on PM, whereas BAM more directly reflects the femorotibial relationship [37]. Consistent with this concept, the difference between L‐ATS‐BAM and L‐ATS‐PM increased with PTS, supporting the susceptibility of PM measurements to individual tibial geometry. This may partly explain why D‐ATS‐BAM outperformed D‐ATS‐PM in terms of ROC‐AUC, as did L‐ATS‐BAM compared with L‐ATS‐PM. Although MRI does not capture the full length of the tibia and therefore yields a tibial axis different from that obtained on full‐length radiographs [13], the method used in this study demonstrated good reliability, as it allows for accurate measurement even on standard knee imaging.
Preoperative assessment of rotational instability under anaesthesia is considered valuable for surgical planning. The pivot shift test performed in awake patients may not reliably reflect actual instability owing to muscular guarding [3]. Without a reliable assessment until the day of surgery, preoperative planning, including graft selection and risk assessment, may remain insufficient. MRI is widely performed in patients prior to ACLR and is a highly accessible imaging modality. Therefore, D‐ATS‐BAM on routinely obtained MRI may help predict rotational instability under anaesthesia and contribute to more informed surgical decision‐making, including appropriate graft choice [14, 25, 30] and whether to perform lateral extra‐articular procedures [6, 7, 8, 9, 31]. Furthermore, D‐ATS‐BAM may also be useful for assessing residual rotational instability after ACLR in situations where clinical evaluation is limited by muscular guarding.
LIMITATIONS
There are some limitations to this study. First, the pivot shift test is a subjective assessment and may vary among examiners [3, 12, 20, 27]. In this multicenter study, pivot shift testing and grading were performed by eight surgeons, and inter‐observer variability should be considered an important limitation. To minimize inter‐observer variability, the testing procedures and grading criteria were standardized across participating institutions, and consistency in evaluation was confirmed. In addition, dichotomizing the four‐grade pivot shift into low‐ and high‐grade groups may oversimplify the dynamic nature of rotational instability. Second, knee flexion angles during MRI acquisition varied among patients. As flexion angle may influence ATS measurements [26, 29], we excluded cases with substantial deviation to minimize its impact. Third, the time interval from MRI to surgery was not uniform, which could have affected instability due to injury progression. To address this, cases with more than 6 months interval between MRI and surgery were excluded. Fourth, patients with concomitant Grade 1 or 2 collateral ligament injuries were not excluded, which may have influenced pivot shift findings and potentially affected the observed associations. Fifth, the discriminative ability of D‐ATS‐BAM was modest (AUC 0.675), and because the Youden index was modest, the proposed cutoff value may be useful for research stratification but should be applied with caution in clinical decision‐making. Finally, MRI is a static modality and cannot capture dynamic aspects of instability. Because rotational laxity and the pivot shift phenomenon are multifactorial, HG‐PS cannot be explained by MRI‐based ATS alone.
CONCLUSION
Among various methods for measuring ATS on preoperative MRI in ACL‐injured knees, D‐ATS‐BAM showed the strongest association with the pivot shift test under anaesthesia. In multivariate analysis, D‐ATS‐BAM ≥ 3.8 mm was independently associated with a high‐grade pivot shift. These findings suggest that D‐ATS‐BAM may be used as an adjunct MRI marker to complement clinical assessment and, in combination with other clinical and imaging factors, help guide surgical strategy.
AUTHOR CONTRIBUTIONS
Conception and design: Nobuaki Hayashi, Shotaro Watanabe and Takahisa Sasho. Analysis and interpretation of data: Nobuaki Hayashi, Shotaro Watanabe and Takahisa Sasho. Acquisition of data: All authors. Drafting of the article: Nobuaki Hayashi and Shotaro Watanabe. Critical revision of the article for important intellectual content and final approval: All authors. Accuracy of the work: All authors. Funding acquisition: Nobuaki Hayashi and Shotaro Watanabe. All authors had full access to all data in the study and take responsibility for the integrity of the data and the accuracy of the data analysis.
CONFLICT OF INTEREST STATEMENT
Seiji Ohtori has received lecture fees and honoraria from Daiichi Sankyo Co., Ltd., Nippon Zoki Pharmaceutical Co., Ltd. and Hisamitsu Pharmaceutical Co., Inc. The remaining authors declare no conflict of interest.
ETHICS STATEMENT
The study protocol was approved by the Ethics Committee of Chiba University Hospital (Approval No. M10346) and the ethics committees of all participating institutions. Written informed consent was obtained from all patients prior to surgery.
The reference list from the paper itself. Each links out to its DOI / PubMed record.
- 1Almekinders L , Chiavetta J , Clarke J . Radiographic evaluation of anterior cruciate ligament graft failure with special reference to tibial tunnel placement. Arthroscopy. 1998;14(2):206–211.9531134 10.1016/s 0749-8063(98)70042-8 · doi ↗ · pubmed ↗
- 2Bedi A , Musahl V , Lane C , Citak M , Warren RF , Pearle AD . Lateral compartment translation predicts the grade of pivot shift: a cadaveric and clinical analysis. Knee Surg Sports Traumatol Arthrosc. 2010;18(9):1269–1276.20480356 10.1007/s 00167-010-1160-y · doi ↗ · pubmed ↗
- 3Benjaminse A , Gokeler A , van der Schans CP . Clinical diagnosis of an anterior cruciate ligament rupture: a meta‐analysis. J Orthop Sports Phys Ther. 2006;36(5):267–288.16715828 10.2519/jospt.2006.2011 · doi ↗ · pubmed ↗
- 4Caracciolo G , Yáñez R , Silvestre R , De la Fuente C , Zamorano H , Ossio A , et al. Intraoperative pivot‐shift accelerometry combined with anesthesia improves the measure of rotatory knee instability in anterior cruciate ligament injury. J Exp Orthop. 2021;8(1):80.34561730 10.1186/s 40634-021-00396-1PMC 8463650 · doi ↗ · pubmed ↗
- 5Dejour H , Bonnin M . Tibial translation after anterior cruciate ligament rupture. Two radiological tests compared. J Bone Joint Surg Br. 1994;76(5):745–749.8083263 · pubmed ↗
- 6Firth AD , Bryant DM , Litchfield R , Mc Cormack RG , Heard M , Mac Donald PB , et al. Predictors of graft failure in young active patients undergoing hamstring autograft anterior cruciate ligament reconstruction with or without a lateral extra‐articular tenodesis: the stability experience. Am J Sports Med. 2022;50(2):384–395.35050817 10.1177/03635465211061150 PMC 8829733 · doi ↗ · pubmed ↗
- 7Geeslin AG , Moatshe G , Chahla J , Kruckeberg BM , Muckenhirn KJ , Dornan GJ , et al. Anterolateral knee extra‐articular stabilizers: a robotic study comparing anterolateral ligament reconstruction and modified Lemaire lateral extra‐articular tenodesis. Am J Sports Med. 2018;46(3):607–616.29268024 10.1177/0363546517745268 · doi ↗ · pubmed ↗
- 8Getgood AMJ , Bryant DM , Litchfield R , Heard M , Mc Cormack RG , Rezansoff A , et al. Lateral extra‐articular tenodesis reduces failure of hamstring tendon autograft anterior cruciate ligament reconstruction: 2‐year outcomes from the STABILITY study randomized clinical trial. Am J Sports Med. 2020;48(2):285–297.31940222 10.1177/0363546519896333 · doi ↗ · pubmed ↗