Compressing Few-Cycle Optical Near Fields in the Tip–Sample Junction of a Scanning Probe Microscope
Tom Jehle, Sam S. Nochowitz, Juanmei Duan, Christoph Lienau

TL;DR
This paper shows how light pulses can be compressed in nanoscale gaps, enabling precise control and study of light at the nanometer scale.
Contribution
The study introduces subcycle temporal resolution of electric fields in plasmonic nanogaps using visible to near-infrared light.
Findings
Electric field amplitude and phase were measured with subcycle precision in a nanogap.
A complex-valued local near-field enhancement was observed in the tip-sample junction.
Spatial confinement in the nanogap correlates with reduced pulse duration of few-cycle light.
Abstract
Plasmonic nanogaps confine light to dimensions in the nanometer or even subnanometer range while simultaneously enhancing the local electromagnetic field strength. This spatial light confinement has been key for the development of nano-optics. So far, the temporal dynamics of such nanoconfined fields has received comparatively little attention, in particular in the visible spectral range. Here we measure the amplitude and phase of the electric field of visible to near-infrared light pulses scattered from the gap between a sharp gold tip and a metal surface. We retrieve the time structure of the field with subcycle precision. We provide evidence for a complex-valued local near-field enhancement and demonstrate that the spatial confinement of a few-cycle pulse in the investigated nanogap is correlated with a substantial reduction in its pulse duration. Our results pave the way for probing…
Genes, proteins, chemicals, diseases, species, mutations and cell lines named across the full text — each resolved to its canonical identifier and authoritative record.
Click any figure to enlarge with its caption.
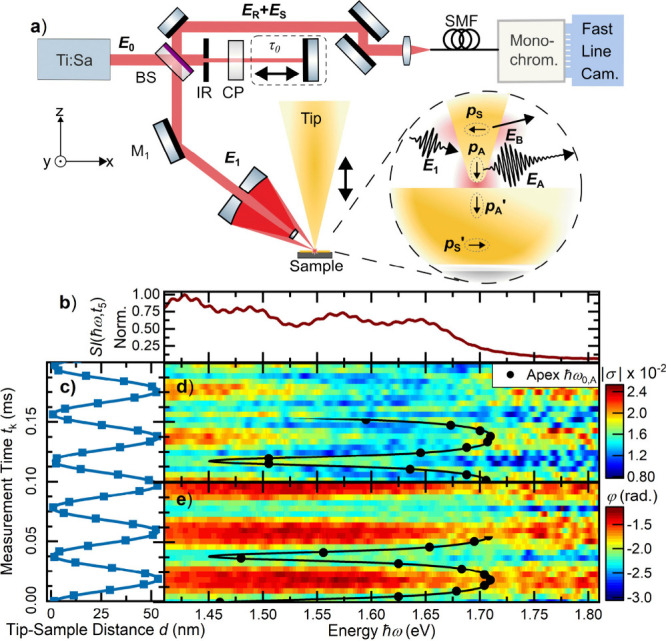 Figure 1
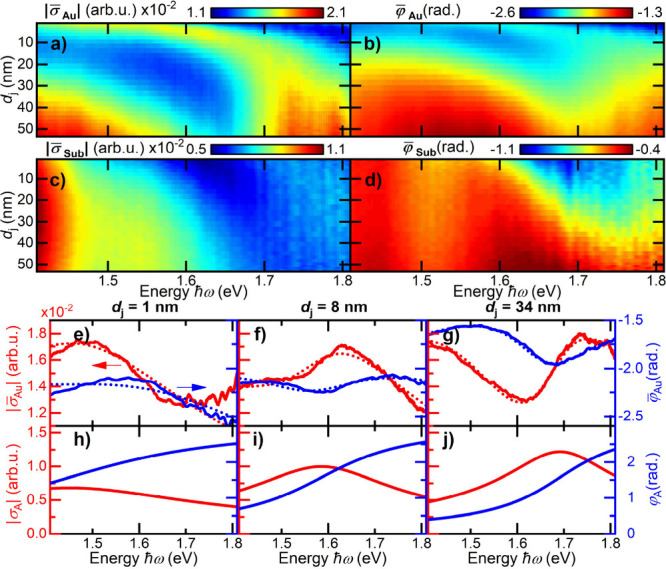 Figure 2
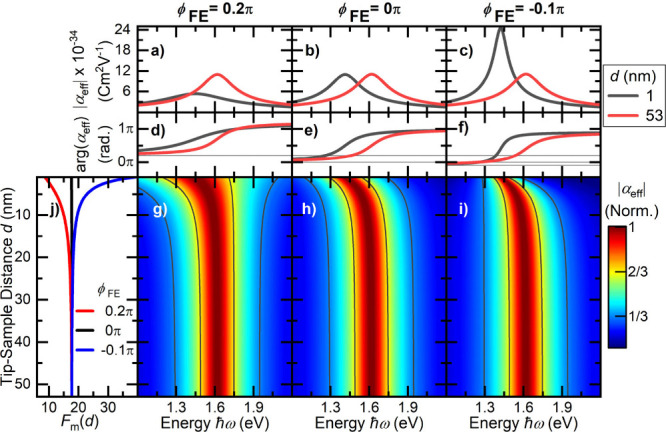 Figure 3
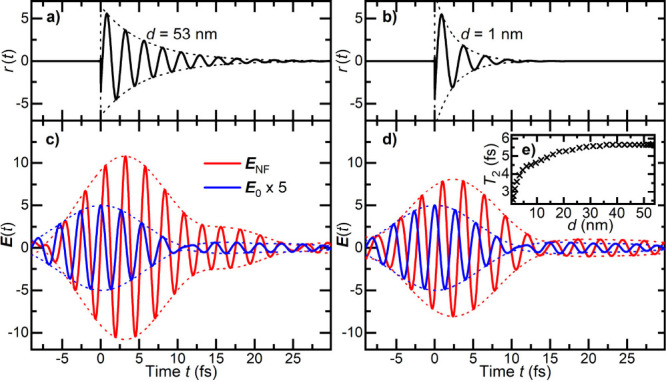 Figure 4
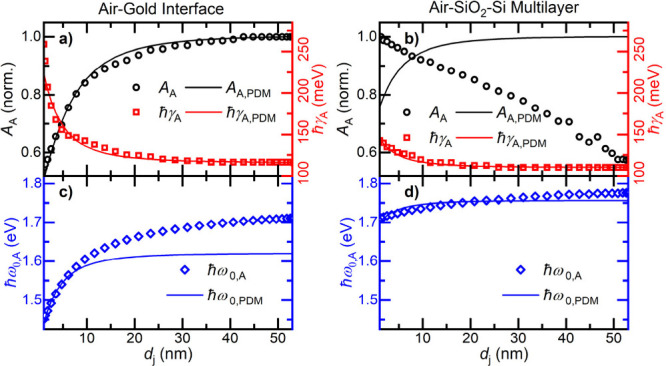 Figure 5
 Figure 6
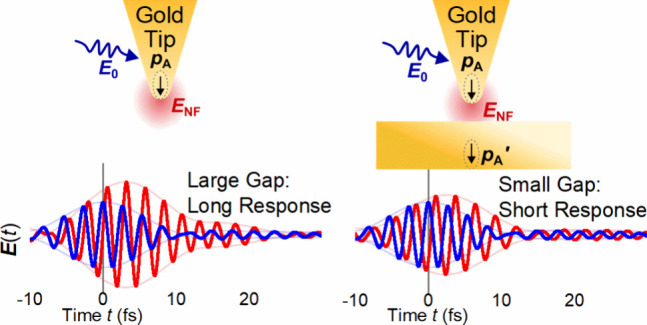 Figure 7
 Figure 8
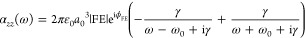 Figure 9
 Figure 10
 Figure 11
- —Deutsche Forschungsgemeinschaft10.13039/501100001659
- —Deutsche Forschungsgemeinschaft10.13039/501100001659
- —Volkswagen Foundation10.13039/501100001663
- —Nieders?chsisches Ministerium f?r Wissenschaft und Kultur10.13039/501100010570
Peer Reviews
No public reviews on file for this paper yet. If you reviewed it on a platform where reviews are public (OpenReview, ICLR, NeurIPS, ICML), you can paste yours below so the community can read it here.
Videos
No videos yet. Explain this paper in a talk, walkthrough, or lecture? Add one.
Taxonomy
TopicsPlasmonic and Surface Plasmon Research · Gold and Silver Nanoparticles Synthesis and Applications · Near-Field Optical Microscopy
The spatial confinement of light to a nanoscale volume in the gap between a plasmonic nanostructure and a surface and the resulting field enhancement have been instrumental for the development of nano-optics during the past four decades,? leading to significant advances in our understanding of light–matter interactions on the nanoscale. ?−? ? A variety of nanogap geometries, ranging from the tip–sample junction of a scanning probe microscope ?,? over nanoparticles on mirrors (NPoM), ?,?−? ? to kissing metal spheres ?,? have been introduced, reaching light localization on the angstrom scale and field enhancements of up to 100–1000. Such nanogaps have found numerous applications over the past decade, including surface-enhanced Raman spectroscopy (SERS), ?,? (bio)sensing, ?,? and studies of the coupling of single molecules to gap modes ?,?−? ? and of the effects of electron tunneling and nonlocal screening ?,?,? on the light scattering spectra from subnanometer gaps. Freestanding, sharp conical metallic tapers reach a somewhat lower field enhancement in the range of 10. ?,? Such tapers offer flexible control over the nanogap formation, instrumental for the development of a wide range of scanning probe microscopy (SPM) techniques like scanning tunneling microscopy (STM)-induced luminescence, ?,?,? ultrafast STM, ?−? ? ? tip-enhanced Raman spectroscopy, ?,?−? ? ? and scattering-type scanning near-field optical microscopy (s-SNOM). ?−? ? ? In addition, coherent electron microscopy techniques such as photon-induced near-field electron microscopy? are rapidly developing as high-spatial-resolution local probes of optical near-fields. ?−? ?
Whereas the spatial confinement of nanogap fields has received much attention in the research community, experimental studies of the temporal dynamics of spatially highly localized fields are still scarce. Such measurements, although experimentally challenging, would be highly desirable, for example, for exploring the coherent coupling of quantum emitters to gap modes, ?,?,?,? for advancing SPM-based ultrafast coherent phonon spectroscopy, ?,? and for nonlinear nanoscale optics.? Recent work in this direction successfully recorded the dynamics of few-cycle terahertz fields emitted from a few-angstrom tip–sample junction,? and extensions of such studies to the visible range are currently underway. ?,? So far, however, amplitude- and phase-resolved spectroscopic studies of broadband light scattering from tip–sample junctions are mostly restricted to the infrared spectral range. They use Fourier transform spectroscopy ?−? ? ? or pseudoheterodyne SNOM ?,? as phase-sensitive detection methods yet, so far, do not retrieve full information about the local electric field dynamics.
Here we use high-repetition-rate spectral interferometry to measure the amplitude and phase of few-cycle visible to near-infrared light pulses that are scattered from the junction between a gold surface and a sharp gold tip. By varying the tip–sample distance we observe near-field-mediated spectral red shifts and line broadenings which allow us to quantify the local field enhancement. We retrieve the time structure of the local field at the tip apex with subcycle precision and show that the coupling of the tip to its image dipole results in a substantial reduction in pulse duration when the field is confined in the gap.
Experimentally, we introduce a broadband spectral interferometry technique to probe the amplitude and phase of the light that is scattered from the tip–sample junction of an s-SNOM (Figurea). For this, we focus few-cycle pulses from a Ti:sapphire laser with an 80 MHz repetition rate onto the apex of a sharp gold taper. By using an all-reflective microscope objective with a numerical aperture of 0.4, the pulse duration of 9 fs (full width at half-maximum of the intensity profile) is maintained in the ∼1 μm-sized focal region, as confirmed by a separate frequency-resolved interferometric autocorrelation measurement using an α-BBO crystal instead of the tip (see Supporting Information (SI) section 3). ?,? The light field that is scattered from the tip, the signal field E S(t), is recorded in back reflection through the same objective and focused into a single-mode fiber (SMF). Here, it is overlaid with a reference field E R(t) = E R(t)ê _ z _ = t R(t) ⊗ E 0(t – τ_0_) that is linearly polarized along ê _ z . E R is a replica of the incident field E 0(t) time-delayed by τ_0 and slightly distorted by its transmission through the interferometer with transmission coefficient t R(t). The Kronecker product (⊗) denotes the convolution of the two quantities. Both the signal and reference field are passed through a monochromator and a spectral interferogram (SI), given by ?,?
is recorded using a fast line scan camera. The intensity spectra of the reference field and signal field are I R(ω) = |E R(ω)|^2^ and I S(ω) = |E S(ω)|^2^, respectively. The detected signal field amplitude is E S(ω) = E S(ω)·ê _ z _. The repetition rate of the camera (E2V Aviiva EM4), 219 kHz, is sufficiently high to record phase-stable interferograms, unaffected by mechanical instabilities of the setup. The camera sensitivity of ∼60 photons/count allows us to probe the weak picowatt-level fields? that are scattered out of the gap junction.
We start by analyzing light scattering from the gap between a gold taper and a planar gold film with 250 nm thickness. The gold tip is formed by electrochemical etching? and has an apex radius of a 0 = 10 nm and a half-opening angle of θ = 18° (see SI section 2). We illuminate the tip–sample junction with linearly p-polarized light and record light scattering spectra as a function of tip–sample distance d, periodically modulating the distance at a tapping frequency of f t ≈ 25 kHz with a peak-to-peak amplitude of 52 nm. By measuring the tapping force, we set the minimum distance to approximately 1 nm.
While modulating the tip–sample distance, we continuously record SIs of the scattered light at the full repetition rate of the camera, i.e., one SI per 4.6 μs. In these measurements, the delay τ_0_ is set to −340 fs. A characteristic SI is depicted in Figureb, showing the spectrum of the reference laser in the range from 1.41 to 1.81 eV,? spectrally modulated by the interference with the weak signal field. The average modulation period of ∼12.5 meV is inversely proportional to τ_0_. The modulation contrast, taken as the difference between the signal intensities for constructive and destructive interference, is approximately 10% of the reference intensity across the entire spectral range. The measurements are performed with an average power of the detected reference field of ∼3 μW, while the total scattered field amounts to ∼2 nW. We note that such a high modulation contrast is reached because the SMF acts a spatial mode filter, suppressing light scattering from outside the apex region. In a single measurement, we record 30,000 consecutive SIs during a total measurement time of 0.15 s.
For each of these spectra, we extract the complex-valued spectral response function σ(ω) = |σ(ω)|e^i^ ^φ^ ^(ω)^ = E S(ω)/E 0(ω) that connects the amplitude and phase of the signal and the incident field. For this, we use a Fourier domain analysis ?,?,? that is described in SI section 5. Time-dependent variations of amplitude and spectral phase are shown in Figured,e, respectively. The data are compared to simultaneously recorded measurements of the tip–sample distance, shown as blue squares in Figurec. The blue line depicts the expected periodic tip–sample distance modulation.
Whenever the tip is far away from the gold surface, we find doubly peaked spectra with maxima near the lower- and higher-energy ends of the spectral range. When approaching the surface, the high-energy peak shows a red shift from 1.70 to 1.45 eV, correlated with a line broadening. The black circles denote the resonance energy of this peak as deduced from a Lorentzian oscillator model introduced below. The solid black lines depict the periodic variation of the resonance energy with sample distance. Also, the spectral phase φ(ω) shows distinct periodic modulation with tapping frequency. These distance-dependent line shape changes become more clearly visible after data averaging over a few thousand modulation cycles, as shown in Figure.
For such data analysis, a tip–sample distance d is assigned to each of the scattering spectra by using the curve in Figurec. Then the spectra are sorted as a function of d and grouped into 32 bins of 1024 spectra each. An average over all spectra in one bin gives the distance-dependent spectral response σ̅(ω, d _ j _) as a function of the tip–sample distance d _ j _ of bin j. The amplitude and spectral phase of σ̅(ω, d _ j _) are shown in Figurea,b, respectively. Most noticeably, the spectral amplitude shows a strong scattering resonance that is centered, for large distances, around 1.75 eV. Upon approach to the sample, this resonance red-shifts by more than 200 meV, in particular during the last 10 nm, i.e., when increasing the near-field coupling between tip and the gold substrate. This red shift is correlated with a change in the phase profile in the energy region of the resonance in Figureb. In addition, the response function reveals a second resonance in the red range of the spectrum. Its amplitude decreases gradually upon approach, while its resonance energy appears to be only weakly affected by near-field coupling.
When the gold layer is replaced with a purely dielectric substrate (Figurec,d), a silicon substrate covered with a 90 nm thick silicon dioxide layer, scattering resonances appear again in the same spectral range. Now, the blue resonance, resolved in both amplitude and spectral phase, is much weaker that the resonance in the red. Its red shift upon approach is much less pronounced than on gold. Also, the decrease in amplitude of the red resonance upon approach is reduced.
Based on these observations, specifically the pronounced red shift seen in Figurea, we associate the high-energy resonance with light scattering from the apex of our gold taper, assuming that the red shift is induced by near-field coupling of the apex dipole to its image dipole in the metal. Since the lower-energy resonance does not show such couplings, we tentatively assign it to light scattering from a higher-order mode of the conical gold taper. ?,? Only the lowest-order, rotationally symmetric mode of such a taper is a purely evanescent mode, while all higher-order modes are transformed into radiative modes at a finite distance from the apex.? The effective dipole moment of the higher-order mode is essentially oriented parallel to the surface, antiparallel to its image dipole induced in the gold film. Destructive interference therefore results in a decrease of the scattering amplitude upon approach, an effect that is less pronounced on a weakly reflecting dielectric substrate. To characterize the optical properties of apex and shaft mode, we fit σ̅(ω, d _ j _) to a sum of Lorentzian resonances, as discussed in SI section 5. Typical results of such fits for different distances are shown in Figuree–g as dotted lines. The extracted response functions of the apex mode are shown in Figureh–j. The red shift, line broadening, and decrease in amplitude upon approach are evident.
In nano-optics, such near-field couplings are often rationalized in terms of a phenomenological coupled-dipole model ?,?,? which treats the tip as a sphere of radius a 0. Its polarizability is given by the quasistatic response of its dipolar mode. The near-field coupling of this sphere to a planar sample results in an effective polarizability which alters both the amplitude and phase of the light that is scattered from the apex upon approach. To analyze the results in Figure, we consider only the longitudinal component of the polarizability, α_ zz _, pointing along the taper axis. We assume that its frequency dependence can be parametrized in terms of a Lorentz oscillator model? as
where ω_0_ is the resonance frequency and γ is the line width of the apex mode. We introduce a complex-valued field enhancement factor FE, with an amplitude |FE| that gives the enhancement of the near field at the bottom of the sphere (the taper apex) with respect to the incident field. The parameter ϕ_FE_ is introduced to model possible phase shifts between the incident and apex field. Such phase shifts are expected from extensive simulations of the optical field enhancement for such conical metal tapers.? They arise from the finite coupling between the apex near fields and evanescent modes propagating along the taper shaft. ?,?
As can be seen in Figure, the near-field coupling of the apex mode to the gold surface depends sensitively on this phase shift ϕ_FE_. In the simulation, we assume a Lorentzian response with ℏω_0_ = 1.62 eV, ℏγ = 0.12 eV, and |FE| = 18 to mimic the results in Figurea,b for large distances. In the absence of a phase shift, ϕ_FE_ = 0, the simulations predict a similar red shift of the apex resonance as observed experimentally. In this case, both the line width of the polarizability and its maximum amplitude remain unchanged upon approach. For small positive values of ϕ_FE_ we observe that the red shift is accompanied by both a line broadening and a reduction in amplitude upon approach, matching the signatures observed in Figure. For negative values of ϕ_FE_ we find instead a red shift accompanied by an increase in scattering amplitude and a concomitant line narrowing. Evidently, such negative phase shifts contrast with the experimental observations and are also not expected based on simulations of the field enhancement.? From these Lorentz oscillator simulations, we conclude that we can best describe the results in Figure by assuming a field enhancement factor of the apex mode of ∼18 and a phase shift ϕ_FE_ of about 0.2π. These parameters agree reasonably with those estimated from ref ? (∼15, ∼0.5π). The simulations also suggest that such a Lorentz oscillator model can describe reasonably well the spectral response of the apex mode. The microscopic origin of the observed distance dependence is readily understood in terms of a perturbative expansion of the effective polarizability in orders of the number of near-field reflections by the sample (see SI section 7). The general trends are captured by considering the interference between the tip polarizability and the first-order change in this polarizability induced by near-field reflection. For ϕ_FE_ = 0, constructive (destructive) interference between components on the low-energy (high-energy) side of the apex resonance results in a pure red shift without changes in line width and amplitude. For ϕ_FE_ = 0.2π, this symmetry is broken, and destructive interference dominates already at energies slightly below the resonance. This lies at the origin of the observed line broadening. Our model suggests that such line broadening is linked with a decrease in scattering amplitude upon approach.
With this information, we can now reconstruct the complete near-field dynamics at the apex of our gold taper and, importantly, the effect of near-field coupling on the dynamics. The successful description of the spectral response σ of the apex mode in terms of a Lorentz oscillator model shows that the near-field response r(t) = [σ(ω)] (where denotes the Fourier transform) in the time domain is well-described by an exponentially damped sine function r(t) = Θ(t)2γ|F m| sin(ω_0_ t – ϕ_FE_) exp(−t/T 2), where T 2 = 1/γ is the decay time, Θ(t) is the step function, and |F m| is the maximum field enhancement of the junction for tip–sample distance d. This response function gives the time dynamics of the electric field amplitude at the very apex of the gold taper for a fictious δ-pulse excitation. The distance-dependent parameters ω_0_, γ, and |F m |/|FE| can be directly taken from the measured spectral response. The complex-valued field enhancement is a material property of the taper that is independent of d. Its evaluation needs information that is encoded in the distance dependence of σ. The simulations in Figure show that a field enhancement of FE = 18e^i0.2π^ can characterize the properties of our gold taper reasonably well. Fixing this value provides quantitative access to the near-field electric field amplitude at the apex.
The resulting response functions are shown in Figurea,b. The approach to the gold surface not only results in a red shift of ω_0_ but also in a substantial reduction in the decay time T 2 of the near-field response, from 6.1 fs at large d to 2.7 fs at 1 nm distance. The distance dependence of the decay time is shown in Figuree. The thus-obtained linear near-field response is a property of the coupled tip–sample junction that is independent of the temporal structure of the driving field.
Since we know the time profile E 0(t) of our 9 fs incident pulses, we can also obtain the time structure of the local near field E NF(t) at the apex by direct convolution of E 0(t) with r(t). The results are shown in Figurec,d. The substantial compression of the few-cycle optical near field when the gap is closed should be noted. For large distances, the near field (red line in Figurec) lasts much longer than the incident pulse (blue line in Figurec). For small distances, the near-field response is so fast that the near-field and far-field dynamics become very similar. Worthy of note is the phase shift between the near field and far field, reflecting the finite phase of the complex-valued field enhancement.
The results of our analysis for the light scattering from the taper–gold surface junction are summarized in Figurea,c. It shows the distance-dependent amplitude (black circles), resonance energy (blue diamonds) and line width (red squares) of the apex mode as obtained from the Lorentz oscillator analysis. The effect of the near-field coupling on these parameters is reasonably well reproduced in our point-dipole model when the complex-valued field enhancement of the tip is taken into account. For our gold taper with an apex radius of ∼10 nm, the near-field coupling effects extend over slightly less than the radius. While the distance dependences of the amplitude and line width are quantitatively described by the point-dipole model, the resonance energy shows an additional longer-range shift that goes beyond the model.
To validate these conclusions, we use the same analysis for the SI measurements performed on the dielectric substrate. As shown in Figure S9, we can use the same Lorentz oscillator model to describe the distance-dependent spectral response σ̅(ω, d _ j _) (Figurec,d). In this case we need two shaft oscillators with distance-independent resonance energy and line width to accurately reproduce σ̅. The contribution of the apex mode to the scattering signal is much weaker than in the case of the gold film (Figure S11). Also, the effect of near-field coupling on the apex resonance is much reduced, showing a red shift of about 60 meV and a line broadening by about 30 meV upon approach (Figureb,d). Both distance dependences are again well-reproduced by the point-dipole model when considering the same complex-valued field enhancement as in the case of the gold surface. In contrast to the predictions of the point-dipole model, the measured amplitude of the apex oscillator shows a slight long-range increase upon approach. We think that this effect, not seen on the gold substrate with strong near-field scattering, mainly reflects residual light scattering from the taper shaft.
In summary, we describe and demonstrate a new technique for probing the electric near-field dynamics in the junction of a scanning probe microscope. Using spectral interferometry with few-cycle pulse excitation, we obtain the amplitude and phase of the light that is scattered from the junction between a gold taper and a gold surface. The near-field coupling between the apex dipole and its image dipole results in a pronounced red shift and line broadening of the apex resonance as the tip–sample gap is closed. We quantify the complex-valued field enhancement at the apex and obtain the local near-field dynamics with subcycle resolution. For this, we use spectral interferometry to extract the higher-order spectral phase of the near field scattered from the apex. From the experimentally observed line shape changes upon approach, we quantitatively extract the phase of the local near-field enhancement at the apex. Together, this provides the desired subcycle resolution of the near-field dynamics.
The parameters deduced for the field enhancement of the gold taper and its phase shift agree reasonably with state-of-the-art finite difference time domain simulations.? Such simulations predict the smooth dependence of these parameters on the tip geometry, specifically the opening angle and apex radius. The measurement technique demonstrated here should allow quantification of the relationship between complex field enhancement and tip geometry in future work. Importantly, the present measurements demonstrate that near-field coupling results in a substantial temporal compression of the few-cycle optical near field for small tip–sample distances. Our results pave the way toward direct time-domain studies of local optical near fields in the visible with substantial importance for probing the local linear and nonlinear response of individual nanostructures with high temporal and spatial resolution.
Supplementary Material
The reference list from the paper itself. Each links out to its DOI / PubMed record.
- 1Novotny, L. ; Hecht, B. Principles of Nano-Optics; Cambridge University Press, 2012.10.1017/CBO 9780511794193. · doi ↗
- 2Zhang R.Zhang Y.Dong Z. C.Jiang S.Zhang C.Chen L. G.Zhang L.Liao Y.Aizpurua J.Luo Y.Chemical mapping of a single molecule by plasmon-enhanced Raman scattering Nature 20134987452828610.1038/nature 1215123739426 · doi ↗ · pubmed ↗
- 3Chikkaraddy R.de Nijs B.Benz F.Barrow S. J.Scherman O. A.Rosta E.Demetriadou A.Fox P.Hess O.Baumberg J. J.Single-molecule strong coupling at room temperature in plasmonic nanocavities Nature 2016535761012713010.1038/nature 1797427296227 PMC 4947385 · doi ↗ · pubmed ↗
- 4Scholl J. A.García-Etxarri A.Koh A. L.Dionne J. A.Observation of Quantum Tunneling between Two Plasmonic Nanoparticles Nano Lett.201313256456910.1021/nl 304078 v 23245286 · doi ↗ · pubmed ↗
- 5Berndt R.Gaisch R.Gimzewski J. K.Reihl B.Schlittler R. R.Schneider W. D.Tschudy M.Photon Emission at Molecular Resolution Induced by a Scanning Tunneling Microscope Science 199326251381425142710.1126/science.262.5138.142517736824 · doi ↗ · pubmed ↗
- 6Zenhausern F.Martin Y.Wickramasinghe H. K.Scanning Interferometric Apertureless Microscopy: Optical Imaging at 10 Angstrom Resolution Science 199526952271083108510.1126/science.269.5227.108317755529 · doi ↗ · pubmed ↗
- 7Baumberg J. J.Aizpurua J.Mikkelsen M. H.Smith D. R.Extreme nanophotonics from ultrathin metallic gaps Nat. Mater.201918766867810.1038/s 41563-019-0290-y 30936482 · doi ↗ · pubmed ↗
- 8Benz F.Chikkaraddy R.Salmon A.Ohadi H.de Nijs B.Mertens J.Carnegie C.Bowman R. W.Baumberg J. J.SERS of Individual Nanoparticles on a Mirror: Size Does Matter, but so Does Shape J. Phys. Chem. Lett.20167122264226910.1021/acs.jpclett.6b 0098627223478 PMC 4916483 · doi ↗ · pubmed ↗