Transboundary Animal Diseases Associated With Cross‐Border Camel Movement. A Systematic Review and Meta‐Analysis
Alex A. Adikwu, Theophilus I. Emeto, Paul F. Horwood, Olajide A. Owolodun, Andrew M. Adamu, Oyelola A. Adegboye

TL;DR
This study reviews how cross-border camel movements contribute to the spread of transboundary animal diseases, emphasizing the need for coordinated surveillance and control strategies.
Contribution
The study provides a systematic review and meta-analysis of zoonotic transboundary animal diseases linked to camel movements, highlighting regional trends and research gaps.
Findings
Fifteen zoonotic transboundary animal diseases were identified, with MERS and Rift Valley fever being the most prevalent.
Camel cross-border movements, especially through informal trade and nomadic practices, increase the risk of disease spread.
Harmonized surveillance and One Health approaches are urgently needed to control zoonotic disease transmission.
Abstract
Transboundary animal diseases (TADs) are contagious diseases that significantly impact livestock health, public health and economic stability. In regions with frequent cross‐border trade and transhumance involving camels, particularly the Middle East and Africa, TADs pose a heightened One Health risk due to their zoonotic potential and capacity to spread rapidly across national boundaries. This review synthesises current knowledge on TADs, with a focus on zoonotic pathogens affecting camels involved in cross‐border movement, identifies geographical trends, and highlights research gaps to inform surveillance and control strategies. We conducted a comprehensive search across Ovid Medline, PubMed, Web of Science, Scopus, and Cochrane databases without time restrictions. Eligible studies were assessed for study quality and risk of bias using the Joanna Briggs Institute Critical Appraisal…
Genes, proteins, chemicals, diseases, species, mutations and cell lines named across the full text — each resolved to its canonical identifier and authoritative record.
Click any figure to enlarge with its caption.
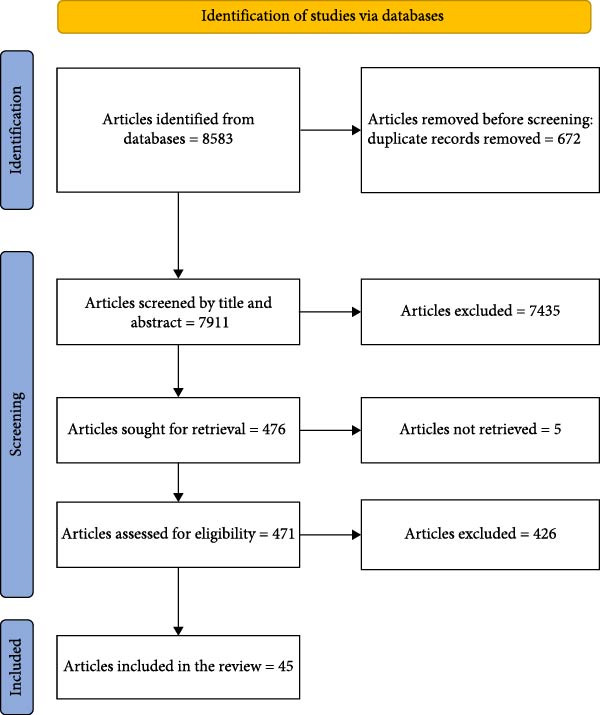 Figure 1
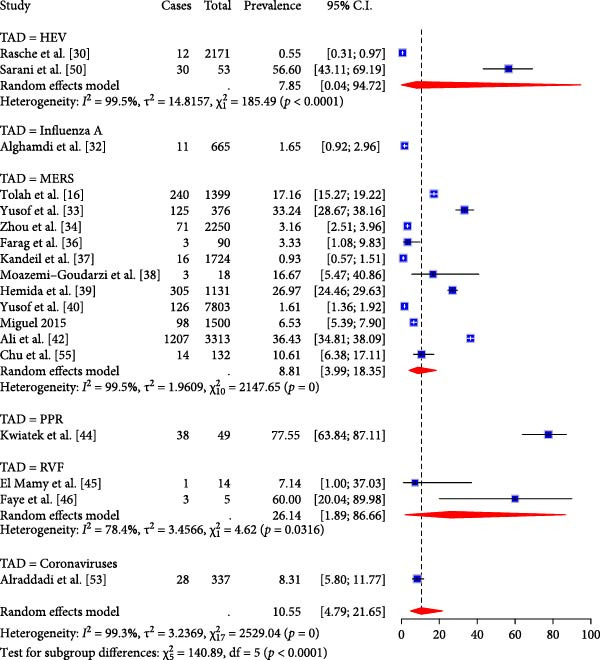 Figure 4
| Covariate | Estimate | SE | I2 (%) |
|
|
|---|---|---|---|---|---|
| Year | −0.02 | −0.23 | 99.69 | 0 | 0.798 |
| Study region | — | — | 99.69 | 0 | 0.924 |
| Algeria | 1.94 | −7.39 | — | — | 0.446 |
| Nigeria | 0.82 | −5.76 | — | — | 0.576 |
| TAD type | — | — | 99.73 | 0 | 0.508 |
| MERS | 2.37 | −4.93 | — | — | 0.059 |
| RVF | 2.06 | −5.72 | — | — | 0.158 |
| Management | — | — | 99.7 | 0 | 0.997 |
| Imported | 0.14 | −7.20 | — | — | 0.938 |
| Imported/local | 0.13 | −7.24 | — | — | 0.943 |
| Lab technique | — | — | 99.63 | 12.11 | 0.021 |
| Molecular | −0.34 | −9.61 | — | — | 0.889 |
| Serology | 1.58 | −9.50 | — | — | 0.516 |
| Covariate | Estimate | SE | I2 (%) |
|
|
|---|---|---|---|---|---|
| Overall model | — | — | 99.5 | 36.38 | 0.0002 |
| TAD type | — | — | — | — | — |
| MERS | 4.10 | 1.06 | — | — | 0.0001 |
| RVF | 2.27 | 1.23 | — | — | 0.066 |
| Management | — | — | — | — | — |
| Imported | −3.21 | 1.85 | — | — | 0.083 |
| Imported/local | −2.53 | 1.82 | — | — | 0.164 |
| Lab technique | — | — | — | — | — |
| Molecular | −4.72 | 2.45 | — | — | 0.054 |
| Serology | −1.24 | 2.33 | — | — | 0.594 |
| Author/year | Study period and location | TADs | Camel source/raring system | Samples /specimen | Method/ technique |
|---|---|---|---|---|---|
| Viral TADs | |||||
| [ | Tunisia 2016 | Bluetongue and West Nile fever | Pastoralists intercepted in Tunisian cities bordering Libya and Algeria | Serum | ELISA |
| [ | Egypt | Bovine viral diarrhoea, Rift Valley fever | Sudan and Egypt | Serum | ELISA |
| [ | Kenya | Camel pox | Kenya/Somali border | Skin lesion | Neutralisation test |
| [ | Saudi Arabia, 2017–2019 | Hepatitis E | Imported and local farms in Sudan, Djibouti, Saudi Arabia | Serum | RT‐PCR |
| [ | 1983 1983–1984 1997 1992–2015 2013 2012–2015 | Hepatitis E | Sudan, Somalia, Egypt, Kenya, Pakistan, UAE | Serum Faeces | ELISA, RT‐PCR |
| [ | SA, 2016–2018 | Hepatitis E | Imported and local farms in Sudan, Djibouti, Saudi Arabia | Serum | ELISA |
| [ | SA, 2017–2018 | Influenza A | Imported and local farms in Sudan, Djibouti, Saudi Arabia | Nasal swabs | RT‐PCR |
| [ | SA, 2017–2019 | MERS | Imported and local farms in Sudan, Djibouti, and Saudi Arabia. | Serum Faeces | Microneutralization assay and RT‐PCR |
| [ | UAE, April–March 2015 | MERS | UAE, Oman, Unknown | Nasal swabs | PCR |
| [ | Ethiopia. January 2017–September 2020 | MERS | Ethiopia border regions | Nasal and turbinate swabs | PCR |
| [ | Eastern Africa. June–July 1984, June–July 1997, January 1983–December 1984 | MERS | Eastern Africa | Serum | ELISA and microneutralization assay |
| [ | Ethiopia, 2015, 2017 | MERS | Sudan, Qatar | Serum nasopharyn‐geal nasal | ELISA, RT‐PCR |
| [ | Egypt, April 2016–March 2018; Senegal, August–September, 2017; Uganda, February–March 2017; Tunisia, December 2015–January 2018; KSA, November 2015–October 2016; Iraq, January–17 | MERS | Egypt/Sudan | Serum and nasal swabs | Microneutralization assay for serum, RT‐PCR for nasal swabs |
| [ | Iran, 2014 | MERS | Imported, Pakistan‐Iran border | Nasal and rectal swabs | RT‐PCR |
| [ | KSA, January 2016–Mar 2018 | MERS | Local and imported from Somalia/Sudan | Nasal and rectal swabs | RT‐PCR |
| [ | UAE, February–September 2014 | MERS | UAE, UAE borders with KSA/Oman | Nasal swabs | RT‐PCR |
| [ | Burkina Faso, February–Mar, 2015 | MERS | Burkina Faso, Ethiopia, Morocco | Serum and nasal swabs | Microneutralization assay and RT‐PCR |
| [ | January 2015–December 2016 | MERS | Imported‐Sudan | Serum | ELISA |
| [ | Egypt, Jun 2014–February 2016 | MERS | Imported/local‐ Somalia/Sudan/Ethiopia | — | — |
| [ | KSA, 1993, 2014 | MERS | KSA, Australia | Serum |
Microneutralization assay Pseudoparticle neutralisation test |
| [ | Sudan, Morocco. 2000–2009 | PPR | Sudan | Lungs, liver, spleen | RT‐PCR |
| [ | Maritania, October–10 | RVF | Mauritania | Serum | Nested RT‐PCR |
| [ | Maritania, October–December 2010 | RVF | Mauritania | Serum | PCR |
| [ | Kenya, 2000–2007 | RVF | Kenya high trade/border | Serum | ELISA |
| [ | Nigeria, November 2016–April 2017 | RVF | Nigeria/Sahel region | Serum | ELISA |
| [ | Nigeria | RVF | Nigeria/Chad/Niger | Serum | ELISA |
| [ | Nigeria | Influenza A | Nigeria/Sahel region | Serum | ELISA |
| [ | Nigeria, November 2016–April 2017 | Hepatitis E | Nigeria/Sahel region | Serum | ELISA |
| [ | Nigeria | MERS | Nigeria/Sahel region | Serum | ELISA |
| [ | Iran, January–June 2019 | HEV | Iran, imported from Pakistan and Afghanistan | Blood and liver | RT‐PCR |
| [ | Algeria, June 2021–August 2022 | CCHV | Imported, local and unknown | Serum | ELISA |
| [ | Algeria, June 2021–August 2022 | RVF | Imported and local | Serum | ELISA |
| [ | KSA | Coronaviruses (CoVs) | Imported from Djibouti and Sudan | Nasal swabs | RT‐PCR |
| [ | Nigeria | CCHV | Nigeria and neighbouring countries | Serum | ELISA |
| [ | Nigeria | MERS | Nigeria, Chad, Libya, Mali, Niger and Sudan | Nasal swabs and serum |
–RT‐qPCR –MERSspike pseudoparticle neutralisation test (ppNT) |
| [ | Nigeria, October–December 2016 | MERS | Niger Republic | Serum | ELISA |
| Bacterial TADs | |||||
| [ | Egypt, Jun 2018–January 2019 | Brucellosis | Imported from Sudan | Serum | Buffered Plate Antigen test, Rose Bengal test, ELISA |
| [ | Nigeria | Brucellosis | Herds and slaughterhouses along the Nigeria‐Niger border | Serum |
Modified Rose Bengal plate test (RBPT) Serum Agglutination test (SAT) |
| [ | Ethiopia | Brucellosis | Ethiopia and from Somalia | Serum | Rose Bengal plate test |
| [ | Slovenia 2004 | Tuberculosis | Slovenia | — | Tuberculin test |
| [ | Eritrea, October–November, 2013 and September–December, 2014 | Bovine tuberculosis | Pastoral, herds Eritrean border | — | Tuberculin test |
| [ | Algeria. July 2018–Jun 2019 | Q‐fever | Algeria/Tunisia border | Serum | ELISA |
| [ | Egypt, November 2015 – March 2016 |
Brucella Q‐fever | Imported from Sudan | Serum | ELISA |
| Parasitic TADs | |||||
| [ | Egypt, November 2014– February 2016 | Toxoplasmosis | Imported | Serum | Latex agglutination test, ELISA |
| [ | Kenya, March–92 | Trypanosomosis | Imported | Blood | Xenodiagnosis DNA probe |
Peer Reviews
No public reviews on file for this paper yet. If you reviewed it on a platform where reviews are public (OpenReview, ICLR, NeurIPS, ICML), you can paste yours below so the community can read it here.
Videos
No videos yet. Explain this paper in a talk, walkthrough, or lecture? Add one.
Taxonomy
TopicsAnimal Diversity and Health Studies · Animal health and immunology · Brucella: diagnosis, epidemiology, treatment
1. Introduction
Transboundary animal diseases (TADs) are contagious diseases that are detrimental to the economy of countries; they can quickly spread to other nations, escalating into epidemic proportions, necessitating international cooperation for control and eradication [1, 2]. The Food and Agriculture Organization [3, 4] and World Organization for Animal Health (WOAH) [5] list of emerging TADs includes Middle East respiratory syndrome (MERS), severe acute respiratory syndrome (SARS), highly pathogenic avian influenza (HPAI), West Nile fever (WNF), Rift Valley fever (RVF), Crimean Congo haemorrhagic fever (CCHF), lumpy skin disease (LSD), bovine spongiform encephalitis (mad cow disease caused by prion), African horse sickness, bluetongue (BT), peste des petits ruminant (PPR), foot‐and‐mouth disease (FMD), African swine fever (ASF), contagious bovine pleuropneumonia (CBPP), Hendra, Nipah, Ebola, and Zika virus diseases [6–8].
TADs have the potential to endanger the world’s food production and supply through impacts to animal production, trade barriers that limit the movement of live animals and animal products, production deficiencies brought on by the loss of animal power, or even through a decrease in human productivity in the case of zoonoses [9–11]. Although attention is primarily focused on domestic livestock such as cattle, sheep, goats, and companion animals like dogs and cats, recently there has been growing attention on camels [12, 13], donkeys, and horses due to their increasing role in TAD transmission dynamics [14, 15].
Old‐World camelids, including the Bactrian camel (Camelus bactrianus) and dromedary camel (Camelus dromedarius), as well as New‐World camelids such as the alpaca (Vicugna pacos) and llama (Lama glama), can serve as potential sources of infectious diseases [16–18]. Camelids are generally known for their adaptive features and resilience to extremely harsh environments and climatic conditions [19]. These capabilities have created the perception that camels are resistant to infectious diseases commonly affecting other domestic animals, resulting in them receiving little or no veterinary attention. However, research has now shown that camels are sensitive to various infectious diseases and may potentially be reservoirs for pathogens of veterinary and public health importance [20].
Globally, there are ~30 million dromedary camels, predominantly distributed across the Middle East and Africa [21–23]. Although considered wild, the population of camels in Australia is estimated at 400,000, with a significant portion destined for export to national and international markets for meat and milk production [24, 25]. In Europe and the USA, camel populations are relatively small, with an estimated 5,000 and 3,000 animals, respectively. Nevertheless, information regarding trans‐border movement, commercial activities, and camel disease studies remains limited and largely undocumented in many regions of the world [26].
Over the years, camel migration, international trade, and trans‐border movements of camels and camel products have significantly increased the transmission and spread of TADs [24, 27]. For instance, a study carried out in Saudi Arabia found that 86.3% of 1257 imported camels, primarily from Sudan and Djibouti, were seropositive for MERS [28]. Another study detected brucellosis in camels imported into Ethiopia [29]. These findings can be linked to the cross‐border camel trade from the Greater Horn of Africa (GHA) to Middle Eastern countries, which represents the largest global camel market [27], with an estimated 250,000 to 300,000 camels exported annually from Sudan and Somalia [30, 31]. Furthermore, the Birqash market in Egypt (the largest market in the GHA) receives camels from Eritrea, Ethiopia, Somalia, Kenya, and Sudan [32]. In addition to the import and export of camels in the Sahelian region, unrestricted transhumance routes and drought caused by changing climate conditions are contributory factors in TAD spread [33, 34].
Although camels can facilitate cross‐border transmission and pose zoonotic risks, global data on the prevalence of TADs in transported camels remains limited. Therefore, to inform surveillance and control strategies, this review aimed to (i) synthesise current knowledge on TADs, with a focus on zoonotic pathogens affecting camels involved in cross‐border movement, (ii) identify the research gaps, and (iii) compile data on the prevalence and risk factors of these pathogens in camels involved in international trade and transhumance.
2. Materials and Methods
We conducted this review in accordance with the PRISMA 2020 guidelines and were informed by the protocols from established systematic review reporting frameworks, as outlined by Page et al. [35].
2.1. Search Strategy
Five databases (Ovid Medline, PubMed, Web of Science, Scopus, and Cochrane) were searched to comprehensively assess published articles [36]. No restrictions were placed on the search period. The search strategy used two approaches. First, we undertook a general search; search terms relating to animal subjects included “camel ^∗^” and “dromedar ^∗^”. For diseases, the terms “zoono ^∗^”, “transboundary”, “emerging”, and “re‐emerging” were initiated using the Boolean operator “OR” with combinations relating to TADs of camels. Disease and population searches were then combined using the Boolean operator “AND” ("Emerging diseases” OR “Re‐emerging diseases” OR “Transboundary diseases” AND “Zoonotic diseases” OR Zoonos ^∗^ AND Camel ^∗^ OR Dromedar ^∗^ AND “Camel‐borne diseases” AND “Public health impact” OR “Animal‐to‐human transmission” OR “One Health approach” AND “Prevention and control strategies” OR “Camel trade” OR “Disease outbreaks in camels"). This was developed to capture general literature on zoonotic TADs of camels.
Second, disease‐specific searches were conducted for TADs listed by FAO and WOAH with known zoonotic potential and significant public health impact, such as MERS, RVF, and HEV. Search strings for specific diseases were generated by combining the scientific name(s) of the disease (such as MERS), alternative name or known abbreviation, if any (e.g., MERS), and aetiology (e.g., MERS‐CoV), and then combined with the study population (Camel ^∗^ OR Dromedar ^∗^) using the Boolean operator “AND”. We then assessed the inclusion criteria and search phrases before proceeding with the searches.
2.2. Inclusion and Exclusion Criteria
Prevalence and/or risk‐factor studies, which may be a case study, longitudinal study, or outbreaks with natural infection of a zoonotic TAD detected in camels transported across country borders, were considered satisfactory for the review. The exclusion criteria included diseases not considered in the FAO, WOAH list of TADs, articles not written in English, review papers, conference proceedings, and grey literature such as media articles and unpublished government reports.
2.3. Study Selection
All articles, irrespective of language barriers and timeframe, were included. After searching, retrieved articles were exported to Rayyan software for systematic review [37]. The records were merged into a single library, and duplicates were checked. A second de‐duplication was also carried out using Rayyan. Articles’ titles and abstracts were separately reviewed by two reviewers, who then verified if the work satisfied the inclusion criteria. The study selection process is illustrated in Figure 1, which presents the PRISMA flow diagram detailing the number of articles on TADs retrieved and included for data extraction.
Preferred reporting items for systematic reviews and meta‐analyses (PRISMA) flow diagram detailing the number of articles on camel TADs retrieved and selected for data extraction.
2.4. Quality Assessment
A full‐text review was conducted to evaluate the quality of the eligible studies. The Joanna Briggs Institute (JBI) Critical Appraisal Checklist was adopted to assess prevalence studies [38]. The quality assessment of the included studies was conducted independently by two researchers. The evaluation results were then combined by one author using a Microsoft Excel spreadsheet. Ten modified questions from the JBI critical appraisal tool, with the options “yes”, “no”, “unclear”, and “not applicable”, were incorporated to guide us during the assessment. The proportions of yes responses among all yes, no, and unclear responses for each article were used to create three groups based on a scoring range: low (<50%), medium (≥50% to ≤70%), and high (> 70%). Disagreements were resolved through discussion.
2.5. Data Extraction and Statistical Analysis
From each included study, the following variables were extracted: author and year of publication, study period, geographical location, the specific TAD investigated, the reported prevalence of the TAD, origin of camel samples, age, sex, the type of biological samples or specimen analysed (serum, nasal swab, rectal swab, milk, faeces or urine), camel management system (imported or mixed with local) and diagnostic method or laboratory technique used for pathogen detection (serology or molecular).
We calculated the prevalence of TADs as proportions and 95% confidence intervals (CIs). As we anticipated considerable between‐study heterogeneity [39], a random‐effects model with logit transformation was used to estimate pooled prevalence effect sizes. CIs around the pooled prevalence estimates were calculated using the normal approximation method based on the summary measure (Supporting Informations 1–4: Figures S1–S4). Heterogeneity was assessed using between‐study variance (τ ^2^) and the proportion of total variance due to heterogeneity (I ^2^ statistic). Publication bias was assessed using funnel plots (Supporting Information 5: Figure S5). To explore potential sources of between‐study heterogeneity, we conducted meta‐regression analysis. Univariate and multivariable meta‐regression models evaluated the influence of study covariates, including diagnostic technique (serological vs. molecular), type of TADs, and camel management (e.g., imported vs. local or mixed) (Tables 1 and 2). All statistical analyses were conducted in R version 4.3.1 using the functions for meta‐analysis of proportions.
3. Results
3.1. Search Results
The search returned a total of 8583 publications from five databases. The titles and abstracts of 7911 papers were screened to ensure compliance with the target population after removing 672 duplicates. Subsequently, 7453 papers were excluded for neither involving camels (imported or engaged in cross‐border movement) nor the camel source/rearing system and TAD criteria. A total of 471 papers were then assessed for eligibility by the reviewers, of which 45 were subjected to a data extraction process based on the inclusion and exclusion criteria (Figure 1). Overall, Table 3 summarise the key findings by disease type and region, while the full dataset is presented in Supporting Information 6: Table S1.
3.2. Geographic Distribution of TADs
Overall, 45 articles published between 1994 and 2024 reporting TAD pathogens in camels were included in this study (Figure 2). Most studies were from Egypt, Nigeria, Saudi Arabia, and Kenya (Figure 2A), and the surge in research output began around 2014, notably due to RVF and MERS (Figure 2B). Fifteen prominent TADs were included in the studies; MERS (34%) dominated the literature, followed by RVF (15%), hepatitis E (11%), and brucellosis (9%) (Figure 2C). Overall, the study revealed that 97% of camel trade, importation, and movement occur between the Middle Eastern countries, Northern, Eastern, and parts of Western Africa. Among the 21 countries included in this review, those in the Middle East and North Africa (MENA) region were most prominently represented, with camel exports concentrated primarily in the Sahelian region. The leading exporters identified in the study were Sudan (29.7%), Somalia (16.2%), and Nigeria (13.5%).
Figure 2. Study characteristics: (A) geographical distribution of included studies, (B) year‐wise distribution of studies on TADs in camels from 1994 to 2024, and (C) country‐wise distribution of studies on TADs in camels. BT, bluetongue disease; BVD, bovine viral diarrhoea; CCHV, Crimean Congo haemorrhagic fever; CP, camel pox; HEV, hepatitis E virus infection; MERS, Middle East respiratory syndrome; PPR, peste des petits ruminant; RVF, Rift Valley fever; TB, tuberculosis; Toxo, toxoplasmosis; Tryps, trypanosomosis; WNF, West Nile fever.(A)(B)(C)
3.3. Distribution of TADs by Age, Sex and Samples Analysed
The biological samples examined for TAD detection across studies were mostly serum (72.7%) and nasal swabs (27%). Other biological samples analysed included skin lesions, faeces, rectal swabs, milk, urine, liver, lungs, and spleen. Sex was reported in 10 (27%) of the included studies, with a greater proportion of male camels (64.4%) sampled compared to females (35.6%). Age was specified in eight studies (21.6%), where camels aged 1 year and above accounted for the majority (94.6%), while only 5.4% were under 1 year.
3.4. Distribution of TADs by Disease Type
3.4.1. Viral TADs
Viral TADS were the most reported, comprising 29 articles (78.7%). MERS was the most frequently studied (n = 16, 34%), with camels mainly originating from Sudan (42.8%), Saudi Arabia (28.6%), and the Horn of Africa (Somalian and Ethiopian borders, 21.4%). Nasal swabs and serum (64.3% each) or a combination (42.8%) were the most tested specimens analysed for laboratory detection of MERS. Faecal, rectal, milk, and urine samples have also been screened for MERS [57]. Reverse transcription polymerase chain reaction (RT‐PCR) was used in 71.4% of studies for viral detection, typically targeting the E gene and confirmed by the open reading frame (ORF) 1a or N gene. Serological detection relied on microneutralization assay (MNA) (42.9%) and enzyme‐linked immunosorbent Assay (ELISA) (28.6%), often in combination (42.9%). Overall, reported MERS seroprevalence ranged from 71% in Egypt [57] to 100% in Nigeria [34], with higher rates in older camels (96.5%) than younger ones and in females (94%) compared to males (91%) [28]. However, RT‐PCR positivity was more common in males (24.3%) [28] in some studies, though findings were inconsistent across sex and age [47].
We identified 7 (15%) studies on RVF, with serum used exclusively. ELISA was more commonly employed than PCR. Seroprevalence ranged from 7.1% in Mauritania [60] to 94.8% among camels from Sahelian countries [68]. The seroprevalence of RVF was not consistent with the sex or age of camels. El Bahgy et al. [41] reported higher seroprevalence in younger camels (19.2%) than in adults (12.6%) and a higher seroprevalence in males (21.4%) than in females (9.2%), while Musa et al. [63] detected a lower seroprevalence in younger camels (6.9%) compared to adults (21.1%) and a lower seroprevalence in males (20%) than in females (9.2%). Molecular analysis has detected RVF virus strains in studies conducted in West Africa in Zimbabwe, Kenya, South Africa, and Uganda [60],[61]].
There were five articles (10.6%) on the hepatitis E virus (HEV), which was detected in camels imported from various parts of Africa (Sudan, Somalia, Egypt, and Kenya) and the Middle East (Saudi Arabia, the UAE, and Pakistan). Sarani et al. [66] detected the highest seroprevalence (56.6%) from serum samples using ELISA. Rasche et al. [44] also detected HEV in 1.9% of faecal samples from the UAE using RT‐PCR in another study. Sex as a risk factor for HEV in camels was inconsistent among studies. Adamu et al. [64] reported higher seroprevalence in females than males (45.8% vs. 25%). However, in the study by ElKafrawy et al. [45], sex was significantly associated with the detection of HEV (p‐value = 0.015, OR = 6.7), where males (31.6%) appeared more infected than females (13.4%). Although older camels (> 3 years) showed a higher seroprevalence of HEV [45, 64], the age of the camels was not significantly different.
Two studies (5.4%) on influenza A in camels were identified. Alghamdi et al. [46] detected influenza A virus in 1.7% of nasal swab samples collected from camels imported from Sudan and Djibouti and local farms in Saudi Arabia using RT‐PCR. Following partial genome sequencing, isolates showed a close relationship between human and swine influenza A isolates from different countries. Another study [64] carried out on camels across the Nigeria‐Sahel border region revealed 10.3% seroprevalence from serum analysed. Single studies also reported bluetongue (25.8%) and WNF (5.9%) in Tunisian camels [40], bovine viral diarrhoea (BVD) (33%) in Egyptian camels [41], camelpox (15.5%) in Kenyan camels [42], and PPR (77.6%) in Sudanese camels [59].
3.4.2. Bacterial TADs
A total of three (8.1%) studies focused on brucellosis, with seroprevalence ranging from 4.9% in camels from Ethiopia/Somalia [29], 8.6% in camels imported from Sudan [73], and 11.5% in the Nigeria‐Sahel border [74]. Two studies (5.4%) assessed tuberculosis, detecting positive skin test responses in Slovenia [75] and Eritrea [76], indicating possible cross‐border transmission. Q‐fever was reported in two studies (2.7%), with 75% seroprevalence at the Algeria‐Tunisian border and 4.3% in Egypt [77] and [78]. Male and older camels tended to have higher seroprevalence.
3.4.3. Parasitic TADs
Two studies reported parasitic infections: toxoplasmosis [81] and trypanosomosis [82]. Toxoplasmosis had a 35.7% seroprevalence in imported camels [79], while Trypanosoma simiae was detected at a seroprevalence of 14.3% in a small sample size using xenodiagnosis and a DNA probe [80].
3.5. Pooled Prevalence Estimates
The seroprevalence was higher in studies that adopted serological assays for screening for TADs (44.73%, 95% CI: 27.24; 63.63) than the prevalence observed using molecular techniques (10.55%, 95% CI: 4.79; 21.65) in the subgroup analysis (Figure 3A). Regarding the potential variations among the different TADs considered in this study, MERS seropositivity had the highest pooled effect size (84.12%, 95% CI: 67.72; 93.04, I^2^ = 99.1%, τ ^2^ = 2.3, p < 0.0001) while RVF and HEV were 37.88% (95% CI: 10.10; 76.80, I^2^ = 98.3%, τ ^2^ = 3.7, p < 0.0001) and 16.02% (95% CI: 3.56; 49.66, I^2^ = 98.7%, τ ^2^ = 2.8, p < 0.0001) respectively (Figure 3B). Subgroup analysis of TAD prevalence based on molecular detection revealed only five diseases, with studies on RVF showing the highest pooled effect size (26.14%, 95% CI; 1.89; 86.66, I^2^ = 78.4%, τ ^2^ = 3.5, p = 0.03) compared to MERS (8.81, 95% CI; 3.99; 18.35, I^2^ = 99.5%, τ ^2^ = 1.96, p = 0) and HEV (7.85%, 95% CI; 0.04; 94.72, I^2^ = 99.5%, τ ^2^ = 14.8, p < 0.0001) even though studies on MERS were the most predominant (Figure 4). The high I^2^ values (> 90%) across pooled estimates suggest substantial heterogeneity, likely due to differences in diagnostic methods, camel management systems, and study designs. Moreover, sensitivity analyses stratified by diagnostic technique (serology vs. molecular) revealed significant variation in prevalence estimates (Figure 3A).
Figure 3(A) Subgroup analysis of the overall TADs study by laboratory technique. (B) Subgroup analysis of TADs studies by serology.(A)(B)
Subgroup analysis of TADs by molecular detection.
3.6. Meta‐Regression
Univariate meta‐regression analyses (Table 1) revealed that study period (p = 0.798), geographical region of study (p = 0.924), type of TAD (p = 0.508), and camel management system (p = 0.997) were not significantly associated with pooled prevalence estimates and explained none of the observed heterogeneity (R ^2^ = 0.00%). Diagnostic technique was the only covariate significantly associated with prevalence estimates (p = 0.02), accounting for 12.11% of the heterogeneity observed (p = 0.02, R ^2^ = 12.11%). This finding indicates that serological methods tend to yield higher prevalence rates than molecular techniques and underscores the need for harmonised diagnostic protocols in camel surveillance. A multivariable mixed‐effects meta‐regression model incorporating diagnostic and laboratory techniques, the type of TAD, and the camel management system explained a larger proportion of heterogeneity. All three covariates were significantly associated with the prevalence of TADs and accounted for 36.38% of the heterogeneity (R ^2^ = 36.38%, p < 0.001) (Table 2).
4. Discussion
4.1. Key Findings
This meta‐analysis and systematic review identified 15 TADs related to cross‐border camel movement, with viral pathogens predominating in the literature. MERS‐CoV was the most reported and widespread infection, especially in camels in the Horn of Africa and the Middle East, indicating both its endemic circulation and the extent of camel trade between these regions and others. RVF virus and HEV were also regularly identified in several countries, and it is important to note that camels were identified as potential reservoirs or bridging hosts of emerging zoonoses of public health concern. Aggregated seroprevalence rates were considerably higher than molecular diagnostic prevalence rates, and the diagnostic method was the most significant source of heterogeneity across studies, highlighting the impact of surveillance and diagnostic methods on reported disease burden.
Global camel populations have grown significantly over the past three decades, driven by increasing demand for camels and camel products, particularly in the Middle East and Africa [10, 83, 84]. The Horn of Africa, including Ethiopia, Eritrea, Somalia, Djibouti, Kenya, Sudan, South Sudan, and Uganda, remains the primary source of camel exports and hosts the world’s largest camel population [85]. Despite this, research output from the region remains limited, suggesting potential under‐investment in disease surveillance relative to the scale of camel production and trade.
Studies yielded inconsistent outcomes due to varying designs, making direct comparisons between studies challenging. While some studies reported higher seroprevalence of TADs in male camels than in females [64, 77], these outcomes may have been influenced by several factors. For instance, female camels are kept primarily for breeding and milk production, making them the predominant sex encountered during sampling. In contrast, male camels are primarily used for meat production and transportation; hence, they are the predominant sex found in slaughterhouses, quarantine facilities, and cross‐border trade. In terms of age, calves are more susceptible to infection than older camels due to their immature immune systems and may therefore shed more TAD pathogens [86]. Moreover, older camels exhibited long‐lasting immune responses against diseases from multiple reinfections [83].
Since it was first identified in Saudi Arabia in 2012, [87] MERS‐CoV has remained a major transboundary disease associated with cross‐border camel trade and has caused at least 947 human fatalities globally [88]. Bats are believed to be the original reservoir of Middle East respiratory syndrome coronavirus (MERS‐CoV), but the virus now primarily circulates in dromedary camels, which serve as the main source of human infections ([89, 90]). This review identified studies reporting high MERS‐CoV seroprevalence in camels, mainly in Africa and the Middle East, suggesting the endemicity of the virus across the region. This may be attributed to the robust international camel trade between Middle Eastern countries and those in the Horn of Africa [32]. Pastoralists in the GHA control 60% of the world’s dromedary camels; Somalia alone is home to one‐third of the world’s dromedary camels and a major hub for cross‐border movement and export [91]. Furthermore, despite rapid advances in MERS‐CoV detection techniques such as serological assays and RT‐PCR, research on camel TADs remains substantially limited. This may be due to security challenges in accessing the region and the limited availability of serological and molecular diagnostic facilities and capacity.
Rift Valley fever virus (RVFV) and hepatitis E virus (HEV) are significant emerging zoonotic pathogens of global public health significance and major causes of morbidity, particularly in high‐risk groups, including farmers, herders, veterinarians, and butchers [23, 92]. The detection of these pathogens in camels transported across the Middle East, Africa, and the Sahelian region [43, 64] indicates that camels are a potential source for transmission to humans, and the movement of camels may be a key factor in the dissemination of these viruses.
Similarly, although limited information is available on the circulation of the influenza A virus in camels, evidence supports the virus’s capacity to infect these animals. Whilst only two studies [33, 46]; have reported detection of the virus in nasal swabs and serum, the ecology of this TAD in camels remains poorly understood, underscoring the need for enhanced proactive surveillance. BT, WNF, BVD, and PPR were among the other viral TADs reported in transported camels. These infectious diseases primarily affect cattle, sheep, and goats. However, the detection of these viruses in imported camels warrants further investigation to determine their role in viral circulation and potential transmission pathways to livestock and humans.
The most prominent bacterial disease reported in this review was brucellosis, which is not only zoonotic but also severely affects reproduction in animals, resulting in stillbirths and reduced milk production, impacting farmers and livestock owners worldwide [93]. Although camels may be considered secondary hosts of Brucella spp. [94, 95], they can transmit the disease to humans and other animals. The major regions where infected camels originated were Sudan, Somalia, Ethiopia, and the Nigeria‐Sahel border [29, 73, 74].
Camels moved by pastoralists in Tunisian cities bordering Algeria and Libya tested positive for bovine tuberculosis [40], likely due to prolonged contact with other animals. The 75% seroprevalence of Q‐fever (a neglected zoonotic bacterial TAD) in imported camels demonstrates that the disease can spread through cross‐border camel movement [77]. Although exposure to C. burnetii is common among humans and livestock; it remains grossly understudied and rarely reported.
4.2. Limitations
Despite efforts to conduct comprehensive and repeatable searches of the published literature, the exclusion of grey literature and non‐English publications may have led to under‐representation of certain regions and disease reports. Additionally, the frequent updates of TAD classifications by relevant authorities may have led us to exclude other TAD articles identified in our initial searches. While serology was widely used across most studies, seropositivity may not accurately reflect the pathogen’s transmissibility or current infection status. Seasonal variations in camel movement, which may influence disease transmission dynamics, were not accounted for in this review. Nevertheless, the data from this review provide a foundation for future studies that aim to assess risk or mitigate the effects of camel‐associated TADs on human and livestock populations.
5. Conclusions
TADs are increasing in frequency, and camels represent a significant potential source of cross‐border disease transmission. Despite the Horn of Africa and the Sahelian region being home to ~60% of the global camel population, high‐quality, comprehensive research on the occurrence and prevalence of camel‐associated TADs in these regions remains scarce. The risk of zoonotic TAD transmission is heightened by active camel trade and importation, particularly between the Middle East and Africa, as well as transhumance practices among pastoralists throughout arid and semiarid regions of Africa. These findings underscore the urgent need for improved disease surveillance, risk assessment, and targeted control strategies within camel trade corridors.
5.1. Implications and Recommendations
This variation in size, trade intensity, and research activity suggests a lack of investment in surveillance and disease monitoring in key areas of global camel movement. Inadequate information limits the ability to accurately evaluate disease risk and can slow the identification of new or recurring zoonoses. We recommend regional harmonisation of camel disease surveillance protocols, investment in molecular diagnostic capacity, and formalisation of camel trade routes to reduce informal movement and associated disease risks. Ultimately, there is a need to increase research on TADs, with emphasis on longitudinal studies, genomic surveillance, and socioeconomic impact assessments that incorporate a collaborative One Health approach aimed at improving understanding and developing targeted control strategies.
Ethics Statement
This study is a systematic review based on analysis of previously published data and did not involve animals directly.
Conflicts of Interest
The authors declare no conflicts of interest.
Author Contributions
Alex A. Adikwu: conceptualisation, formal analysis, investigation, methodology, validation, visualisation, writing – original draft, writing – review and editing. Theophilus I. Emeto: supervision, validation, writing – review and editing. Paul F. Horwood: supervision, validation, writing – review and editing. Andrew M. Adamu: conceptualisation, methodology, writing – review and editing. Olajide A. Owolodun: conceptualisation, investigation, validation, supervision. Oyelola A. Adegboye: conceptualisation, supervision, formal analysis, methodology, writing – review and editing.
Funding
No funding was received for this manuscript.
Supporting Information
Additional supporting information can be found online in the Supporting Information section.
Supporting information
Supporting Information 1 Figure S1: Forest plot for the subgroup analysis of TADs by management practice.
Supporting Information 2 Figure S2: Forest plot for the subgroup analysis of TADs by location.
Supporting Information 3 Figure S3: Forest plot for the subgroup analysis of TADs by research period.
Supporting Information 4 Figure S4: Forest plot for the subgroup analysis of TADs by pathogen.
Supporting Information 5 Figure S5: Funnel plot indicating publication bias in the overall prevalence of TADs.
Supporting Information 6 Table S1: Summary of studies on transboundary‐related TADs detected in camels.
The reference list from the paper itself. Each links out to its DOI / PubMed record.
- 1Esteve-Gassent M. D. , Pérez de León A. A. , and Romero-Salas D. , et al.“Pathogenic Landscape of Transboundary Zoonotic Diseases in the Mexico-US Border Along the Rio Grande, Frontiers in Public Health. (2014) 2, 177.25453027 10.3389/fpubh.2014.00177 PMC 4233934 · doi ↗ · pubmed ↗
- 2FAO , The State of Food and Agriculture 2020, Overcoming Water Challenges in Agriculture 2020, 10.4060/cb 1447 en. · doi ↗
- 3Food and Agricultural Organization (FAO) , The Global Framework for the Progressive Control of Transboundary Animal Diseases (GF-TA Ds), 2004, FAO, Rome.
- 4Transboundary Animal Diseases , Food and Agriculture Organization of the United Nations, 2021, https://www.fao.org/emergencies/emergency.
- 5World Organization for Animal Health , Animal Diseases, 2021, Paris, France, https://www.oie.int/en/what-we-do/animal-health-and-welfare/animal-diseases/.
- 6Malik Y. S. , Singh R. K. , and Yadav M. P. , Emerging and Transboundary Animal Viral Diseases: Perspectives and Preparedness, Emerging and Transboundary Animal Viruses. (2020) 14, 1–25, 10.1007/978-981-15-0402-0. · doi ↗
- 7World Health Organization (WHO) , Middle East Respiratory Syndrome Coronavirus (MERS-Co V), 2019, WHO.
- 8FAO, UNEP, WHO, and WOAH , One Health Joint Plan of Action (2022–2026), Working Together for the Health of Humans, Animals, Plants and the Environment, 2022, FAO; UNEP; WHO; World Organisation for Animal Health (WOAH), Rome, Italy, 10.4060/cc 2289 en. · doi ↗