ChromoMapper: a new tool to quickly compare large genome assemblies
Elvira Toscano, Elena Cimmino, Angelo Boccia, Leandra Sepe, Giovanni Paolella

TL;DR
ChromoMapper is a new tool that helps scientists quickly compare large genome assemblies by visualizing similarities and differences.
Contribution
The novel contribution is a tool that visualizes chromosomal alignment regions and differences between genome assemblies using QUAST and similar data.
Findings
ChromoMapper identifies and displays similarities and differences between genome assemblies.
It highlights collinearity, inconsistencies, and repeated regions in assemblies.
The tool is available online and through Zenodo for public use.
Abstract
Quality assessment and assembly comparison are essential steps while assembling new genomes. Many tools for evaluating assemblies typically provide synthetic parameters representing assembly quality or overall features, while others provide long detailed files where it is not always easy to identify and visualize the regions of correspondence and difference among different chromosome assemblies. Here we present ChromoMapper, a new tool which scans the output from QUAST, as well as other similar alignment description files, to quickly identify and display similarities and differences between the compared assemblies. It uses the information provided about aligned blocks, combined with additional annotations, to represent the main alignment regions at chromosomal or sub-chromosomal scale, highlighting similarities and collinearity between compared sequences, points of inconsistency,…
Genes, proteins, chemicals, diseases, species, mutations and cell lines named across the full text — each resolved to its canonical identifier and authoritative record.
Click any figure to enlarge with its caption.
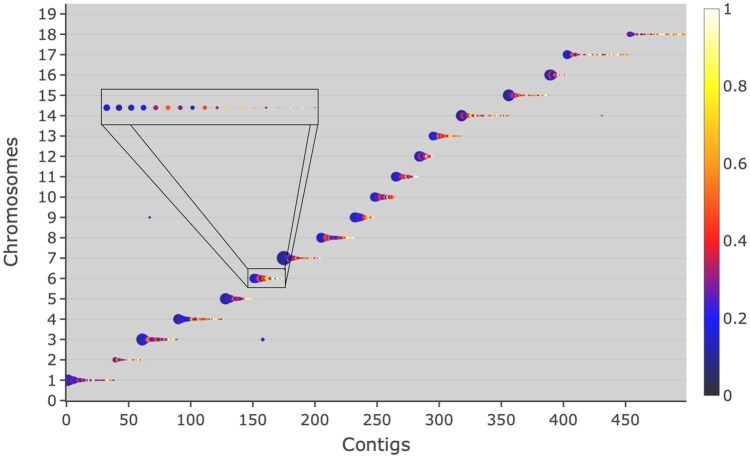 Figure 1
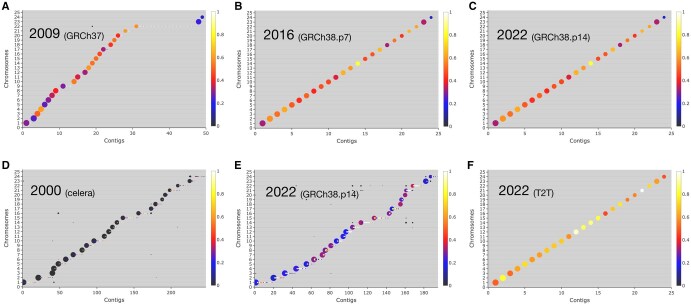 Figure 2
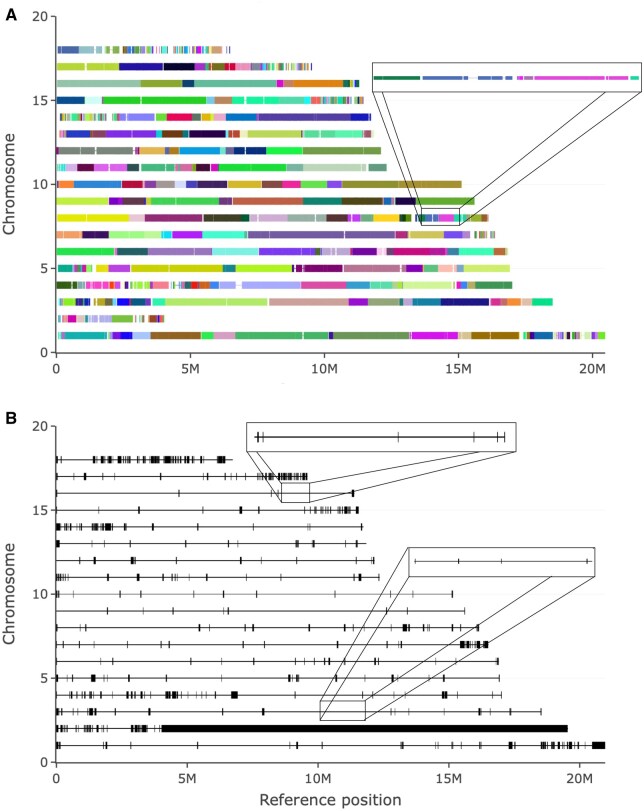 Figure 3
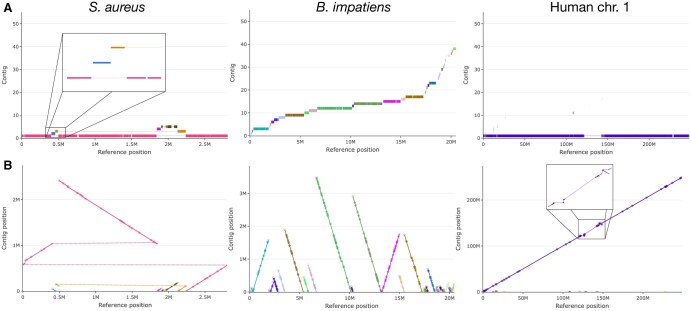 Figure 4
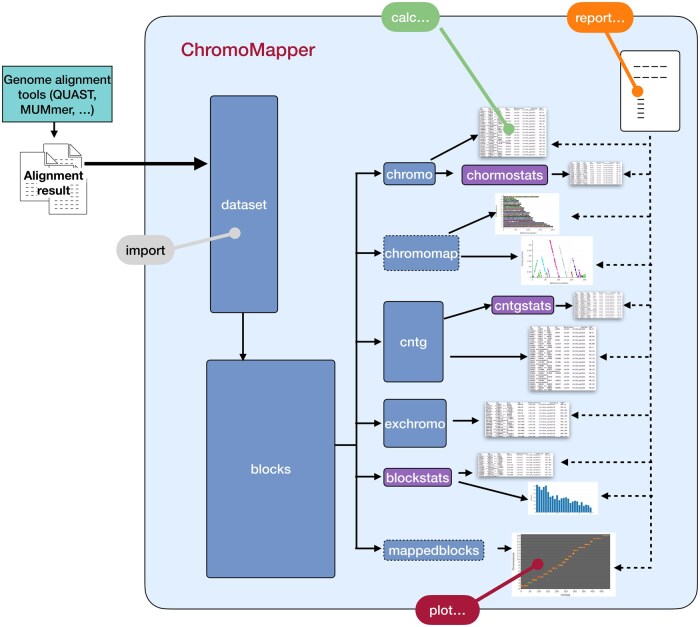 Figure 5
| Block length | Tot length | Genome fraction |
| Blocks unique | Blocks repeated | Avg. length | N50 (kb) | L50 | N90 (kb) | L90 |
|
| Blocks per contig (avg.) | Blocks per ref. (avg.) | Identity (avg. %) |
|---|---|---|---|---|---|---|---|---|---|---|---|---|---|---|---|
| >500000 | 4 290 039 | 0.02 | 7 | 3 | 4 | 612 863 | 620.1 | 4 | 501.6 | 7 | 7 | 7 | 1 | 1 | 99.0 |
| >200000 | 61 800 687 | 0.26 | 216 | 135 | 81 | 286 114 | 281.6 | 83 | 209.4 | 186 | 114 | 18 | 2 | 12 | 99.0 |
| >100000 | 131 364 058 | 0.55 | 716 | 496 | 220 | 183 469 | 192.0 | 236 | 114.2 | 594 | 195 | 18 | 4 | 40 | 99.0 |
| >50000 | 182 581 960 | 0.76 | 1435 | 121 | 414 | 127 235 | 153.1 | 386 | 66.5 | 1120 | 267 | 18 | 5 | 80 | 98.9 |
| >20000 | 215 004 619 | 0.90 | 2426 | 1740 | 686 | 88 625 | 126.0 | 504 | 39.7 | 1680 | 373 | 18 | 7 | 135 | 98.8 |
| >10000 | 225 919 664 | 0.95 | 3172 | 2293 | 879 | 71 223 | 119.8 | 549 | 30.5 | 1960 | 498 | 18 | 6 | 176 | 98.8 |
| >5000 | 230 901 531 | 0.97 | 3859 | 2818 | 1041 | 59 835 | 117.4 | 570 | 26.7 | 2117 | 634 | 18 | 6 | 214 | 98.8 |
| >2000 | 234 818 495 | 0.98 | 5111 | 3781 | 1330 | 45 944 | 115.0 | 587 | 23.6 | 2258 | 885 | 18 | 6 | 284 | 98.0 |
| >1000 | 237 112 084 | 0.99 | 6738 | 5099 | 1639 | 35 190 | 114.0 | 597 | 21.7 | 2349 | 1149 | 18 | 6 | 355 | 99.0 |
| >500 | 238 839 707 | 1.00 | 9160 | 7063 | 2097 | 26 074 | 113.0 | 604 | 20.0 | 2424 | 1823 | 20 | 5 | 458 | 99.0 |
| >200 | 238 839 707 | 1.00 | 9160 | 7063 | 2097 | 26 074 | 113.0 | 604 | 20.0 | 2424 | 1823 | 20 | 5 | 458 | 99.0 |
| >100 | 238 839 707 | 1.00 | 9160 | 7063 | 2097 | 26 074 | 113.0 | 604 | 20.0 | 2424 | 1823 | 20 | 5 | 458 | 99.0 |
| >0 | 238 839 707 | 1.00 | 9160 | 7063 | 2097 | 26 074 | 113.0 | 604 | 20.0 | 2424 | 1823 | 20 | 5 | 458 | 99.0 |
- —Ministry of University and Research (MUR)
Peer Reviews
No public reviews on file for this paper yet. If you reviewed it on a platform where reviews are public (OpenReview, ICLR, NeurIPS, ICML), you can paste yours below so the community can read it here.
Videos
No videos yet. Explain this paper in a talk, walkthrough, or lecture? Add one.
Taxonomy
TopicsGenomics and Phylogenetic Studies · Genome Rearrangement Algorithms · Genomics and Chromatin Dynamics
Introduction
Eukaryotic genome assembly procedures strongly depend on quality assessment and assembly evaluation steps (Kim and Kim 2022, Jung et al. 2020, Zhang et al. 2023). Commonly used tools include reference-free ones, which map reads onto the final assembly to check consistency and detect errors (Hunt et al. 2013, Rhie et al. 2020, Chen et al. 2021, Li et al. 2023, Rahman and Pachter 2013, Clark et al. 2013) or estimate the completeness of an assembly by looking for conserved genes (Parra et al. 2007, Simão et al. 2015, Parks et al. 2015, Seppey et al. 2019) or for repeated genomic regions (Ou et al. 2018). Other tools use a reference-based approach to compare one or more assemblies with a reference genome; many tools use nucmer, an early genome sequence aligner included in MUMmer package (Kurtz et al. 2004, Marçais et al. 2018), or the more recent minimap2 (Li 2018) to produce raw files containing a list of alignment blocks. The MUMmer package has for a long time provided global comparison parameters as well as graphic representations of the aligned genomes directly or through extensions (Kurtz et al. 2004). GAGE, a study designed to compare the results of different assemblers, provided a set of scripts which support the calculation of a number of metrics, including different types of misassembly errors (Salzberg et al. 2012). Some of these methods and quality metrics were later included in QUAST, a tool originally designed for bacterial and small eukaryotic assemblies and later upgraded to support large genomic sequences (Gurevich et al. 2013, Mikheenko et al. 2018). QUAST is currently a quite popular and effective tool, able to compare more than one assembly with a user-provided reference genome and to evaluate a good range of metrics both reference-based and reference-free. Some of this information is made available in graphic format taking advantage of Icarus (Mikheenko, Valin, et al. 2016), a browser for assembly exploration and evaluation used within QUAST to complement its numerical output with graphic visualization of aligned blocks. In the years, QUAST generated some “specialized” quality assessment tools: MetaQUAST (Mikheenko, Saveliev, et al. 2016) to address metagenomic assembly evaluation; rnaQUAST for evaluating RNA-Seq assembly quality (Bushmanova et al. 2016); TandemQUAST which combines evidence from both k-mers and long reads to better identify certain classes of structural misassembly (Mikheenko et al. 2020); WebQUAST, a web server which allows to remotely execute QUAST runs through a graphical interface (Mikheenko et al. 2023).
Here we present ChromoMapper, a new tool which complements QUAST as well as other tools using the nucmer alignment file format by quickly identifying major regions of similarity and the main differences between assemblies. It directly reads output files produced by these tools and quickly shows how similarity is distributed along the chromosomes at different levels of detail. The program produces synthetic as well as detailed reports, which provide global genome coverage and chromosome-by-chromosome analyses. Alignment data is provided in tables or as dynamic graphical representations which allow multiscale browsing of the alignment, highlighting the relationship between chromosomes, contigs and alignment blocks. ChromoMapper is available as open-source at https://chromomapper.ceinge.unina.it/ and via Zenodo (10.5281/zenodo.16778863).
Methods
Software and languages
Most ChromoMapper code was written in PHP programming language, taking advantage of its C-like syntax combined to rapid execution and testing. The code uses an object-oriented approach to develop a modular program. In its present form, ChromoMapper runs without additional libraries on Unix, macOS, and Windows operating systems. It was developed on PHP 8.2, but it should be compatible with all versions starting from PHP 8.0.
ChromoMapper is built by extending unixCmd, a PHP class previously developed in our laboratory to build unix command tools and able to receive options and arguments and to execute the requested commands. In addition, it uses library functions and objects developed in the laboratory, in order to manage data and build tables, produce plots and graphical representations and build simple HTML code for creating output pages, as also previously described (Toscano et al. 2022, Toscano, Cimmino, et al. 2025).
Plots take advantage of the plotly library and its ability in managing dynamic plots, remaining fast even in presence of large amounts of data (Jing et al. 2019, Toscano, Cimmino, et al. 2025).
Tool development
ChromoMapper includes a number of procedures for processing alignment data and displaying the results in tables containing synthetic or detailed reports as well as in plots.
During the import phase, alignment block data are extracted from tsv files produced by tools, such as QUAST or nucmer (Kurtz et al. 2004, Gurevich et al. 2013, Mikheenko et al. 2018, Marçais et al. 2018) and re-organized according to the chromosome on which they map. In this phase, additional information is added, to provide alignment run data, including:
experiment date and name;name of the reference genome and of mapped assembly;path to the alignment file or its number within a multi-alignment run;path to report, a summary file produced during QUAST run;path to a conversion file, a tsv file defining a list of chromosomes with their lengths.
If not provided in the conversion file, the chromosome list is obtained by choosing the largest sequences in the reference assembly, if the number of chromosomes is specified. Alternatively, the import module tries to guess the sequences corresponding to chromosomes in the reference assembly, by sorting the sequences by descending size and assuming that only sequences larger than 50% of the previous one are chromosomes.
For each alignment block, a set of additional parameters are calculated and organized in three groups: block features, block-end annotations and related blocks (Table 1, available as supplementary material at Bioinformatics Advances online). Briefly, the block is evaluated and marked in special cases, i.e. if it has a reversed orientation with respect to reference chromosome (rev) or if it is the first or last contig block (ctgSt and ctgEnd). New start and end position in contig coordinates are calculated and added (S3 and E3) according to 5’-3’ reference direction. Block length is calculated in terms of length on contig (Length), length on reference (LenOnChr), and difference and ratio between block lengths on contigs and reference (LenDiff and LenExcess). Block comment provided by tools like QUAST is read and analysed to extract block end annotations indicating whether the contig block ends because of a translocation (Transloc), and indel (Indel) or a local misassembly (LocMis). Finally, the number of related blocks is analysed by calculating six additional parameters: n_unrelated (number of unrelated blocks, i.e. those which map on the same reference contig/scaffold but on different positions), n_same (number of blocks mapping exactly on the same reference position), n_alternatives (number of blocks completely contained within the analysed block, i.e. those mapping in positions contained in the alignment length of the test block), n_larger (number of larger blocks which contain the analysed block, i.e. block whose mapping length on the reference contains the whole length of test block alignment), n_ovLeft (number of blocks whose alignment overlaps on the left with the alignment of the test block), n_ovRight (number of blocks whose alignment overlaps on the right with the alignment of the test block). The blocks are then typically filtered by selecting those above a defined Length (the default size is 10 000 bases) and with n_larger equal to zero, before using them for downstream analyses.
Production of alignment files
For Bombus impatiens and Staphylococcus aureus, assemblies produced by (Salzberg et al. 2012) using SOAPdenovo (Luo et al. 2012) and MSR-CA (Zimin et al. 2013) assembler, respectively, were used and compared by QUAST with the corresponding reference genome available on ncbi website (GCA_043295415.1, GCF_000013425.1).
Human assemblies were obtained from ncbi website: GRCh37 (GCF_000001405.13), GRCh38.p7 (GCF_000001405.33), released from the Genome Reference Consortium (GRC), were compared by QUAST with the current reference genome for Homo sapiens GRCh38.p14 (GCF_000001405.40), which, in turn was also mapped against itself; human genome sequence produced by Celera in 2001 (GCA_000002115.2) (Venter et al. 2001) and GRCh38.p14 were compared with telomere to telomere human genome assembly (GCF_009914755.1) (Nurk et al. 2022, Rhie et al. 2023), which, again was also mapped against itself.
Assembly statistics and reference based evaluation was obtained by QUAST (Gurevich et al. 2013, Mikheenko et al. 2018), version 5.0.5, by defining the parameters --eukaryote, to indicate that the genome is eukaryotic and not circular, affecting gene finding, conserved orthologs finding and contig alignment; --large, to indicate that the genome is larger than 100 Mbp, affecting speed and accuracy, imposing --min-contig 3000 --min-alignment 500 --extensive-mis-size 7000 and allowing to identify misassemblies caused by transposable elements and excluding them from the number of misassemblies, --conserved-genes-finding, for enabling search for Universal Single-Copy Orthologs using BUSCO (Simão et al. 2015, Seppey et al. 2019) by working on eukaryotic gene database; --no-sv, to skip structural variation finding as it is yet experimental in the used QUAST version; --features gene, to provide gene positions in the reference genome.
Results
ChromoMapper is a command line tool which evaluates genome assembly, starting from the results of a mapping procedure, previously carried out using QUAST (Gurevich et al. 2013, Mikheenko et al. 2018) or other mapping tools using the format initially proposed by nucmer from the MUMmer package (Kurtz et al. 2004, Marçais et al. 2018). It directly reads the output files of the alignment tool to produce reports organized in tables and plots which together give a global view of the assembled genome, as well as detailed information at the level of individual chromosomes, contigs or alignment blocks.
ChromoMapper reads alignment files to analyse results at alignment block level
ChromoMapper displays alignment results in tables containing synthetic or detailed reports, as well as in plots. The above-mentioned alignment tools, used to produce the input files, typically provide the results in the form of lists of alignment blocks, i.e. stretches of similarity, ranging in length from tens to millions of bases, which may correspond to entire, or almost entire, contigs/chromosomes but, more often, represent local regions of similarity. Interruptions between blocks occur for a number of reasons, including short insertions or deletions (indels) or bigger inconsistencies, such as large insertions, sequence inversions or jumps to a far-away position on the same chromosome or even a different one. ChromoMapper starts from the provided alignment blocks and, for each of them, calculates a set of extra parameters, describing block features, block end annotations and number of related blocks (see Methods). Block statistics are computed organizing blocks in different categories (above or below a length threshold or between two lengths). An example is reported in Table 1, where an assembly from Bombus impatiens produced by Salzberg et al. (2012) was compared by QUAST with a reference genome for this species on ncbi website (GCA_043295415.1). Alignment blocks are categorized according to their length and, for each set of blocks larger than a certain length, the following parameters are reported: total length, genome fraction, number of all, unique and repeated blocks, average block length, N50, L50, N90, L90 values, number of assembly and reference sequences on which blocks mapped, average number of blocks for each assembly and reference sequence and identity percentage between the tested assembly and the reference one. Figure 1, available as supplementary material at Bioinformatics Advances online, reports a graphical visualization of block features where, for the same experiment as in Table 1, total length (Fig. 1A, available as supplementary material at Bioinformatics Advances online) and number of blocks (Fig. 1B, available as supplementary material at Bioinformatics Advances online) are calculated by limiting the analysis to blocks longer than a minimum length. The same parameters are reported in Fig. 1C and D, available as supplementary material at Bioinformatics Advances online, for blocks whose length is between a lower and an upper limit. The plots show that most of the aligned sequence is in ∼1500 blocks longer than 50 kbases, while less than 20% of it is in smaller blocks, which are of course larger in number (>6000).
Figure 1 shows how each block contributes to connect a contig with the chromosome(s) on which it maps, by plotting, at each chromosome/contig intersection, a bubble, whose size depends on the total number of bases, i.e. the sum of the lengths of all blocks contributing to the bubble (File 1, available as supplementary material at Bioinformatics Advances online). A multi-colour gradient is used to represent alignment continuity in terms of contig integrity level, calculated as the ratio between length of the largest block and contig length. The gradient goes from white, when a single block is contributing the whole length or nearly, through yellow, red and blue tones, down to black, when a large number of blocks, all 5%–10% of the contig length or smaller, are necessary to produce the full-length alignment. To ease block alignment interpretation, contigs are re-sorted according to the chromosomes they mostly map on: as a consequence, in good alignments, i.e. where there is a high correspondence between the two compared genomes, the bubbles tend to follow the main diagonal, with only a few separated spots corresponding to extra blocks produced when contigs map on more than one chromosome. Blocks are filtered using a minimum size threshold: Fig. 1, where blocks longer than 10 000 bases are used, shows that all chromosomes are covered by a large contig (large bubbles) with integrity level ranging between 0.2 and 0.4. Chromosomes 2 and 18 differ, as they are made by much smaller contigs, whose number importantly increases when the analysis is done on unfiltered blocks (larger than 0) (Fig. 2A, available as supplementary material at Bioinformatics Advances online). Increasing the block length threshold up to 20 000, small bubbles disappear while the size of large bubbles is not importantly modified, indicating that the corresponding contigs mainly contain blocks above this length (Fig. 2B, available as supplementary material at Bioinformatics Advances online). When blocks longer than 200 000 bases are used, the majority of large bubbles contract or disappear, indicating that the filtered-out alignment blocks contribute an important portion of the alignment length (Fig. 2C, available as supplementary material at Bioinformatics Advances online).
Block level graphical evaluation performed within ChromoMapper. For the same experiment as in Table 1, blocks longer than 10 000 bases have been used to plot contigs (x axis) against the reference chromosome (y axis) on which they map, represented as a bubble, whose size depends on the total alignment length and whose colour uses a white-red-blue-black gradient to indicate highly to lowly integrated alignments, where the integrity level is calculated as the ratio between maximum block and contig length. The plot is fully expandable by zooming (see File 1, available as supplementary material at Bioinformatics Advances online); the rectangle shows the effect of zooming into the region of chromosome 6.
Evaluation of different human genome assemblies. Blocks longer than 10 000 bases have been used to plot contigs (x axis) against the reference chromosome (y axis) on which they map, as in Figure 1. Coordinate 23 and 24 on the y axis correspond to chromosome X and Y, respectively. Assemblies were obtained from ncbi website. (A and B) Homo sapiens GRCh37 (GCF_000001405.13) and GRCh38.p7 (GCF_000001405.33) were compared with the current reference genome for GRCh38.p14 (GCF_000001405.40). This last was also mapped against itself (C). (D and E) Genome sequence produced by Celera (GCA_000002115.2) and GRCh38.p14 were compared with telomere-to-telomere (T2T) genome assembly (GCF_009914755.1), which, was also mapped against itself (F).
This type of plot is also effective at evaluating the alignment of more integrated assemblies where a reduced number of larger contigs/scaffolds are needed to cover the whole length of a reference genome; also in this case, different levels of continuity of an assembly are quickly detected. Figure 2A–C show the analysis of different human genome assemblies, compared by QUAST with the current reference genome (GRCh38.p14) released from the Genome Reference Consortium (GRC). The developed representation highlights how the human genome sequence produced in the context of Human Genome Project (Lander et al. 2001) evolved over the years and provides a typical example of how ChromoMapper may help users resolve assembly comparison scenarios.
GRCh37 assembly covers the reference chromosomes with 50 sequences, with 17 short contigs mapping only on chromosome 22 and with an alignment showing an integrity level ranging between 0.2 and 0.6 (Fig. 2A). GRCh38.p7 assembly is more similar to the current reference assembly (GRCh38.p14), covering its chromosomes with exactly 24 sequences and showing higher integrity levels (0.4–0.8) (Fig. 2B), i.e. longer blocks corresponding to 40%–80% of the largest contigs mapped on the reference chromosomes. These levels of integrity are the same as those observed when GRCh38.p14 sequences are mapped against themselves (Fig. 2C); in both alignments, block interruptions are, in fact, mainly due to the gaps introduced when building the chromosomal scaffolds (see Table 2, available as supplementary material at Bioinformatics Advances online, for the 19 blocks on chromosome 1). In Fig. 2E, the same GRCh38.p14 assembly was mapped on the more recent telomere-to-telomere (T2T) assembly (Nurk et al. 2022, Rhie et al. 2023). As expected, using the new reference, the blocks show lower overall similarity, with the main bubbles similar in size to those of Fig. 2B and C but with integrity levels ranging between 0.20 and 0.35. In addition, blocks from ∼170 additional, much smaller, contigs map on T2T chromosomes, showing that many contigs, not assembled into chromosomes in GRCh38.p14, find correspondence with a chromosome sequence in the T2T assembly. A similar pattern, but much lower in similarity, may be seen when comparing one of the first genome drafts, the one produced by Celera in 2001 (Venter et al. 2001), with the same T2T assembly (Fig. 2D). Here, the alignment is highly fragmented, with contigs mapping through blocks consistently smaller than 5% of their length (black bubbles) and over 200 additional very small contigs; Y chromosome coverage is very low. Finally, when T2T assembly is mapped onto itself (Fig. 2F), 24 big bubbles are obtained, as expected. For some chromosomes, the representation shows sequences larger than those from GRCh38.p14: the Y chromosome bubble is visibly larger than in Fig. 2C; a similar result, although less prominent is also visible for chromosomes 1, 9 and 22. Overall, integrity levels are much higher (0.5–1) as, in this case, there are no block interruptions due to scaffold gaps; interestingly, even here, blocks do not span the whole chromosomes, as interruptions still occur in correspondence of centromeric regions, possibly caused by the way the alignment algorithm deals with segmental duplications (Treangen and Salzberg 2011, Phan et al. 2015, Rangwala et al. 2024).
Global evaluation of genome assembly
ChromoMapper was designed to compare contig or scaffold sets, but also allows to evaluate the integration level of a given assembly by comparing it to a reference genome. A number of different analyses provide a chromosome-by-chromosome summary of reference genome coverage, as well as graphical representations which highlight alignment blocks in detail and the position of gaps in the alignment. In Fig. 3A, for each chromosome (y axis), alignment blocks are reported as rectangles, coloured according to the contig they belong to, while regions of the reference genome not covered by contigs correspond to interruptions between contiguous alignment blocks. Horizontal lines connect two contiguous blocks from the same contig and can be made more visible by zooming in to expand regions of the plot (File 2, available as supplementary material at Bioinformatics Advances online). Figure 3B highlights gaps between blocks/contigs, by representing them as black rectangles located at each interruption; also in this case, zooming in allows to see more gaps, typically small enough to be hidden at whole picture level (File 3, available as supplementary material at Bioinformatics Advances online). In Fig. 3, an example of such evaluation is reported for the same assembly of the Bombus impatiens genome used in Fig. 1 and Table 1. Most chromosomes are covered by 10–20 contigs which together cover essentially their whole length. Chromosome 2 is an exception: it is only covered in the leftmost 4 million bases, while the remaining ∼20 million bases of the reference chromosome correspond to a giant gap in the alignment. These representations also highlight that other chromosomes, such as 1, 4, 7, 14, 17 and 18, present a more fragmented coverage, mainly at their left or right end.
Evaluation of genome aggregation level by ChromoMapper. The same Bombus impatiens genome assembly as in Table 1 and Fig. 1. (A) For each chromosome (y axis), alignment blocks are reported as rectangles, coloured according to the contig they belong to and located at the position they map on the reference chromosome (Mbases). Interruptions between contiguous alignment blocks are represented as empty space between rectangles. Horizontal lines connect two contiguous blocks from the same contig. In the zoomed area, a region of chromosome 8 is expanded. (B) For each chromosome reported on the y axis, gaps are represented as black rectangles located at the position they map on the reference chromosome (Mbases). In the rectangles, a zoom on the selected region of chromosome 3 and 16 is reported.
Within ChromoMapper, the information about alignment blocks is also summarized in the Chromosomes table, which provides a rapid chromosome-by-chromosome view of the major features of the reference genome coverage: leftmost block start (S1) and rightmost block end (E1), fraction of chromosome covered by contigs, number of contigs mapping on each chromosome and their L90 and L50, percent identity between contigs and chromosomes, number of alignment blocks, total aligned block length and reference chromosome length. Such analysis for the Bombus impatiens genome (Table 3, available as supplementary material at Bioinformatics Advances online) confirms a quite high coverage for most reference chromosomes, with the exception of chromosomes 2 and 18 which show lower coverage values, 14% and 58%, respectively. The number of mapped contigs and the L90 and L50 values reveal a similar level of integration for the different chromosomes, with chromosomes 9, 12 and 16 being much less fragmented than most of the others. The alignment includes 100–200 blocks for most chromosomes.
Analysis of single chromosomes and contigs
Single chromosome analysis uses two different representations, both shown in Fig. 4. In the first (Fig. 4A), for a given chromosome, each contig is reported at a different y axis coordinate with alignment blocks represented as coloured rectangles located at the reference chromosome position on which they are mapped; thin lines are used to connect blocks of the same contigs when they are not contiguous on the chromosome. The second graph (Fig. 4B) is a dotplot-like representation, where blocks are polarized segments, starting with a circle and ending in a triangle. Long linear stretches indicate perfect correspondence between contigs and reference genome, insertions and deletions produce jumps from one diagonal line to a parallel one, while inverted blocks show opposite slopes. Dotted lines connect adjacent blocks from the same contig when mapped on different parts of the reference chromosome.
Evaluation of the coverage of single chromosomes in different assemblies. Analysis of Staphylococcus aureus genome, chromosome 1 from the Bombus impatiens genome assembly, already displayed in Figs. 1 and 3, and human chromosome 1, from GRCh38.p14 compared with telomere-to-telomere (T2T) genome assembly (GCF_009914755.1), is displayed. (A) In each plot, contigs are reported at their y axis level; alignment blocks are reported as coloured rectangles located at reference chromosome position (Mbases) on which they are mapped. Thinner lines are used to connect blocks of the same contigs which are not contiguous on the chromosome. (B) The graph is a dotplot-like representation, where blocks are reported as segments tagged with start (circles) and stop (triangles), located according to contig and reference chromosomes positions (Mbases). Long linear stretches indicate perfect correspondence between contigs and reference genome, insertions and deletions produce jumps from one diagonal line to a parallel one, while inverted blocks are represented as segments with opposite slopes. Dotted lines connect not contiguous blocks on the reference chromosome. In the rectangles, a zoom on the selected regions is reported.
Single chromosomes from the same assembly as in Fig. 1 (Bombus impatiens) and Fig. 2E (Homo sapiens, GRCh38.p14 on T2T) are reported in Fig. 4, together with an assembly for Staphylococcus aureus genome, produced by Salzberg et al. (2012) and compared by QUAST with the corresponding reference genome available on ncbi website (GCF_000013425.1). For all examples, the representations allow a quick assessment of the quality of the assembled chromosome sequence. The assembled Staphylococcus aureus genome consists of five contigs which map onto the reference sequence, but with a few important differences. The reference genome is mainly covered by a long contig, whose alignment is articulated in four main regions, each composed of several blocks: the first region (∼0.5 Mbases) maps onto the end of the reference sequence (position 2.25–2.8 M); the second is very small and maps onto the initial region of the reference sequence; a small insertion within the contig, represented as a jump to a parallel line, leads to the third alignment region (up to 1 Mbases); finally, the fourth region is the longest one and is represented as a segment with opposite slope, revealing the presence of a large inversion. Regarding Bombus impatiens chromosome 1, about 70% of its length is accounted for by less than 20 contigs, with the remaining 30% split among 20 more contigs. Human chromosome 1 from GRCh38.p14 includes one long sequence corresponding to about 90% of the T2T assembly used as reference, interrupted by a large gap between the position 120 to 145 Mbases, corresponding to centromeric satellite repeats and segmental duplications (Nurk et al. 2022). Over 10 additional short contigs, from GRCh38.p14 assembly, map onto the same chromosome 1, mainly in its leftmost region. In Fig. 3, available as supplementary material at Bioinformatics Advances online, human (GRCh38.p14) chromosome 22 shows a large gap at the leftmost region, corresponding to the first 10 Mbases of the reference (T2T) chromosome sequence. About 5 Mbases are scattered into short blocks belonging to sequences assembled into different chromosomes (13, 14 and 21) in GRCh38.p14. The remaining rightmost region is covered by one long sequence from chromosome 22 of the assembly with a quite continuous alignment, made up from only six blocks. As for chromosome 1, more than 10 additional short contigs mapping onto the chromosome, mainly in its leftmost region, correspond to centromeric satellites and segmental duplications (Nurk et al. 2022) (File 4, available as supplementary material at Bioinformatics Advances online).
Tool design and implementation
ChromoMapper is a command line tool which uses four main commands, import, calc, plot and report, for dataset analysis and plot production. A schematic representation of its architecture in terms of commands and data flow is reported in Fig. 5.
Schematic representation of ChromoMapper architecture in terms of commands and data flow. It is based on four principal commands (coloured boxes on the border) which drive the production or the analysis and processing of a dataset. A new alignment run is imported by the import command. The calc commands produce results as tables. The plot commands produce results that are then used to build different types of plots. The report commands produce different types of summary reports including multiple tables and plots.
The import command is used to convert the input data into a pre-processed dataset. A full QUAST output directory or a single QUAST or nucmer alignment file can be directly imported.
The calc command produces different results in form of tables, starting from an imported dataset, extended by calculating additional parameters (see Methods). Results include: blocks, i.e. the imported alignment blocks; blockstats, cntgstats, chromostats, which compute statistics on aligned blocks, contigs and chromosomes; cntg, chromo and exchromo, which provide a rapid view of the assembly contigs, reference chromosomes or sequences not assembled into chromosomes in the reference genome. This is the result, if a chromosome list was provided as an additional file during the import phase; if not, a chromosome list may still be calculated by guessing it from the sorted reference sequences using a very simple algorithm (see Methods). Options are used to customize the output, provide information about the experiment or filter the dataset by a number of parameters such as chromosome or block length.
The plot command uses the available data to calculate the results necessary to produce the various plots, which include: chromolen, i.e. a bar plot representing chromosome lengths; blocksonchrs, contigsonchrs and gapsonchrs, which plot alignment blocks, contigs or gaps on all reference chromosomes (Fig. 3); blocktotlen and nblock, the bar plots used in Fig. 1, available as supplementary material at Bioinformatics Advances online, to represent total length and number of blocks; chromomap and contigsonchr which plot the contigs mapping onto the selected chromosome (Fig. 4); mappedblocks which represents the assembly/reference alignment in form of bubble plots, as in Figs. 1 and 2.
Finally, the report command produces complete reports in the form of a HTML file containing links to a set of tables and plots. Different report types may be produced by choosing among four different complexity levels.
ChromoMapper runs in a PHP (version 8.2) environment without external libraries on Unix, macOS and Windows operating systems and shows very short execution times: on a M2 processor, it typically takes from less than one to a few seconds to produce single plots or tables, up to a few minutes for a full chromosome-by-chromosome report on large mammalian genomes. Execution times and memory usage for different analyses on genome assemblies of different size and quality are reported in Table 4, available as supplementary material at Bioinformatics Advances online.
Discussion
Quality assessment during eukaryotic genome assembly depends on a number of tools which evaluate the resulting genome sequence either directly, using a reference-free approach, or in comparison with reference sequences. Reference-based tools compare one or more assemblies with a reference genome; they typically rely on a fast genomic sequence aligner, such as nucmer, included in MUMmer system, or minimap2, as in the case of QUAST, which produce long lists of alignment blocks where it is often not easy to see major regions of similarity or main differences between different assemblies. Within these tools, alignment analysis produces a number of global metrics which readily distinguish low-quality assemblies from better ones, while graphic representation is based on tools such as Icarus, tuned to display in great detail each alignment block. However, how contigs are organized, or simply the number and length of the contigs and alignment blocks necessary to cover a given chromosome are often less easy to grasp. Especially when comparing assemblies of similar quality, which typically give similar global scores, differences are often not easy to spot, as it is difficult to immediately realize how similarity is distributed, which regions are better assembled, or simply whether the same contigs and/or alignment blocks are used to build a given chromosome.
The tool described in this work, ChromoMapper, uses QUAST output files, as well as others in similar format, to quickly identify and display similarities and differences between assemblies. It works on the alignment blocks produced during the alignment phase, analysing the relationship between reference and assembly sequences at different levels: contigs, scaffolds or fully assembled chromosomes are evaluated and displayed considering how they map onto the chromosomes of the reference genome, using user-provided information, such as chromosome name and expected length, or guessing the chromosomes from their size. If the reference sequence is not assembled into chromosomes, ChromoMapper can still work on scaffold or contig sets aligned to each other, although, of course, in this case chromosome-related tables cannot be provided.
Within ChromoMapper, alignment data are displayed in synthetic form, using tables or plots, where results are organized at different level of detail, going from a global view of the genome down to detailed information about blocks, individual chromosomes or contigs. Chromosome-by-chromosome genome coverage is provided as a summary table, as a whole genome graphic map and as graphical representations of single chromosomes. The global genome plots of Fig. 3 topographically map similarities and differences onto the various chromosomes; the deep zooming level provided by these plots allows to keep all block-level information even within this “globally” oriented representation (Fig. 3A and File 2, available as supplementary material at Bioinformatics Advances online). In addition to alignment blocks, spaces between blocks, visualized within the same context, complement the blocks/contig view by stressing the interruptions between contigs (Fig. 3B and File 3, available as supplementary material at Bioinformatics Advances online). Graphical representation of single chromosomes generates, for each of them, two different plots, which highlight various alignment features: insertions, deletions, translocations, inversions, etc. (Fig. 4). Also these plots start showing a global chromosome view and may be dynamically expanded by zooming at different levels of resolution, to make even small regions visible and show details not visible at whole picture level (see File 4, available as supplementary material at Bioinformatics Advances online).
Overall, the major contribution of ChromoMapper is possibly in improving visualization and interpretability of assembly comparison results. The described level of detail is, in fact, better than that provided by a number of tools for visualizing genome alignments, such as the early MGView, originally designed to support gap closure of microbial genomes (Herron-Olson et al. 2003) or Synteny Portal which visualizes synteny blocks by using prebuilt alignments in the UCSC genome browser database (Speir et al. 2016). More recently, synteny tracks and structural variations among genomes have been also included in full featured genome browsers, like JBrowse2 (Diesh et al. 2023), or comparative genomic viewers, like CGV (Rangwala et al. 2024), although, this last is only available to display prebuilt whole-genome sequence alignments provided by NCBI rather than newly assembled genomes.
When assembling, an important point deals with alignment blocks which invariably fragment a contig mapping onto a reference sequence: more than the simple number of blocks, their length, level of identity, orientation, distance and the features of the connecting unaligned sequences are indications of alignment quality. Alignment representations provided by ChromoMapper (Fig. 4) quickly distinguish long regions of near 100% sequence identity, where blocks are simply indications of point changes, from “difficult” regions where a large number of smaller or much smaller blocks indicate the presence of alternative assembly/mapping as often happens in areas rich in repetitive sequences, such as centromeric regions or X chromosomes. Using a customized bubble plot, ChromoMapper can also globally show how each block contributes to connect each contig with the chromosome(s) on which it maps. The examples in Fig. 2 are typical situations where ChromoMapper may help users in solving assembly comparison scenarios as they show how this block/contig/chromosome approach quickly highlights similarity, changes and level of integration, when comparing assemblies made at many years distance and with completely different approaches. In addition, even if an assembly is mapped against itself, the developed representation results useful in evaluating the integration level of the chromosome scaffolds by highlighting block interruptions due to gaps introduced when producing scaffolds.
ChromoMapper allows to easily monitor the whole assembly process, all the way from contigs to scaffolds to chromosomes. At early stages, mapping assembled contigs onto a reference genome gives a quick view of how much of it is covered, as well as the level of integration, both globally and chromosome by chromosome. Different assemblies may be compared with each other to show alternative assemblies of the same sequences, which is especially useful when no reference sequence is available, or when forcing a de novo assembly to potentially highlight structural variations. Assemblies from long-read sequencing, well supported in ChromoMapper (Toscano, Sepe, et al. 2025), are even more effective as they often tend to be more continuous than those obtained by assembling shorter sequences obtained through other sequencing procedures. When scaffolds or full chromosomes become available, they can quickly be evaluated by taking advantage of tables and plots. ChromoMapper usage is very easy: it uses four main commands, import, calc, plot and report, for dataset import and analysis and plot production. It integrates all the results in a comprehensive report, containing links to sets of tables and plots, but also allows to produce plots or tables singularly. It is a flexible and effective system to analyse assembly structure and alignment quality by combining statistical evaluation and graphical visualizations, across a wide range of genome sizes (further documentation and usage examples can be found at https://chromomapper.ceinge.unina.it/). The main limitations are directly linked to what is the main focus of the application, i.e. the assessment of the quality of reasonably continuous partial or full genome assemblies, as many tables and visualizations are organized at the chromosome level. In this respect, very discontinuous assemblies of large genomes end up by producing millions, rather than thousands, of blocks resulting, in the worst case, in long processing times and very crowded plots. Even in this case, though, execution time, although slower (minutes or tens of minutes rather than seconds), remains still usable and the zoom features of the plots help getting at the results anyway.
Of course, genome assembly analysis is necessarily defined and possibly limited by the features of the alignment tool used to produce the alignment files, although QUAST and other currently available tools are mature alignment programs which can effectively process assembled genomes, even of large size such as mammalian genome. ChromoMapper directly supports alignment files produced by the previously mentioned programs which use the file format initially proposed by nucmer; however, it should not be too difficult to support other file formats by converting them before importing or by modifying the import routine. An obvious expansion for a visualization tool producing plots is to make it available as an accessible online service, which could interactively provide rapid recalculation and allow multiscale access to the alignment features through the plot-zooming features. Finally, possible further expansions for ChromoMapper could be in supporting the analysis of metagenomic assemblies to compare genomes from different pathogens or even in evaluating the different assembly steps from contig assembly, starting from short and/or long reads, up to scaffold/chromosome reconstruction, obtained by using Hi-C strategies or others.
Supplementary Material
vbag005_Supplementary_Data
The reference list from the paper itself. Each links out to its DOI / PubMed record.
- 1Bushmanova E , Antipov D, Lapidus A et al rna QUAST: a quality assessment tool for de novo transcriptome assemblies. Bioinformatics 2016;32:2210–2. 10.1093/bioinformatics/btw 21827153654 · doi ↗ · pubmed ↗
- 2Chen Y , Zhang Y, Wang AY et al Accurate long-read de novo assembly evaluation with Inspector. Genome Biol 2021;22:312. 10.1186/s 13059-021-02527-434775997 PMC 8590762 · doi ↗ · pubmed ↗
- 3Clark SC , Egan R, Frazier PI et al ALE: a generic assembly likelihood evaluation framework for assessing the accuracy of genome and metagenome assemblies. Bioinformatics 2013; 29: 435–43. 10.1093/bioinformatics/bts 72323303509 · doi ↗ · pubmed ↗
- 4Diesh C , Stevens GJ, Xie P et al J Browse 2: a modular genome browser with views of synteny and structural variation. Genome Biol 2023;24:74. 10.1186/s 13059-023-02914-z 37069644 PMC 10108523 · doi ↗ · pubmed ↗
- 5Gurevich A , Saveliev V, Vyahhi N et al QUAST: quality assessment tool for genome assemblies. Bioinformatics 2013;29:1072–5. 10.1093/bioinformatics/btt 08623422339 PMC 3624806 · doi ↗ · pubmed ↗
- 6Herron-Olson L , Freeman J, Zhang Q et al MG View: an alignment and visualization tool to enhance gap closure of microbial genomes. Nucleic Acids Res 2003;31:e 106. 10.1093/nar/gng 10712930980 PMC 212826 · doi ↗ · pubmed ↗
- 7Hunt M , Kikuchi T, Sanders M et al REAPR: a universal tool for genome assembly evaluation. Genome Biol 2013;14:R 47. 10.1186/gb-2013-14-5-r 4723710727 PMC 3798757 · doi ↗ · pubmed ↗
- 8Jing X , Emerson M, Masters D et al A visual interactive analytic tool for filtering and summarizing large health data sets coded with hierarchical terminologies (VIADS). BMC Med Inform Decis Mak 2019;19:31. 10.1186/s 12911-019-0750-y 30764811 PMC 6376747 · doi ↗ · pubmed ↗