Risk Factors of Disease Progression in IgA Nephropathy: A Systematic Review and Meta‐Analysis
Dan Xu, Minjie Zhang, Weiwei Liang, Lijiang Fang, Feifei Ge

TL;DR
This study identifies key risk and protective factors for disease progression in IgA nephropathy, a kidney disease that can lead to kidney failure.
Contribution
The study provides a comprehensive meta-analysis of clinical and pathological factors influencing IgA nephropathy progression.
Findings
High blood pressure, elevated serum creatinine, and high LDL cholesterol are significant risk factors for IgA nephropathy progression.
Pathological features like tubular atrophy and segmental glomerulosclerosis strongly predict disease progression.
Higher albumin, eGFR, and female sex are protective against disease progression in IgA nephropathy.
Abstract
IgA nephropathy (IgAN) is an important cause of chronic renal failure, and nearly all patients with IgAN are at risk of developing to end‐stage renal disease (ESRD) during their lifetime. This meta‐analysis aimed to identify and evaluate risk factors associated with the progression of IgAN patients. Primary studies investigating the risk factors for predicting the progression of IgAN were included in this review. A comprehensive literature search was conducted across multiple electronic databases, including the Chinese Biological Medicine Database (CBM), China National Knowledge Infrastructure (CNKI), Cochrane Library, PubMed, Embase, Web of Science, and WANFANG, up to May 30, 2025. Two independent reviewers screened the literature based on the predefined inclusion and exclusion criteria, extracted the relevant data from the original studies, and assessed the quality of the included…
Genes, proteins, chemicals, diseases, species, mutations and cell lines named across the full text — each resolved to its canonical identifier and authoritative record.
Click any figure to enlarge with its caption.
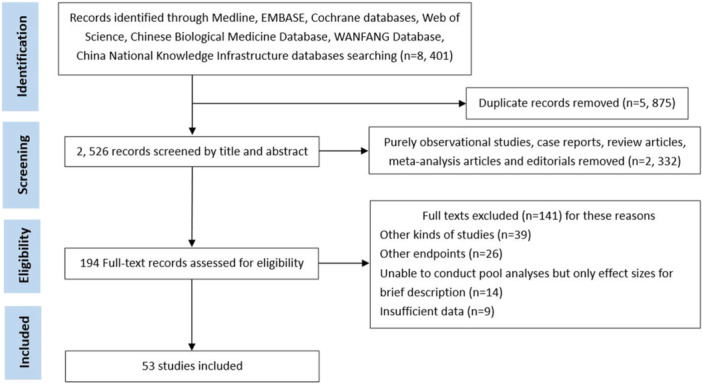 Figure 1
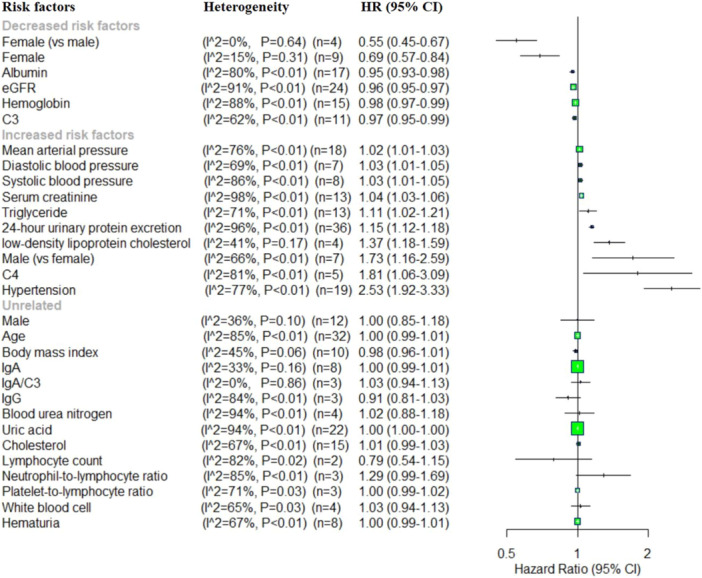 Figure 2
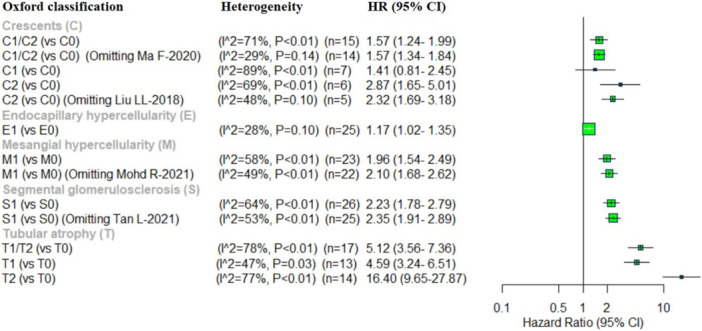 Figure 3
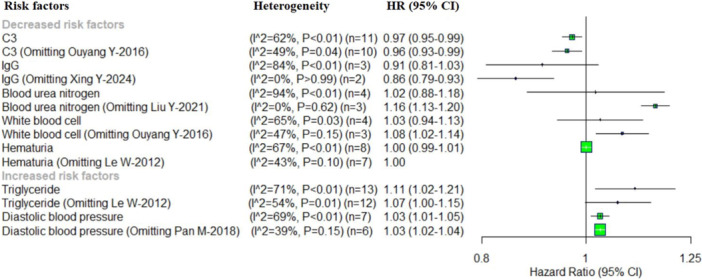 Figure 4
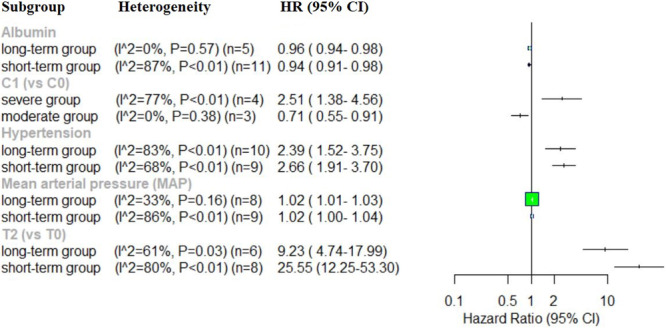 Figure 5
| Factors | Pooled effect | Heterogeneity | Egger's test | |||
|---|---|---|---|---|---|---|
| HR [95%CI] |
|
|
|
|
| |
| Decreased risk factors | ||||||
| Female (vs. male) | 0.55 (0.45–0.67) | < 0.01 | 0 | 0.64 | −0.09 | 0.936 |
| Female | 0.69 (0.57–0.84) | < 0.01 | 15 | 0.31 | 2.31 | 0.054 |
| Albumin | 0.95 (0.93–0.98) | < 0.01 | 80 | < 0.01 | −1.08 | 0.296 |
| eGFR | 0.96 (0.95–0.97) | < 0.01 | 91 | < 0.01 | 0.42 | 0.680 |
| Hemoglobin | 0.98 (0.97–0.99) | < 0.01 | 88 | < 0.01 | −1.32 | 0.209 |
| C3 | 0.97 (0.95–0.99) | 0.01 | 62 | < 0.01 | −0.07 | 0.948 |
| C3 (Omitting Ouyang Y‐2016) | 0.96 (0.93–0.99) | 0.01 | 49 | 0.04 | 0.82 | 0.435 |
| Increased risk factors | ||||||
| Mean arterial pressure | 1.02 (1.01–1.03) | < 0.01 | 76 | < 0.01 | 1.29 | 0.214 |
| Diastolic blood pressure | 1.03 (1.01–1.05) | < 0.01 | 69 | < 0.01 | 0.76 | 0.483 |
| Diastolic blood pressure (Omitting Pan M‐2018) | 1.03 (1.02–1.04) | < 0.01 | 39 | 0.15 | −0.81 | 0.462 |
| Systolic blood pressure | 1.03 (1.01−1.05) | < 0.01 | 86 | < 0.01 | 3.38 | 0.015 |
| Serum creatinine | 1.04 (1.03−1.06) | < 0.01 | 98 | < 0.01 | 2.59 | 0.027 |
| Triglyceride | 1.11 (1.02−1.21) | 0.02 | 71 | < 0.01 | 2.72 | 0.020 |
| Triglyceride (Omitting Le W‐2012) | 1.07 (1.00−1.15) | 0.06 | 54 | 0.01 | 2.44 | 0.035 |
| 24‐h urinary protein excretion | 1.15 (1.12−1.18) | < 0.01 | 96 | < 0.01 | 5.84 | 0.000 |
| Low‐density lipoprotein cholesterol | 1.37 (1.18−1.59) | < 0.01 | 41 | 0.17 | 5.42 | 0.032 |
| Male (vs. female) | 1.73 (1.16−2.59) | < 0.01 | 66 | < 0.01 | 0.20 | 0.851 |
| C4 | 1.81 (1.06−3.09) | 0.03 | 81 | < 0.01 | 0.60 | 0.590 |
| Hypertension | 2.53 (1.92−3.32) | < 0.01 | 77 | < 0.01 | −0.72 | 0.484 |
| Unrelated | ||||||
| Male | 1.00 (0.85–1.18) | 0.99 | 36 | 0.10 | 0.22 | 0.829 |
| Age | 1.00 (0.99–1.01) | 0.58 | 85 | < 0.01 | −0.13 | 0.897 |
| Body mass index | 0.98 (0.96–1.01) | 0.20 | 45 | 0.06 | −0.61 | 0.559 |
| IgA | 1.00 (0.99–1.01) | 0.06 | 33 | 0.16 | −1.57 | 0.167 |
| IgA/C3 | 1.03 (0.94–1.13) | 0.52 | 0 | 0.86 | −0.06 | 0.962 |
| IgG | 0.91 (0.81–1.03) | 0.15 | 84 | < 0.01 | −5.46 | 0.115 |
| IgG (Omitting Xing Y‐2024) | 0.86 (0.79–0.93) | < 0.01 | 0 | > 0.99 | NA | NA |
| Blood urea nitrogen | 1.02 (0.88–1.18) | 0.83 | 94 | < 0.01 | −1.76 | 0.221 |
| Blood urea nitrogen (Omitting Liu YY‐2021) | 1.16 (1.13–1.20) | < 0.01 | 0 | 0.62 | 4.59 | 0.136 |
| Uric acid | 1.00 (1.00–1.00) | 0.03 | 94 | < 0.01 | 3.29 | 0.004 |
| Cholesterol | 1.01 (0.99–1.03) | 0.37 | 67 | < 0.01 | 1.58 | 0.139 |
| Lymphocyte count | 0.79 (0.54–1.15) | 0.21 | 82 | 0.02 | NA | NA |
| Neutrophil‐to‐lymphocyte ratio | 1.29 (0.99–1.69) | 0.06 | 85 | < 0.01 | 0.80 | 0.571 |
| Platelet‐to‐lymphocyte ratio | 1.00 (0.99–1.02) | 0.57 | 71 | 0.03 | 3.31 | 0.187 |
| White blood cell | 1.03 (0.94–1.13) | 0.48 | 65 | 0.03 | −0.81 | 0.503 |
| White blood cell (Omitting Ouyang Y‐2016) | 1.08 (1.02–1.14) | < 0.01 | 47 | 0.15 | −0.73 | 0.597 |
| Hematuria | 1.00 (0.99–1.01) | 0.89 | 67 | < 0.01 | −1.02 | 0.348 |
| Hematuria (Omitting Le W‐2012) | 1.00 (1.00–1.00) | 0.97 | 43 | 0.10 | −0.39 | 0.712 |
| Oxford classification | ||||||
| C1/C2 (vs. C0) | 1.57 (1.24–1.99) | < 0.01 | 71 | < 0.01 | 5.73 | 0.000 |
| C1/C2 (vs. C0) (Omitting Ma F‐2020) | 1.57 (1.34–1.84) | < 0.01 | 29 | 0.14 | 2.04 | 0.064 |
| C1 (vs. C0) | 1.41 (0.81–2.45) | 0.22 | 89 | < 0.01 | 1.02 | 0.353 |
| C2 (vs. C0) | 2.87 (1.65–5.01) | < 0.01 | 69 | < 0.01 | 0.18 | 0.863 |
| C2 (vs. C0) (Omitting Liu LL‐2018) | 2.32 (1.69–3.18) | < 0.01 | 48 | 0.10 | 0.08 | 0.943 |
| E1 (vs. E0) | 1.17 (1.02–1.35) | 0.03 | 28 | 0.10 | 1.18 | 0.250 |
| S1 (vs. S0) | 2.23 (1.78–2.79) | < 0.01 | 64 | < 0.01 | −0.18 | 0.857 |
| S1 (vs. S0) (Omitting Tan L‐2021) | 2.35 (1.91–2.89) | < 0.01 | 53 | < 0.01 | −1.50 | 0.147 |
| T1/T2 (vs. T0) | 5.12 (3.56–7.36) | < 0.01 | 78 | < 0.01 | 0.85 | 0.407 |
| T1 (vs. T0) | 4.59 (3.24–6.51) | < 0.01 | 47 | 0.03 | 2.16 | 0.054 |
| T2 (vs. T0) | 16.40 (9.65–27.87) | < 0.01 | 77 | < 0.01 | 1.08 | 0.300 |
| M1 (vs. M0) | 1.96 (1.54–2.49) | < 0.01 | 58 | < 0.01 | −1.57 | 0.131 |
| M1 (vs. M0) (Omitting Mohd R‐2021) | 2.10 (1.68–2.62) | < 0.01 | 49 | < 0.01 | −1.63 | 0.120 |
Peer Reviews
No public reviews on file for this paper yet. If you reviewed it on a platform where reviews are public (OpenReview, ICLR, NeurIPS, ICML), you can paste yours below so the community can read it here.
Videos
No videos yet. Explain this paper in a talk, walkthrough, or lecture? Add one.
Taxonomy
TopicsRenal Diseases and Glomerulopathies · Chronic Kidney Disease and Diabetes · Kidney Stones and Urolithiasis Treatments
Introduction
1
IgA nephropathy (IgAN) is the most prevalence form of primary glomerulonephritis worldwide [1]. Its clinical course is highly variable, ranging from begin, asymptomatic presentations to rapid progression toward chronic kidney failure. Although a small proportion of patients experience a swift decline in renal function, a substantial develop end stage renal disease (ESRD) gradually over long‐term follow‐up [2]. Accurately identifying individuals at elevated risk of disease progression remains significant clinical challenge. Therefore, primary prevention strategies, particularly early detection and effective management of modifiable risk factors, are needed to improve renal outcomes of IgAN. IgAN diagnosis is usually performed by collecting a renal biopsy, which allows direct visualization of pathological changes in the glomeruli [3]. Histopathological remains the “gold standard” for diagnosis and prognostic evaluation in most patients. Indeed, renal biopsy findings have demonstrated substantial value in risk stratification [4]. However, renal biopsy is an invasive procedure with potential contraindications and a risk of adverse events. Furthermore, the long clinical course of IgAN often includes acute exacerbations and episodes of acute kidney injury (AKI). Under such circumstances, pathological information obtained at disease onset may not reliably predict renal progression [5]. Therefore, developing accurate and dynamic risk assessment tools for patients with IgAN holds both scientific and practical importance. Previous studies have identified several demographics, clinical and biochemical parameters associated with adverse outcomes. These include heavy proteinuria, reduced renal function, hypertension at the time of renal biopsy, the degree of renal impairment at diagnosis and laboratory measures such as serum creatinine (SCr), uric acid (UA), serum lipids, albumin (Alb), and hemoglobin (Hb) [6, 7].
In addition, the Oxford classification of IgAN, based on renal histopathology, is regarded as the most robust early histological predictor of disease progression [8]. The Oxford classification evaluates pathological features mesangial hypercellularity (M), endocapillary hypercellularity (E), segmental glomerulosclerosis (S), tubular atrophy/interstitial fibrosis (T), and crescent (C), culminating in MEST‐C scores system [6]. M0 was defined as a mesangial hypercellularity score ≤ 0.5; and M1 was defined as a mesangial hypercellularity score > 0.5 (equal to > 50% of the glomeruli with > 3 mesangial cells in the Periodic Acid‐Schiff staining). Endocapillary hypercellularity is classified E0 (absent) or E1 (present). Segmental glomerulosclerosis is scored as S0 (absent) or S1 (present, including adhesions). According to the level of tubular atrophy and interstitial fibrosis, T‐lesions were classified into three types: T0 was defined as tubular atrophy or interstitial fibrosis less than 25%, T1 was defined as > 25% and ≤ 50% tubular atrophy or interstitial fibrosis, and T2 was defined as tubular atrophy or interstitial fibrosis more than 50%, respectively. C0 is defined as the absence of crescents, C1 is defined as crescents in ≤ 25% of glomeruli, and > 25% of glomeruli as C2 [9]. Of them, the T score is the most valuable histological parameter, confirmed by a large number of original studies [10].
T‐lesions are not merely a micromorphological feature of IgAN but present a final common pathway in the progressive of many chronic kidney diseases, ultimately leading to advanced chronic kidney disease (CKD) [11]. Crescent formations are another frequently observed pathological feature in IgAN; their presence is closely associated with adverse clinicopathological characteristics, including higher proteinuria levels and elevated SCr [12]. However, the association between distinct proportions of crescents and the progression of IgAN remains a subject of ongoing debate within the medical community. The substantial clinical and pathological heterogeneity of IgAN leads to considerable inter‐individual variability in disease progression. Few studies have systematically evaluated the precise predictive value of all five Oxford classification lessons for IgAN progression. Furthermore, while some studies have identified several demographics, biochemical and pathological predictors, others have questioned their consistency and predictive reliability [13]. Therefore, a comprehensive synthesis of current evidence is urgently needed to clarify the association between these risk factors and disease progression. This meta‐analysis aims to address this gap by integrating available data to improve the understanding of risk assessment methods for IgAN progression and to inform more accurate prognostic evaluation.
Materials and Methods
2
Search Strategy
2.1
A comprehensive literature search was conducted across the Chinese Biological Medicine Database (CBM), China National Knowledge Infrastructure (CNKI), Cochrane Library, Medline via PubMed, Embase, Web of Science, and WANFANG databases. The search included original articles published between January 1, 2000 and May 30, 2025 and was restricted to studies published in English or Chinese. The following keywords or phrases were used: “IgA nephropathy” OR “glomerulonephritides” OR “IgA glomerulonephritis” OR “Immunoglobulin A nephropathy” OR “IgA type nephritis” OR “IgA nephropathy 1” combined with “kidney disease progression” OR “end‐stage renal disease” OR “kidney failure” OR “IgAN progression” OR “risk factors” OR “adverse kidney outcomes” OR “renal outcomes” OR “adverse outcomes” OR “progressive kidney disease” OR “renal disease progression” OR “deterioration of renal function” OR “renal endpoint” OR “progression to ESRD” OR “composite endpoint” OR “poor renal outcomes” OR “composite event.” Two reviewers independently screened titles and abstracts for relevance, followed by full text assessment of potentially eligible studies. Discrepancies were resolved through discussion or consultation with a third reviewer. Studies examining the association between various risk factors and IgAN progression were included. Additional relevant articles were obtained through a manual search of reference lists from retrieved studies.
Inclusion and Exclusion Criteria
2.2
Studies were eligible for inclusion if they met all of the following criteria: (1) Included participants with biopsy‐confirmed IgAN. (2) Reported kidney related endpoints as the primary or secondary outcome. (3) Provide data on at least one prespecified kidney outcomes. (4) Followed participants for a minimum duration of 6 months. (5) Reported effect estimates, hazard ratios (HRs) with corresponding 95% confidence intervals (CIs). (6) Analyzed at least one potential risk factor for IgAN progression.
Studies were excluded if they met any of the following conditions: (1)Included patients with secondary IgAN, such as those associated with Henoch‐Schonlein purpura, ankylosing spondylitis, psoriasis or liver disease. (2) Included patients with a second coexisting disease on kidney disease confirmed by biopsy, like diabetic nephropathy. (3) Enrolling patients who had received corticosteroids or other immunosuppressive therapy before renal biopsy. (4) Review article, case report, or conference articles.
Data Extraction and Quality Assessment
2.3
The literature search, data extraction, and quality assessment were conducted independently by two reviewers. The following information was extracted from each study: first author's name, year of publication, study design, primary outcome, description of the outcome events, sample size, average age, female/male (F/M) ratio, and follow‐up durations. The methodological quality of the included studies was assessed using the Newcastle‐Ottawa scale (NOS), with scores ranging from 0 to 8. Studies scoring ≥ 7 were considered high‐quality, whereas those scoring < 6 were deemed to have a high risk of bias. Two independent reviewers evaluated the quality of each study, discrepancies in study selection, or quality scoring were resolved through discussion with a third reviewer. The results of the quality assessment are shown in Table S1.
Statistical Analysis
2.4
All statistical analysis was conducted using R software. HRs with 95% CIs were extracted from each eligible study by two independent researchers. For both categorical and continuous variables, pooled effect sizes were calculated and reported as HRs with corresponding 95% CIs. The potential heterogeneity of the studies was assessed by the inconsistency index (Ι ^2^) and Cochran‐Q statistic. And I ^2^ values 50% ≤ were considered as indicative of low heterogeneity, whereas values > 50% indicated high heterogeneity. Statistical significance for heterogeneity was defined as p < 0.05 for the Cochrane Q test. In case of significant heterogeneity, a random effects model was applied for data synthesis, otherwise, a fixed‐effect model was used. To further investigate the potential source of heterogeneity, subgroup analysis was performed based on predefined covariates. Additionally, sensitivity analysis was also conducted to assess the impact of each individual study on the overall results. Publication bias was evaluated using Egger's tests, with p values < 0.05 indicating significant bias.
Results
3
Study Characteristics
3.1
The initial database search yielded 8401 articles, of which 5875 articles were duplicates. After duplicates removal 2526 records remained for screening. Following full‐text assessment, 141 articles were excluded and 53 articles [14, 15, 16, 17, 18, 19, 20, 21, 22, 23, 24, 25, 26, 27, 28, 29, 30, 31, 32, 33, 34, 35, 36, 37, 38, 39, 40, 41, 42, 43, 44, 45, 46, 47, 48, 49, 50, 51, 52, 53, 54, 55, 56, 57, 58, 59, 60, 61, 62, 63, 64, 65, 66] involving 25,517 patients were included in the final analysis. The sample sizes ranged from 24 to 1818 patients. Across studies, the percentage of males’ patients was 50.47%, with a mean follow‐up duration ranging from 6 to 113 months; three studies [31, 32, 56] did not report follow‐up data. The follow‐up endpoints varied among the included studies. The study included 43 retrospective cohort studies, 8 prospective cohort studies, and 2 observational cohort studies. The detailed characteristics of the included articles are shown in Table S2, and the article selection and screening processes are illustrated in Figure 1.
Flow diagram of the literature selection and screening process.
Data Synthesis and Meta‐Analysis
3.2
Demographics and clinical data: this meta‐analysis showed that the identified several factors significantly associated with an increased risk of IgAN progression. These included mean arterial pressure (MAP) (HR = 1.02, 95% CI: 1.01–1.03), diastolic blood pressure (DBP) (HR = 1.03, 95% CI: 1.01–1.05), systolic blood pressure (SBP) (HR = 1.03, 95% CI: 1.01–1.05), SCr (HR = 1.04, 95% CI: 1.03–1.06), triglyceride (HR = 1.11, 95% CI: 1.02–1.21), 24‐h urinary protein excretion (UPE) (HR = 1.15, 95% CI: 1.12–1.18), low‐density lipoprotein cholesterol (LDL‐C) (HR = 1.37, 95% CI: 1.18–1.59), male sex (vs. female) (HR = 1.73, 95% CI: 1.16–2.59), complement C4 (C4) (HR = 1.81, 95% CI: 1.06–3.09), and hypertension (HR = 2.53, 95% CI: 1.92–3.33). Conversely, several variable factors were associated with a reduce risk progression, including female sex (vs. male) (HR = 0.55, 95% CI: 0.45–0.67), and HR = 0.69, 95% CI: 0.57–0.84 in sperate analyses, serum Alb (HR = 0.95, 95% CI: 0.93–0.98), estimated glomerular filtration rate (eGFR) (HR = 0.96, 95% CI: 0.95–0.97), Hb (HR = 0.98, 95% CI: 0.97–0.99) and complement (C3) (HR = 0.97, 95% CI: 0.95–0.99). No statistically significant associations were observed for male (HR = 1.00, 95% CI: 0.85–1.18), age (HR = 1.00, 95% CI: 0.99–1.01), body mass index (BMI) (HR = 0.98, 95% CI: 0.96–1.01), IgA (HR = 1.00, 95% CI: 0.99–1.01), IgA/C3 ratio (HR = 1.03, 95% CI: 0.94–1.13), IgG (HR = 0.91, 95% CI: 0.81–1.03), blood urea nitrogen (BUN) (HR = 1.02, 95% CI: 0.88–1.18), UA (HR = 1.00, 95% CI: 1.00–1.00), cholesterol (HR = 1.01, 95% CI: 0.99–1.03), lymphocyte (LY) count (HR = 0.79, 95% CI: 0.54–1.15), neutrophil‐to‐lymphocyte ratio (NLR) (HR = 1.29, 95% CI: 0.99–1.69), platelet‐to‐lymphocyte ratio (PLR) (HR = 1.00, 95% CI: 0.99–1.02), white blood cells (WBCs) (HR = 1.03, 95% CI: 0.94–1.13), and hematuria (HR = 1.00, 95% CI: 0.99–1.01) (Figure 2).
Forest plot of the pooled HRs for demographics and clinical risk factors in IgAN progression.
Oxford classification: regarding the correlation between five pathologic lesions of Oxford classification and kidney disease progression in IgAN, this meta‐analysis identified a significant correlation between E, M, S and T scores. The pooled results showed that C1/C2 (vs. C0) (HR = 1.57, 95% CI: 1.24–1.99), C2 (vs. C0) (HR = 2.87, 95% CI: 1.65–5.01), E1 (vs. E0) (HR = 1.17, 95% CI: 1.02–1.35), M1 (vs. M0) (HR = 1.96, 95% CI: 1.54–2.49), S1 (vs. S0) (HR = 2.23, 95% CI: 1.78–2.79), T1/T2 (vs. T0) (HR = 5.12, 95% CI: 3.56–7.36), T1 (vs. T0) (HR = 4.59, 95% CI: 3.24–6.51) and T2 (vs. T0) (HR = 16.40, 95% CI: 9.65–27.87) were significantly associated with increased risk of IgAN progression. In contrast, C1 (vs. C0) (HR = 1.41, 95% CI: 0.81–2.45) showed a positive association with kidney disease progression in IgAN, however, this correlation did not reach statistical significance (Figure 3).
Forest plot of the pooled HRs for five pathologic lesions and sensitivity analysis in IgAN progression.
Heterogeneity Test and Sensitivity Analysis
3.3
A heterogeneity analysis was conducted for the identified risk factors, revealing significant heterogeneity for several variables, including Alb (I ^2^ = 80%, p < 0.01), eGFR (I ^2^ = 91%, p < 0.01), Hb (I ^2^ = 88%, p < 0.01), C3 (I ^2^ = 62%, p < 0.01), MAP (I ^2^ = 76%, p < 0.01), DBP (I ^2^ = 69%, p < 0.01), SBP (I ^2^ = 86%, p < 0.01), SCr (I ^2^ = 98%, p < 0.01), triglyceride (I ^2^ = 71%, p < 0.01), 24‐h UPE (I ^2^ = 96%, p < 0.01), male (vs. female) (I ^2^ = 66%, p < 0.01), C4 (I ^2^ = 81%, p < 0.01), hypertension (I ^2^ = 77%, p < 0.01), age (I ^2^ = 85%, p < 0.01), IgG (I ^2^ = 84%, p < 0.01), BUN (I ^2^ = 94%, p < 0.01), UA (I ^2^ = 94%, p < 0.01), cholesterol (I ^2^ = 67%, p < 0.01), LY count (I ^2^ = 82%, p < 0.01), NLR (I ^2^ = 85%, p < 0.01), PLR (I ^2^ = 71%, p = 0.03), WBCs (I ^2^ = 65%, p = 0.03), and hematuria (I ^2^ = 67%, p < 0.01). Sensitivity analysis, conducted using R software, involved iteratively omitting individual studies to determine potential sources of heterogeneity. Excluding “Ouyang 2016” reduced heterogeneity for C3 (HR = 0.96, 95% CI, 0.93–0.99; I ^2^ = 49%, p = 0.04) while removing “Le W 2012” reduced heterogeneity for triglyceride (HR = 1.07, 95% CI, 1.00–1.15; I ^2^ = 54%, p = 0.01). Excluding “Xing Y 2024” completely eliminated heterogeneity for IgG (HR = 0.86, 95% CI, 0.79–0.93; I ^2^ = 0%, p > 0.99). Similarly, when “Liu Y 2021” was removed, heterogeneity for BUN was eliminated (HR = 1.16, 95% CI, 1.13–1.20; I ^2^ = 0%, p = 0.62). Omitting “Ouyang 2016” also eliminated significant heterogeneity for WBCs (HR = 1.08, 95% CI, 1.02–1.14; I ^2^ = 47%, p = 0.15) and excluding “Le W 2012” eliminated heterogeneity for hematuria (HR = 1.00; I ^2^ = 43%, p = 0.10). When “Pan M 2018” was removed, no significant heterogeneity was observed for DBP (HR = 1.03, 95% CI, 1.02–1.04; I ^2^ = 39%, p = 0.15). No single study significantly affected the observed association of these risk factors with the progression of IgAN (C3, hematuria and DBP). However, the pooled HR of the IgG became significantly associated with decreased risk of IgAN progression when the study by “Xing Y 2024” was excluded. In contrast, the omission of “Liu Y 2021” significantly affected the pooled HR for BUN, while the omission of “Ouyang 2016” had a substantial impact on the pooled HR for WBCs. Excluding either “Liu Y 2021” or “Ouyang 2016” shifted the pooled HR from a statistically non‐significant to significant association. Meanwhile, omitting a single study, no significant heterogeneity was observed for IgG, BUN, WBCs, hematuria, and DBP (Figure 4).
Forest plot of the sensitivity analysis for demographics and clinical risk factors.
Additionally, we investigated heterogeneity among the five pathologic lesions in Oxford classification. Significantly high heterogeneity was observed for C1/C2(vs. C0), C1 (vs. C0), C2 (vs. C0), M1 (vs. M0), S1 (vs. S0), S1, T1/T2 (vs. T0), T1 (vs. T0), and T2 (vs. T0). Sensitivity analysis was conducted to identify possible sources of heterogeneity for each score. For C1/C2(vs. C0), heterogeneity was reduced to a non‐significant level (HR = 1.57, 95% CI, 1.34–1.84; I ^2^ = 29%, p = 0.14) upon exclusion of “Ma F 2020.” Similarly, for C2 (vs. C0) exclusion of “Liu LL 2018” reduced heterogeneity to a non‐significant level (HR = 2.32, 95% CI, 1.69–3.18; I ^2^ = 48%, p = 0.10). Omitting “Mohd R 2021” decreased heterogeneity for M1 (vs. M0) (HR = 2.10, 95% CI, 1.68–2.62; I ^2^ = 49%, p < 0.01), while removal of Tan L 2021” reduced heterogeneity for S1 (vs. S0) (HR = 2.35, 95% CI, 1.91–2.89; I ^2^ = 53%, p < 0.01) (Figure 3).
Subgroup Analysis
3.4
Excluding any single study did not significantly reduce the heterogeneity across the studies in the analysis of Alb, eGFR, Hb, MAP, SBP, SCr, 24‐h UPE, male (vs. female), C4, hypertension, age, UA, cholesterol, LY count, NLR, and PLR. A subgroup analysis was conducted based on follow‐up period and primary outcome, the follow‐up period was categorized as “short‐term” (< 47.8 months) and “long‐term” (≥ 47.8 months), while the primary outcomes were classified into the “severe” group and “moderate” groups, to identify the potential sources of heterogeneity among the studies of the aforementioned risk factors. In the subgroup analysis of Alb, the “short‐term” follow‐up group exhibited higher heterogeneity (I ^2^ = 87%, p < 0.01) compared to the “long‐term” follow‐up group (I ^2^ = 0%, p = 0.57), with no significant heterogeneity observed in the “long‐term” subgroup. Similarly, for MAP, the “short‐term” follow‐up group exhibited higher heterogeneity (I ^2^ = 86%, p < 0.01) than the “long‐term” group (I ^2^ = 33%, p = 0.16), with no significant heterogeneity in the “long‐term” subgroup. For hypertension, the “short‐term” group exhibited reduced heterogeneity (I ^2^ = 68%, p < 0.01) compared to the “long‐term” group (I ^2^ = 83%, p < 0.01). However, T2 (vs. T0), the “short‐term” follow‐up group had higher heterogeneity (I ^2^ = 80%, p < 0.01) compared to the “long‐term” group (I ^2^ = 61%, p = 0.03). Subgroup analysis based on primary outcome revealed that the “severe” group exhibited higher heterogeneity (I ^2^ = 77%, p < 0.01) than the “moderate” group (I ^2^ = 0%, p = 0.38), with no significant heterogeneity observed in the “moderate” group for C1 (vs. C0) (Figure 5). Both sensitivity and subgroup analysis were performed to identify potential sources of heterogeneity, however, no contributing factors were identified for the eGFR, Hb, SBP, SCr, 24‐h UPE, male (vs. female), C4, age, UA, cholesterol, LY count, NLR, PLR, and T1/T2 (vs. T0).
Forest plot of subgroup analysis.
Risk of Bias Assessment
3.5
Publication bias in the included studies was assessed. Egger's tests revealed no significant publication bias, except for the analysis of SBP, SCr, triglyceride, 24‐h UPE, LDL‐C, UA, and C1/C2 (vs. C0) (as shown in Table 1).
Discussion
4
IgAN is a common, multifactorial kidney disease influenced by a complex interplay of genetic, immunological, and environmental factors. Autoimmunity and inflammation are considered the fundamental mechanisms driving its development and progression [67]. Over recent decades, numerous factors have been identified as being associated with the progression of IgAN. Although clinical and histopathological risk factors have classically been applied in routine practice to guide the therapeutic plan for IgAN [68], the predictive role of some of the identified risk factors remains under investigation. In this meta‐analysis, we comprehensively identify the association between various clinical factors and the progression of IgAN. Additionally, the Oxford classification is widely accepted as a histopathology tool for predicting renal outcomes in IgA nephropathy [6]. Previous studies showed that the presence and severity of pathological changes defined by the MEST‐C scoring in the Oxford classification are associated with differing risks of disease progression [69]. Accordingly, this analysis explored the correlation between the five pathological lesions in the Oxford classification and the advancement of kidney disease in IgAN. Our finding indicates that, in the blood pressure category, higher MAP, higher SBP, higher DBP and the presence of hypertension were all significantly associated with an increased risk of IgAN progression. Moreover, IgAN itself can contribute to the onset of hypertension, given the kidney's central role in the regulation of blood pressure. In IgAN, the deposition of immune complexes in the mesangial areas of the glomeruli triggers local inflammation and subsequent kidney damage, thereby exacerbating hypertension and disease progression [70, 71]. Kidney damage leads to sodium retention and activation of the renin‐angiotensin‐aldosterone system, resulting in renal hypertension. Therefore, effective blood pressure control is essential for disease management and has a significant influence on quality of life [72]. Intensive blood pressure control strategies, aimed at reducing cardiovascular risks by targeting SBP levels below conventional thresholds, have emerged as a pivotal approach in hypertension management [72, 73]. However, no studies have yet reported on the relationship between effective blood pressure control and kidney prognosis in patients with IgAN. Among biochemical parameters, this meta‐analysis demonstrated that elevated triglycerides and LDL‐C levels were associated with increased risk of IgAN progression, whereas cholesterol levels were not significantly associated. IgAN is often accompanied by abnormal lipid metabolism [74], which is a known risk factor for cardiovascular events and can influence disease progression and prognosis. Hyperlipidemia, one of the most common types of dyslipidemia in IgAN, can cause glomerular sclerosis and renal tubular fibrosis, thereby increasing the risk of renal dysfunction progression [75]. The podocyte apoptosis and endothelial dysfunction induced by hypertriglyceridemia are possible underlying mechanism [76]. In addition, studies have shown that lipid accumulation and lipotoxicity can impair the function of glomerular podocytes and proximal renal tubular epithelial cells [77]. Both hypercholesterolemia and hypertriglyceridemia have been reported to be associated with deterioration of renal function in adult patients with IgAN [21].
Proteinuria is an established independent predictor for IgAN progression and plays an important role in both the diagnosis of kidney disease and the monitoring of disease activity [78]. It is the second most common clinical feature of IgAN after hematuria, and the most widely used method for its assessment is 24‐h UPE. Previous research [79] has shown that early remission of proteinuria, especially spontaneous remission within a short period, can significantly improve the prognosis of IgAN patients with nephrotic syndrome (NS). This underscores the importance of considering both the clinical significance of proteinuria and its impact on disease progression. In our study, the 24‐h UPE at the time of biopsy was found to be associated with kidney disease progression in IgAN patients. Additionally, we observed that elevated SCr, higher C4 levels, and male sex (vs. female) were associated with IgAN progression. In recent years, studies demonstrated that complement activation occurred locally in IgAN, several studies reported that systemic complement activation may also be present. In particular, Tringali et al. showed that decreased C3 and increased C4 levels are associated with poor renal prognosis in IgAN [80], suggesting that complement system activation is crucial in IgAN pathogenesis. Pan et al. showed that increased serum C4 and decreased C3 levels at renal biopsy were associated with poor renal prognosis in patients with IgAN [81]. Moreover, decreased serum C3 levels were independently predictive of renal outcome in the multivariate analysis [20]. This study also showed that serum C3 levels at the time of renal biopsy were significantly associated with decreased risks of IgAN progression. However, serum C4 levels were identified as an independent risk factor for disease progression. The mechanism underlying the association between elevated serum C4 levels and poor IgAN prognosis remains unclear. The present study demonstrated that high serum C4 levels correlated with more severe clinical and pathological manifestations [15], which were in turn strongly associated with increased risk of renal progression [82].
Elevated SCr at the time of IgAN diagnosis generally reflects impaired renal function and more advanced disease severity. SCr serves as an indirect marker of eGFR and may therefore reflect the extent of underlying structural and functional renal damage. Numerous studies have shown that progression of renal injury is significantly associated with elevated baseline SCr levels. These findings suggest that increased SCr may result from glomerular injury and declining filtration capacity, which are central features of lgAN progression. Accordingly, elevated SCr at diagnosis can be interpreted as an important prognostic indicator and a risk factor for accelerated progression to end‐stage renal disease ESRD. This study suggests that a high SCr level is a risk factor for the progression of IgAN. Intriguingly, serum UA is also attracting increasing attention as a potential risk factor. However, previous studies exploring the relationship between serum UA levels and IgAN progression have yielded inconsistent results. Some studies found that hyperuricemia may be an independent risk factor for the development of ESRD in patients with IgAN [83, 84], whereas other studies found that the association was not statistically significant. It is important to note that the treatment and management of IgAN is a long‐term process, and serum UA levels may fluctuate as the disease progresses. In our study, serum UA levels and BUN levels were not significantly associated with IgAN progression. As for laboratory indicators, a complete blood count test, commonly performed in clinical practice, measures key blood components such as WBCs, neutrophils (NEs), lymphocytes (LYs), and platelets (PLTs). In our study, we evaluated the effects of LY count, NLR, PLR, and WBC count on predicting IgAN progression. The results showed that none of the hematological indices were associated with IgAN progression suggesting that the factors beyond hematological parameters may play a more substantial role in disease advancement.
Additionally, we found that the presence of hematuria at the time of biopsy was not associated with kidney disease progression in IgAN patients. Some studies have revealed that remission of hematuria may delay the progression of renal function and reduce the occurrence of adverse renal outcomes [85]. It is important to note that conflicting results among different studies highlight the complexity of IgAN and underscore the need for more clinical evidence to clarify its guiding significance for clinical practice. We also found that IgA, IgA/C3, IgG, sex (male), age, and BMI at diagnosis were not associated with IgAN progression. Furthermore, previous meta‐analysis indicated that high BMI was significantly associated with the incidence of adverse renal outcomes and deteriorated eGFR at the last follow‐up [86]. Iseki et al. presented that obesity was associated with increased risk for the incidence of ESRD in CKD [87]. However, in this study, based on meta‐analysis of 10 studies, we found no significant correlation between BMI and IgAN progression. Anemia is a common complication of CKD, some studies have investigated the effect of serum Hb on the renal progression of IgAN. Moreover, Oh et al. have suggested that hemoglobin at diagnosis was an independent predictor for IgAN progression [88]. Renal anemia is due to various mechanisms, previous studies emphasize the role of chronic hypoxia in the tubulointerstitium as a final common pathway to ESRD. Anemia might accelerate renal function decline by inducing tubulointerstitial hypoxia [89]. This meta‐analysis demonstrated that increased Hb levels at the time of renal biopsy were significantly associated with a decreased risk of IgAN progression. Therefore, to determine whether early clinical intervention for anemia might delay IgAN progression, high‐quality RCTs are needed. In healthy men and women, an approximately 12% difference of mean Hb levels in venous blood has been reported, with men having higher Hb levels than women [90]. Based on our findings, increased Hb level was identified as a protective factor in IgAN patients. However, we found that male sex was associated with a higher risk of the progression of IgAN compared with female sex. Despite the difference in venous Hb levels, there was no interaction effect between Hb and sex on the progression of IgAN. We presumed that although increased Hb is significantly associated with a decreased risk of IgAN progression, it remains unknown whether early clinical intervention for renal anemia has renoprotective effects.
The Oxford classification is widely accepted as a histopathology tool for predicting kidney outcomes in IgAN. M‐lesions, S‐lesions, particularly T1 and T2, and C‐lesions are strongly associated with disease progression, independent of laboratory and clinical parameters. The predictive role of E‐lesions has been linked to immunosuppressive therapy [13, 91]. Park et al. reported that M‐lesions, S‐lesions, and C‐lesions, which reflect the intraglomerular activity of the disease, were significant risk factors for poor prognosis [92]. In our study, the association of C1/C2 (vs. C0) with IgAN progression was significant, whereas significant high heterogeneity was observed. Sensitivity analysis indicated that “Ma F 2020” primarily contributed to this heterogeneity in the analysis of C1/C2 (vs. C0) (I ^2^ = 29%, p = 0.14, omitting “Ma F 2020”). We also found a significant association between C2 and IgAN progression, whereas no association was identified for C1 and IgAN progression. Removing “Liu LL 2018” reduced heterogeneity in the C2 (vs. C0) analysis (I ^2^ = 48%, p = 0.10, omitting “Liu LL 2018”). E1 (vs. E0) was not associated with IgAN progression, and sensitivity analysis revealed that this association of E1 (vs. E0) with IgAN progression was unstable and altered by the exclusion of individual studies. Although Chakera et al. found that the baseline eGFR, proteinuria, and E score were independent predictors of time to ESRD and rapid decline in eGFR [93]. E‐lesions typically not a significant prognostic factor in native IgAN have been associated with poor graft outcomes in recurrent disease. Overall, the evidence supporting E‐lesions as a risk factor for IgAN progression is marginal. Lim et al. reported that adding clinical variables at the time of biopsy (elevated SCr level, proteinuria, and decreased eGFR) to S‐lesions and T‐lesions improved the prediction of IgAN progression [94]. Our meta‐analysis produced similar results, with T‐lesions showing the highest risk association: HR increased from 4.59 in T1 (vs. T0) to 5.12 and 16.40 in the T1/T2 (vs. T0) and T2 (vs. T0), indicating that tubular and interstitial lesions are strong predictors of kidney disease outcomes. The S‐lesions are also well recognized for their predictive value in IgAN [95, 96], and prior studies using repeated eGFR measurement have shown steeper declines in patients with S‐lesions than in those without [95, 97]. Our findings confirm that C‐lesions, M‐lesions, S‐lesions, and T‐lesions (but not E‐lesions and C1) in the Oxford classification are associated strongly with IgAN progression. While the Oxford classification is a useful predictor, each MEST‐C component can be influenced by several confounders, and the total MEST‐C score may provide a more comprehensive measure of disease severity, potentially reconciling differences among individual studies. Treatment decisions for IgAN generally rely on both clinical and histological findings, and the renal prognosis is predicted based on these data. Together, these classifications support more accurate decision‐making by nephrologists, emphasizing that both histological and clinical factors are essential for optimal IgAN management.
Sensitivity analysis was performed using R software to identify possible sources of heterogeneity among the included studies, which examined 23 demographics and clinical factors as well as the five pathologic lesions defined by the Oxford classification. Omitting a single study did not significantly affect the pooled HR for Alb, eGFR, Hb, MAP, DBP, SBP, SCr, 24‐h UPE, male (vs. female), C4, mesangial, hypertension, age, UA, cholesterol, LY count, NLR, PLR, hematuria, C‐lesions, M‐lesions, S‐lesions, and T‐lesions. However, the pooled HR for C3, IgG, BUN, WBCs, triglyceride and E‐lesions were significantly affected by the removal of a single study. Additionally, no significant heterogeneity was observed for WBCs, hematuria, DBP, C1/C2 (vs. C0) and C1 (vs. C0); heterogeneity was eliminated for IgG and BUN; and heterogeneity for C3, triglyceride, M1 (vs. M0) and S1 (vs. S0) was reduced an omitting individual study. Sensitivity analysis revealed that the heterogeneity of WBCs, hematuria, DBP, C1/C2 (vs. C0), C1 (vs. C0), IgG, BUN, C3, triglyceride, M1 (vs. M0) and S1 (vs. S0) was primarily driven by a single study. Due to the pooled HRs for C3, IgG, BUN, WBCs, triglyceride, E‐lesions were significantly affected by the omission of a single study and the heterogeneity results for these variables were unstable, the reliability of the evidence from this meta‐analysis for these factors remains uncertain.
Subgroup analysis was conducted to identify the source of heterogeneity for Alb, eGFR, Hb, MAP, SBP, SCr, 24‐h UPE, male (vs. female), C4, hypertension, age, UA, cholesterol, LY count, NLR, and PLR. However, these factors did not explain the unobserved heterogeneity. In the analysis of Alb (I ^2^ = 80%, p < 0.01), heterogeneity was eliminated in the “long‐term” follow‐up group (I ^2^ = 0%, p = 0.57) compared to the “short‐term” follow‐up group (I ^2^ = 87%, p < 0.01). Similarly, in the analysis of MAP (I ^2^ = 76%, p < 0.01), no significant heterogeneity was observed in the “long‐term” follow‐up group (I ^2^ = 33%, p = 0.16) compared to the “short‐term” follow‐up group (I ^2^ = 86%, p < 0.01). In the analysis of T2 (vs. T0) (I ^2^ = 77%, p < 0.01), the “long‐term” follow‐up group (I ^2^ = 61%, p = 0.03) also showed lower heterogeneity compared to the “short‐term” follow‐up group (I ^2^ = 80%, p < 0.01). In contrast, in the analysis of hypertension (I ^2^ = 77%, p < 0.01), the “long‐term” follow‐up group exhibited higher heterogeneity (I ^2^ = 83%, p < 0.01) compared to the “short‐term” follow‐up group (I ^2^ = 68%, p < 0.01). Moreover, in the analysis of C1 (vs. C0) (I ^2^ = 89%, p < 0.01), no heterogeneity was found in the “moderate” group (I ^2^ = 0%, p = 0.38), whereas substantial heterogeneity was present in the “severe” group (I ^2^ = 77%, p < 0.01). These findings suggest that the heterogeneity may be attributed to differences in follow‐up periods, eligibility criteria and study endpoints.
This meta‐analysis has several limitations. First, the sources of heterogeneity were multifaceted, and the high heterogeneity persisted after both sensitivity and subgroup analysis for Alb, eGFR, Hb, MAP, SBP, SCr, 24‐h UPE, male (vs. female), C4, hypertension, age, UA, cholesterol, LY count, NLR, PLR, C1 (vs. C0), T1/T2 (vs. T0) and T2 (vs. T0). Second, considerable variation in follow‐up periods and study endpoints among the included studies may affect the overall findings. Third, kidney disease outcomes were not uniformly defined across studies, and the methodological quality of the included studies was variable. These inconsistencies, along with potential confounding factors, may have impacted the robustness and generalizability of the results.
Conclusions
5
In summary, this study confirms the predictive role of several established risk factors for disease progression, including higher MAP, higher DBP, higher SBP, hypertension, higher proteinuria, the increase in SCr, triglycerides, LDL‐C, C4, and male sex (vs. female). In contrast, increased levels of Alb, eGFR, Hb, and C3 were identified as protective factors in patients with IgAN. Owing to the highly variable nature of IgAN, predicting renal progression based solely on clinical data remains challenging. Furthermore, our findings indicate that C‐lesions, M‐lesions, S‐lesions, and T‐lesions (but not E‐lesions and C1) of the Oxford classification are strongly associated with IgAN progression.
Author Contributions
Dan Xu and Feifei Ge: conception, design, administrative support. Weiwei Liang, Lijiang Fang, and Dan Xu: data analysis, interpretation. Feifei Ge, Minjie Zhang, and Dan Xu: manuscript writing, collection, assembly of data. All authors read and approved the final manuscript.
Conflicts of Interest
The authors declare no conflicts of interest.
Supporting information
Table S1: Quality scores of studies using Newcastle‐Ottawa Scale.
Table S2: Characteristics of the included studies.
The reference list from the paper itself. Each links out to its DOI / PubMed record.
- 1K. N. Lai , S. C. W. Tang , F. P. Schena , et al., “Ig A Nephropathy,” Nature Reviews Disease Primers 2 (2016): 16001, 10.1038/nrdp.2016.1.27189177 · doi ↗ · pubmed ↗
- 2G. D'Amico , “Natural History of Idiopathic Ig A Nephropathy and Factors Predictive of Disease Outcome,” Seminars in Nephrology 24, no. 3 (2004): 179–196, 10.1016/j.semnephrol.2004.01.001.15156525 · doi ↗ · pubmed ↗
- 3I. S. D. Roberts , “Pathology of Ig A Nephropathy: A Global Perspective,” Nephrology 29, no. S 2 (2024): 71–74, 10.1111/nep.14343.39327761 · doi ↗ · pubmed ↗
- 4D. C. Cattran , R. Coppo , H. T. Cook , et al., “The Oxford Classification of Ig A Nephropathy: Rationale, Clinicopathological Correlations, and Classification,” Kidney International 76, no. 5 (2009): 534–545, 10.1038/ki.2009.243.19571791 · doi ↗ · pubmed ↗
- 5Z. Abuduwupuer , Q. Lei , S. Liang , et al., “The Spectrum of Biopsy‐Proven Kidney Diseases, Causes, and Renal Outcomes in Acute Kidney Injury Patients,” Nephron 147, no. 9 (2023): 541–549, 10.1159/000530615.37094563 · doi ↗ · pubmed ↗
- 6R. Coppo , “Clinical and Histological Risk Factors for Progression of Ig A Nephropathy: An Update in Children, Young and Adult Patients,” Journal of Nephrology 30, no. 3 (2017): 339–346, 10.1007/s 40620-016-0360-z.27815919 · doi ↗ · pubmed ↗
- 7Y. Liu , W. Wei , C. Yu , et al., “Epidemiology and Risk Factors for Progression in Chinese Patients With Ig A Nephropathy,” Medicina Clínica 157, no. 6 (2021): 267–273, 10.1016/j.medcli.2020.05.064.32826075 · doi ↗ · pubmed ↗
- 8H. Trimarchi , J. Barratt , D. C. Cattran , et al., “Oxford Classification of Ig A Nephropathy 2016: An Update From the Ig A Nephropathy Classification Working Group,” Kidney International 91, no. 5 (2017): 1014–1021, 10.1016/j.kint.2017.02.003.28341274 · doi ↗ · pubmed ↗