Prevalence and Risk Factors of Elevated Alanine Aminotransferase (ALT) in 2382 Treatment‐naïve HBV/HDV Co‐Infected Patients
Habiba Kamal, Ganbolor Jargalsaikhan, Sanjaasuren Enkhtaivan, Karin Lindahl, Hannes Hagström, Daniel Bruce, Michael Ingre, Bekhbold Dashtserenx, Oyungerel Lkhagva‐Ochir, Tuvshinjargal Ulziibadrakh, Andreas Bungert, Heiner Wedemeyer, Naranjargal B. Dashdorj, Soo Aleman

TL;DR
This study found that young adults with hepatitis D and B co-infection have higher liver enzyme levels and more severe disease compared to those with only hepatitis B.
Contribution
The study identifies unique risk factors for elevated ALT in young hepatitis D/B co-infected patients compared to hepatitis B alone.
Findings
78.5% of CHD patients had elevated ALT, highest in 18-20 year olds.
Young CHD patients had 8.2x higher odds of elevated ALT compared to matched CHB patients.
ALT elevation in CHD was linked to younger age, elevated GGT, and HDV RNA levels.
Abstract
Chronic hepatitis D (CHD) causes severe chronic hepatitis. Knowledge is limited about factors correlating with ALT in treatment‐naïve patients with CHD. This study analysed the pattern and determinants of ALT elevation in a large cohort of patients with CHD, including young adults, compared to propensity score‐matched (PSM) patients with chronic hepatitis B (CHB). We identified 2382 treatment‐naïve HBsAg+ adults with CHD (HDV RNA positive) and 1553 with CHB attending a liver center in Mongolia during 2015–2023. The correlation between ALT levels, virological, biochemical, and fibrosis parameters was assessed using Spearman coefficient (rho). Logistic regression analysis was used to identify determinants of elevated ALT in 1371 PSM pairs with CHD and CHB matched on age, sex, metabolic factors, and date of initial test. In CHD, 78.5% of patients had ALT elevation, with the highest…
Genes, proteins, chemicals, diseases, species, mutations and cell lines named across the full text — each resolved to its canonical identifier and authoritative record.
Click any figure to enlarge with its caption.
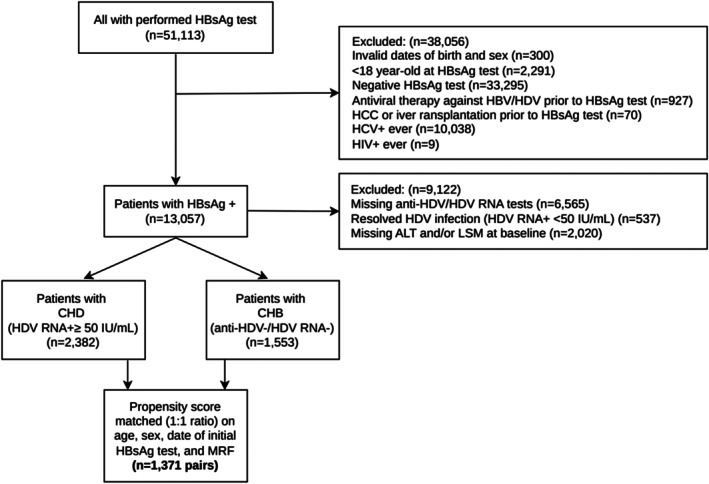 FIGURE 1
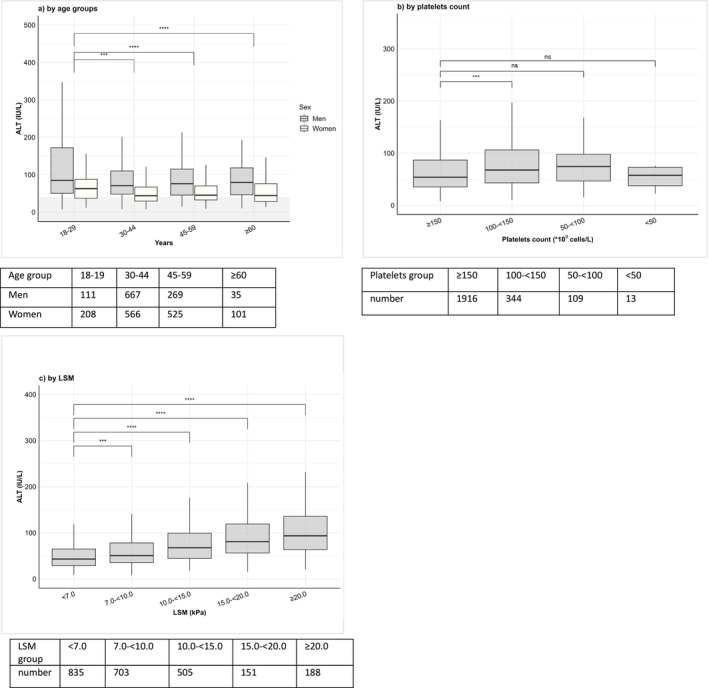 FIGURE 2
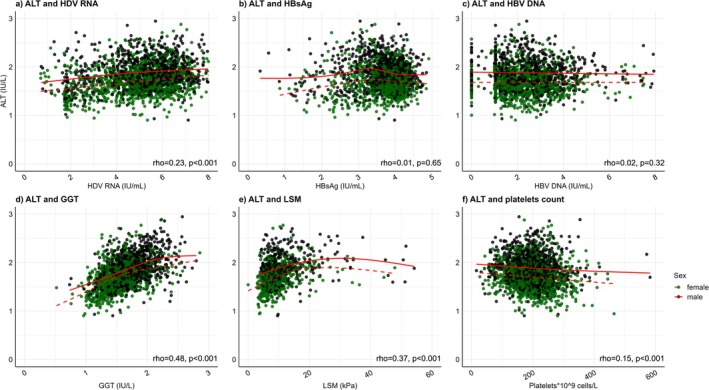 FIGURE 3
| Parameters |
| All | 18–29 | 30–44 | 45–59 | ≥ 60 |
|
|---|---|---|---|---|---|---|---|
| Number | 2382 | 219 (9.2) | 1233 (51.8) | 794 (33.3) | 136 (5.7) | ||
| Age at first HBsAg test, years, median (IQR) | 2382 | 41.2 (34.3, 50.7) | 28.0 (26.6, 29.2) | 36.9 (33.5, 40.6) | 51.6 (48.2, 55.3) | 62.9 (61.1, 66.0) | < 0.001 |
| Sex | 2382 | < 0.001 | |||||
| Female | 1300 (54.6) | 108 (49.3) | 566 (45.9) | 525 (66.1) | 101 (74.3) | ||
| Male | 1082 (45.4) | 111 (50.7) | 667 (54.1) | 269 (33.9) | 35 (25.7) | ||
| BMI, median (IQR) | 938 | 26.4 (23.4, 29.7) | 24.1 (21.3, 28.4) | 26.3 (23.2, 29.8) | 27.2 (24.5, 30.2) | 24.7 (22.4, 28.0) | < 0.001 |
| ALT, IU/L, median (IQR) | 2382 | 56.6 (36.5, 92.0) | 69.4 (44.2, 122.8) | 57.5 (36.9, 92.1) | 52.0 (34.9, 86.2) | 48.6 (30.6, 81.4) | < 0.001 |
|
| 2382 | ||||||
| Normal ALT level, < 1ULN | 511 (21.5) | 34 (15.5) | 273 (22.1) | 168 (21.2) | 36 (26.5) | ||
| ≥ × 1ULN–< 2 × ULN | 983 (41.3) | 71 (32.4) | 523 (42.4) | 342 (43.1) | 47 (34.6) | ||
| ≥ 2 × ULN–< 5 × ULN | 721 (30.3) | 90 (41.1) | 349 (28.3) | 237 (29.8) | 45 (33.1) | ||
| ≥ 5 × ULN–< 10 × ULN | 141 (5.9) | 18 (8.2) | 72 (5.8) | 43 (5.4) | 8 (5.9) | ||
| ≥ 10 × ULN | 26 (1.1) | 6 (2.7) | 16 (1.3) | 4 (0.5) | 0 | ||
| AST, IU/L, median (IQR) | 2375 | 42.1 (30.4, 63.9) | 46.9 (33.8, 74.7) | 40.0 (29.5, 61.5) | 44.3 (31.6, 65.1) | 45.6 (30.0, 68.4) | < 0.001 |
| GGT, IU/L, median (IQR) | 1841 | 39.6 (25.4, 64.8) | 36.2 (21.9, 56.6) | 38.7 (25.1, 63.2) | 42.4 (26.5, 73.3) | 38.0 (27.1, 56.7) | 0.008 |
| Elevated GGT, ≥ 55 IU/L in male, ≥ 38 IU/L in female | 1841 | 774 (42.0) | 55 (35.0) | 377 (38.5) | 297 (49.3) | 45 (43.7) | < 0.001 |
| Albumin, g/L, median (IQR) | 2082 | 42.0 (39.6, 44.2) | 43.3 (40.7, 45.2) | 42.3 (40.1, 44.4) | 41.2 (38.8, 43.5) | 41.4 (38.6, 43.6) | < 0.001 |
| Total bilirubin, μmol/L, median (IQR) | 2219 | 12.9 (9.6, 16.8) | 12.7 (9.0, 15.4) | 13.0 (9.6, 17.2) | 12.9 (9.7, 16.5) | 13.4 (10.5, 17.4) | 0.2 |
| Conjugated bilirubin, μmol/L, median (IQR) | 1486 | 4.6 (3.6, 6.1) | 5.0 (3.5, 6.4) | 4.6 (3.5, 6.1) | 4.6 (3.6, 6.0) | 4.9 (3.8, 6.3) | 0.5 |
| Platelets count, 109 cells/L, median (IQR) | 2382 | 199.0 (159.8, 236.0) | 214.0 (185.5, 251.5) | 204.0 (168.0, 240.2) | 184.0 (148.1, 225.5) | 184.0 (154.9, 231.6) | < 0.001 |
|
| |||||||
| HBeAg, positive | 560 | 232 (41.4) | 37 (51.4) | 132 (42.2) | 55 (36.4) | 8 (33.3) | 0.2 |
|
| |||||||
| qHBsAg log10, median (IQR) | 1930 | 3.8 (3.4, 4.1) | 3.9 (3.5, 4.1) | 3.9 (3.5, 4.1) | 3.8 (3.4, 4.1) | 3.7 (3.2, 4.0) | < 0.001 |
| qHBsAg < 3 log10 | 244 (12.6) | 23 (14.5) | 108 (10.7) | 89 (13.7) | 24 (22.0) | 0.004 | |
| qHBsAg 3– < 4 log10 | 1006 (52.1) | 76 (47.8) | 520 (51.5) | 356 (54.6) | 54 (49.5) | ||
| qHBsAg ≥ 4 log10 | 680 (35.2) | 60 (37.7) | 382 (37.8) | 207 (31.7) | 31 (28.4) | ||
|
| |||||||
| qHDV RNA log10, median (IQR) | 2382 | 5.3 (4.3, 6.1) | 5.5 (4.3, 6.6) | 5.3 (4.2, 6.2) | 5.3 (4.3, 6.0) | 5.3 (4.3, 6.1) | 0.2 |
| qHDV RNA < 3 log10 | 292 (12.3) | 34 (15.5) | 161 (13.1) | 78 (9.8) | 19 (14.0) | 0.10 | |
| qHDV RNA 3– < 5 log10 | 683 (28.7) | 53 (24.2) | 345 (28.0) | 249 (31.4) | 36 (26.5) | ||
| qHDV RNA ≥ 5 log10 | 1407 (59.1) | 132 (60.3) | 727 (59.0) | 467 (58.8) | 81 (59.6) | ||
| qHBV DNA log10, median (IQR) | 1732 | 2.4 (1.5, 3.2) | 2.1 (1.5, 3.2) | 2.2 (1.4, 3.2) | 2.4 (1.6, 3.2) | 3.0 (2.4, 3.5) | < 0.001 |
| LSM, median (IQR) | 2382 | 8.3 (6.1, 11.7) | 7.6 (5.8, 10.4) | 7.9 (6.1, 11.0) | 8.8 (6.7, 12.7) | 8.9 (6.8, 13.5) | < 0.001 |
| LSM < 7.5 kPa | 2382 | 987 (41.4) | 104 (47.5) | 561 (45.5) | 275 (34.6) | 47 (34.6) | < 0.001 |
| LSM ≥ 10.0 kPa | 2382 | 835 (35.1) | 65 (29.7) | 390 (31.6) | 320 (40.3) | 60 (44.1) | < 0.001 |
| MRF | 2382 | 845 (35.5) | 55 (25.1) | 414 (33.6) | 336 (42.3) | 40 (29.4) | < 0.001 |
| Cirrhosis | 2382 | 612 (25.7) | 36 (16.4) | 269 (21.8) | 261 (32.9) | 46 (33.8) | < 0.001 |
| Predictor | Factor | Univariable | Multivariable | ||||||
|---|---|---|---|---|---|---|---|---|---|
| OR | LCI | UCI |
| aOR | LCI | UCI |
| ||
| Age at initial test | Continuous | 0.99 | 0.98 | 1.00 | 0.12 | ||||
| Age < 30 years of age | Yes, vs. no | 1.54 | 1.07 | 2.29 | 0.03 | 2.16 | 1.26 | 3.92 | < 0.001 |
| Sex (male) | Yes, vs. no | 1.51 | 1.23 | 1.84 | < 0.001 | 1.22 | 0.94 | 1.60 | 0.38 |
| BMI, kg/m2 | Continuous | 1.08 | 1.04 | 1.12 | < 0.001 | ||||
| Platelet count, ×109 cells/L | Continuous | 1.00 | 0.99 | 1.00 | < 0.001 | ||||
| Platelet count, < 150 × 109 cells/L | Yes, vs. no | 1.87 | 1.42 | 2.50 | < 0.001 | 1.34 | 0.91 | 2.02 | 0.15 |
| AST, IU/L | Continuous | 1.20 | 1.18 | 1.22 | < 0.001 | ||||
| GGT, IU/L | Continuous | 1.02 | 1.02 | 1.03 | < 0.001 | ||||
| Elevated GGT>ULN, IU/L | Yes, vs. no | 4.96 | 3.73 | 6.70 | < 0.001 | 4.64 | 3.35 | 6.54 | < 0.001 |
| HBeAg positive | Yes, vs. no | 1.32 | 0.85 | 2.08 | 0.22 | ||||
| qHBsAg log10, IU/mL | Continuous | 1.62 | 1.40 | 1.88 | < 0.001 | 1.04 | 0.78 | 1.40 | 0.76 |
| qHBV DNA log10, IU/mL | Continuous | 1.02 | 0.93 | 1.11 | 0.68 | ||||
| qHDV RNA log10, IU/mL | Continuous | 1.45 | 1.36 | 1.55 | < 0.001 | 1.48 | 1.36 | 1.62 | < 0.001 |
| LSM, kPa | Continuous | 1.10 | 1.08 | 1.13 | < 0.001 | ||||
| Cirrhosis | Yes, vs. no | 2.22 | 1.72 | 2.90 | < 0.001 | 1.70 | 0.87 | 3.70 | 0.14 |
| Diabetes | Yes, vs. no | 1.70 | 0.90 | 3.53 | 0.13 | ||||
| MRF | Yes, vs. no | 1.16 | 0.94 | 1.43 | 0.17 | ||||
- —ALF, Region Stockholm, Karolinksa Institutet
Peer Reviews
No public reviews on file for this paper yet. If you reviewed it on a platform where reviews are public (OpenReview, ICLR, NeurIPS, ICML), you can paste yours below so the community can read it here.
Videos
No videos yet. Explain this paper in a talk, walkthrough, or lecture? Add one.
Taxonomy
TopicsHepatitis B Virus Studies · Liver Disease Diagnosis and Treatment · Hepatitis C virus research
Introduction
1
Chronic hepatitis D (CHD) is associated with an aggressive liver disease course [1]. HBV/HDV co‐infection affects nearly 9 to 19 million individuals worldwide [2]. The prevalence is highest in Mongolia, Southern Asian countries such as Pakistan as well as the Amazon basin and West Africa, while generally low (< 0.2%) in Western countries, where the majority of patients consist of migrants from endemic regions [2, 3]. CHD is classified as a rare disease in the European Union, with orphan designation when developing new HDV drugs [4]. At diagnosis, 30%–50% of patients with CHD present with advanced liver fibrosis, at a mean age of 40 years [5, 6].
Elevated alanine aminotransferase (ALT) level reflects hepatic necro‐inflammatory process, and correlates with liver‐related outcomes such as cirrhosis and hepatocellular carcinoma (HCC) [7]. Nevertheless, ALT normalisation is an accepted surrogate marker for treatment response and improved clinical outcomes in HDV drug trials [8, 9]. Knowledge about ALT levels is therefore crucial to understand the pathological process and to guide the management of CHD, particularly in the light of new anti‐HDV agents in development.
While ALT elevation is frequent in CHD, data on its prevalence, severity, and association with patients' characteristics and other factors across the natural course of untreated CHD remain scarce [6, 10, 11]. Particularly, data on young adults with CHD compared to chronic hepatitis B monoinfection (CHB) are absent. Studies on CHD have been constrained by small sample size, inclusion of both treatment‐naïve and experienced patients, usually from tertiary care settings, possibly reducing statistical power and selection bias of more advanced CHD [6, 10, 11].
To address this knowledge gap, we analysed the prevalence and factors correlating with ALT elevation in CHD patients, particularly young adults, and compared them to propensity score‐matched (PSM) CHB patients. This analysis was enabled using a large cohort of treatment‐naïve patients with CHD and CHB from a liver center in Mongolia, a country with a substantial burden of viral hepatitis [12, 13].
Patients and Methods
2
Study Population
2.1
We identified 51 113 adult individuals (≥ 18 years) with HBsAg testing at the Liver Center, Ulaanbaatar in Mongolia, between from 1st January 2015 to 31st December 2023 (Figure 1). Data were retrieved from an electronic database, comprising medical and investigations records. The Liver Center provides outpatient care for patients with liver diseases, and also screens individuals for viral hepatitis upon self‐referral. After exclusions (n = 38 056), patients with HBsAg positive without prior record of anti‐HBV or anti‐HDV therapies were categorised on their virological parameters and available alanine aminotransferase (ALT) and liver stiffness measurement (LSM) into two cohorts: (1) HBV/HDV co‐infection or CHD, if at least one serum HDV RNA level ≥ 50 IU/mL (n = 2382), and (2) mono‐HBV infection or CHB, with at least one negative anti‐HDV and/or HDV RNA test, and no record of anti‐HDV or HDV RNA positivity (n = 1553).
Study flowchart. All laboratory and virological parameters within (< 90 days) from baseline. ALT, alanine aminotransferase; CHB, chronic hepatitis B; CHD, chronic hepatitis D; HCC, hepatocellular carcinoma; HCV, hepatitis C virus; HIV, human immunodeficiency virus; LSM, liver stiffness measurement by transient elastography.
The term HBV/HDV co‐infection used in this study interchangeably with CHD, and do not refer to the type of infection as simultaneous or superinfection.
All data were anonymized and transferred to Karolinska University Hospital and Karolinska Institutet, Sweden for analysis. Ethical approval was granted by the local ethics review board at the Liver center in Mongolia and by the Ethical Review Authority of Sweden. The study was funded by an ALF grant from Region Stockholm, Sweden.
Demographic, Biochemical Test and Fibrosis Staging
2.2
The baseline date was the first positive HBsAg test date. Demographic data, including date of birth and sex, and medical data such as body mass index (BMI), antiviral treatments and liver‐related diagnoses as liver cirrhosis, hepatocellular carcinoma, decompensation events (ascites, variceal bleeding, or encephalopathy) and liver transplantation during the study period of 1st January 2015 to 31st December 2023 were retrieved.
Body mass index (BMI) was calculated as weight in kilogram divided by height in meters squared (kg/m^2^). The following cut‐offs were used for BMI categories in accordance with Asian population standards: underweight (< 18.5 kg/m^2^), normal weight (18.5–22.9 kg/m^2^), overweight (23.0–27.4 kg/m^2^) and obesity (≥ 27.5 kg/m^2^) [14].
The upper limit of normal (ULN) for biochemical tests, as per local laboratory routines, was defined as follows: ALT of 41 IU/L for men and 31 IU/L for women, AST of 35 IU/L for men and 31 IU/L for women, GGT of 55 IU/L for men and 38 IU/L for women, serum triglyceride of 1.7 mmol/L, and serum low‐density lipoproteins of 2.6 mmol/L. The lower limit of normal (LLN) for serum high density lipoproteins was 1.0 mmol/L for men and 1.3 mmol/L for women.
Metabolic risk factors were defined as the presence of at least one of the following conditions: overweight or obesity, diabetes mellitus (either a documented diagnosis or fasting serum glucose ≥ 7.0 mmol/L on two occasions), dyslipidemia, hypertension, and/or diagnosis of fatty liver disease [15]. Events of HCC, decompensation events (defined as ascites, variceal bleeding, or encephalopathy), or liver transplantation were retrieved from medical records, as well as from ultrasound or gastroscopy investigation records where appropriate.
For CHD, the LSM cut‐offs used to define advanced/F3 fibrosis was ≥ 10.0–< 15.0 kPa, while ≥ 15.0 kPa for F4 fibrosis [16]. The corresponding LSM cut‐off levels for CHB were ≥ 9.0–< 12.5 kPa for F3 and ≥ 12.5 kPa for F4 fibrosis [17]. LSM values with a success rate of ≥ 90% and the interquartile range (IQR) of ≤ 30% were considered reliable and used [17]. Since LSM levels may be affected by elevated transaminases due to liver necroinflammation [18], analyses using platelets count as an alternative marker for advanced fibrosis/cirrhosis were performed. For cirrhosis diagnosis, criteria of either a LSM value of ≥ 15.0 for CHD or ≥ 12.5 kPa for CHB, or platelet counts of < 150 × 10^9^ cells/L were utilized [19].
Serological and Virological Tests
2.3
HBsAg was tested with either rapid diagnostic test (CTK Co.LtD., USA), or quantitative HBsAg test (Sysmex Co.Ltd., Japan) at baseline. Anti‐HCV and anti‐HIV were qualitatively tested by rapid diagnostic test (CTK Co.LtD., USA). Quantitative HBsAg was estimated by HISCL‐5000 fully automated chemiluminescence analyser (Sysmex Co.Ltd., Japan) and for HBeAg status (CLIA, Sysmex, Japan, lower level of detection (LOD) of 1 COI). HCV RNA was quantified using real time reverse transcriptase polymerase chain reaction with LOD of 10 IU/mL (GeneXpert, Cepheid, USA). Anti‐HDV was analysed using the Wantai HDV‐IgG ELISA (Wantai Biopharmaceutical Co. Ltd., China), with a lower limit of detection (LoD) of < 1 COI. HDV RNA levels were quantified, using a Bioactiva Diagnostica extraction kit (Bioactiva Diagnostica, Germany) and a Bio‐Rad amplification kit (Bio‐Rad Laboratories, USA) with a lower limit of quantification (LoQ) of < 10 IU/mL. HBV DNA levels were analysed using the GeneXpert system (Cepheid, USA), with an LoQ of < 10 IU/mL.
Statistical Analysis
2.4
Continuous variables were compared using Student‐t or the Mann–Whitney U tests, while categorical variables were compared using the Chi‐Square test or Fisher's exact test. For correlation analyses, parameters within ±21 nearest to baseline (HBsAg test) with no prior HCC diagnosis, initiation of antiviral treatment, or liver transplantation were considered, while for baseline analyses, variables were used within 90 days of baseline. Correlations between paired parameters were assessed using Spearman's correlation coefficient (rho). Coefficient values were interpreted as follows: very strong (0.80–1.00), strong (0.60 to < 0.80), moderate (0.40 to < 0.60), weak (0.20 to < 0.40), and very weak (> 0.0 to < 0.20) [20]. Scatter plots with overlay smooth lines were used to visualise univariable correlations, representing trends in data. Univariable and multivariable logistic regression analyses were conducted to identify parameters significantly associated with ALT elevation (> ULN) defined as above [16]. Results were presented as odds ratio (OR) and 95% confidence intervals (CI). Propensity scores matching (PSM) were constructed using logistic regression model with CHD as the outcome, and variables age, sex, MRF and date of HBsAg test as covariates. The model estimated the probability of being CHD per each patient, and the propensity scores were used in 1:1 nearest neighbour matching for age and date of HBsAg and exact matching for sex and MRF to balance the groups. After matching, the standardised mean differences (SMD) between CHB and CHD were assessed. All analyses were similarly conducted on the matched pairs.
Statistical significance was considered when p‐values < 0.05. Data analyses were executed using R Studio version 3 and IBM SPSS Statistics, version 28.0.1.1.
Results
3
Baseline Characteristics of Patients With CHD by Age Groups
3.1
As shown in Table 1, patients aged 18–29 years‐old constituted 9.2% of the cohort, men were less prevalent in older age groups compared to women (50.7% in 18–29 years vs. 25.7% in ≥ 60 years, p < 0.001). Group of 18–29 years had the highest median ALT 69.4 (44.2–122.8) IU/L, with 15.5% having normal level (p < 0.001), also shown in Figure 2a. To the contrast, GGT level increased with age with elevated levels at 35.0% among 18–29 years reaching 43.7% in older age groups (p < 0.001). Young age group also had the highest prevalence of HBeAg+ at 51.4%, higher HBsAg level at 3.9 log_10_ IU/mL and lower median HBV DNA level at 2.1 log_10_ IU/mL compared to older age groups (p < 0.001). Of note, HDV RNA level was similar across all age groups (p = 0.2) (Table 1 and Figure 2).
Box plot illustrating ALT levels, subgrouped by (a) age in men and women, (b) platelet counts, and (c) by LSM measurements in treatment‐naïve patients with chronic hepatitis D. ALT levels on the y‐axis, and age categories, liver stiffness, and platelet count subgroups are shown on the x‐axis. Median ALT values are represented by interior bars, with upper and lower borders representing the 25th and 75th quartiles, with whiskers of minimum and maximum values. The shaded area marks the upper limit of normal ALT for men (< 41 IU/L) and women (< 31 IU/L), respectively. Significance was evaluated by the t‐test. The earliest laboratory values within 90 days of first HBsAg, anti‐HDV and HDV RNA positive tests without exposure to anti‐HDV or anti‐HBV therapies were considered. ALT, alanine aminotransferase; LSM, liver stiffness measurement.
Factors Associated With Elevated ALT Levels in CHD
3.2
As shown in Table 2, younger age < 30 year‐old, male sex, higher BMI, lower platelets count, AST, GGT, HBsAg, HDV RNA, and record of cirrhosis were all significantly associated with elevated ALT in CHD in univariable analysis. In multivariable analysis, age < 30 year‐old carrying aOR = 2.16 (1.26–3.92), elevated GGT level; aOR = 4.64 (3.35–6.54), and HDV RNA log_10_ IU/mL; aOR = 1.48 (1.36–1.62) remained significant after adjusting for age, sex, HBsAg, HDV RNA, and cirrhosis.
Baseline Differences Between Patients With CHD and CHB in All Cohort and in PSM Matched
3.3
Compared to CHB, patients with CHD were older (mean age 41.2 vs. 34.3 years old, p < 0.001), with more prevalent women (54.6% vs. 45.6%, p < 0.001) (Table S1).
In CHD, median ALT value was 56.6 (36.5–92.0) IU/L with normal level in 21.5% vs. 62.3% in CHB (p < 0.001). CHD showed higher AST, GGT, bilirubin, and lower albumin, and platelets count (all p < 0.05). They showed also higher HBsAg and lower HBV DNA levels, more prevalent MRF (35.5% vs. 32.3%) and more cirrhosis record (25.7% vs. 7.9%, p < 0.001).
We performed a propensity‐score matching (on age, sex, MRF and date for HBsAg test) which yielded 1371 matched pairs of CHD and CHB. The SMD for propensity score (distance) was 0.29, for sex was 0.0001, for age 0.03, for date of HBsAg was −0.67, and for MRF was 0.001. All SMDs were < 0.1 except for date of HBsAg test, indicating good balance across the matched covariates (results not tabulated). Similar to main cohorts, PSM matched patients with CHD showed higher ALT, AST, GGT, bilirubin, LSM, and higher prevalence of cirrhosis as shown in (Table S1).
To delineate the effect of CHD vs. CHB across age groups, the association of CHD with baseline parameters is presented in (Table S2). Adjusting for age, sex, ALT, HBeAg, HBV DNA, HBsAg, MRF, and cirrhosis; age group 18–29 years with CHD demonstrated 6.53‐aOR (95% CI 1.84–28.40) of elevated ALT, 11.0‐aOR (95% CI 1.79–219.0) of HBeAg+, 22.3‐aOR (95% CI 3.56–451.20) of low HBV DNA and similar high HBsAg levels and cirrhosis risks compared to the same age group with CHB. Patients with CHD had overall higher odds of HBeAg+ compared to CHB with aOR of 3.57 (95% CI 2.10–6.27), also shown in age subgroups. Patients with CHD showed higher odds of HBV DNA < 2000 IU/mL, more pronounced in the younger age group; aOR = 22.30, and in those aged ≥ 60 years aOR = 4.36.
Pair‐Wise Correlations of ALT With Biochemical and Virological Parameters in CHD
3.4
ALT levels were higher in platelets count 50–< 100, 100–< 150, and declined in those with < 50, while correlated positively with LSM subgroups (Figure 2b,c).
As shown in (Figure 3), ALT weakly correlated with HDV RNA (rho = 0.23, p < 0.001) and LSM (rho = 0.37, p < 0.001), correlated moderately with GGT (rho = 0.48, p < 0.001), and showed a negative weak correlation with platelets count (rho = −0.15, p < 0.001). ALT did not correlate with HBV DNA (rho = 0.02, p = 0.32). Overall, similar correlations were noted in men and women.
Scatter plots illustrating the association between ALT levels with other parameters in patients with CHD, subgrouped by sex. A flexible regression line (red) illustrates the direction of the association in each group. Spearman correlation coefficients (rho) with p‐values are shown for the whole group. Spearman correlation coefficient, rho, p‐value. The flexible regression line (red) illustrates the direction of the association. ALT, alanine aminotransferase; Black dots, red line, men, green dots, dashed red line; GGT, gamma glutamyl transferase; HBsAg, hepatitis B surface antigen; HBV DNA, hepatitis B virus deoxyribonucleic acid; HDV RNA, hepatitis D virus ribonucleic acid; LSM, liver stiffness measurement.
HBsAg showed a very weak positive correlation with HBV DNA levels (rho = 0.07, p = 0.004). HBV DNA and HBsAg levels showed negligible or no correlation with platelet counts and LSM levels. Similar correlations were demonstrated when subgrouping by cirrhosis. (Figure S1).
Discussion
4
In this cohort study of treatment‐naïve Asian patients with CHD, compared to CHB, we identified following key findings: (1) Younger CHD patients, aged 18–< 30 years, exhibited significantly higher levels of ALT, AST and GGT and more frequent advanced fibrosis than age‐matched CHB patients; (2) Patients with CHD had higher probability of HBeAg+ than propensity‐scored matched CHB. (3) Age < 30 years, elevated GGT and higher HDV RNA levels were significant determinants of elevated ALT in CHD. The present analysis is the largest study to date, examining the prevalence and patterns of ALT elevation in CHD, compared to a matched CHB cohort, offering new insights into the distinct features of HDV infection, with potential implications for HDV care.
Consistent with prior studies, patients with CHD showed higher transaminases and advanced fibrosis compared to CHB, alongside a higher prevalence of HBeAg positivity [6, 21, 22]. Our novel finding of a more frequent and pronounced ALT elevation in young adults with CHD suggests a more active or prolonged phase of immune response targeting infected hepatocytes than previously known compared to HBV‐monoinfection [23]. Earlier studies lacked sufficient young adult data and were not powered for age‐specific analyses [6, 21, 22]. The higher ALT in young adults with CHD may reflect ALT flares related to host immune‐mediated response when transitioning to adulthood; such flares have been described in CHB being more frequent in young adults compared to children or older adults [24]. Later HDV superinfection during adolescence or early adulthood in a high‐endemic region could not be ruled out and agree with our findings of more HBeAg+ in older age groups. The latter hypothesis is consistent with Mongol data estimating HDV prevalence among school children with HBsAg+ at 13.6%, while reaching 60%–80% in adults with HBsAg+, implying that later HDV superinfection is more predominant [25, 26]. Studies suggested a higher HDV infection prevalence among men in rural and eastern Mongol territories, associated significantly with dental procedures and parenteral injections [27].
Unlike CHD with poorly characterised phases in its natural course, the phases of CHB have been defined as follows: HBeAg‐positive chronic HBV infection (immune tolerant phase), HBeAg‐positive chronic hepatitis (immune active phase), HBeAg‐negative chronic HBV infection (inactive carrier phase), HBeAg‐negative chronic hepatitis (immune escape phase), and HBsAg‐negative phase (resolved HBV infection phase) [28]. Individuals acquiring mono‐HBV in adolescence or adulthood often bypass or shorten the “HBeAg+ chronic infection” phase, which typically extends for decades in perinatal or early childhood infected patients [29]. This transition into chronic hepatitis, with a shortened/or without an immune‐tolerant phase, suggests a more accelerated disease course, particularly among older‐age HDV infections [30]. Delayed HBeAg seroconversion, typically occurring at age 30–35 years in HBV‐monoinfection, is associated with increased risk of cirrhosis [31]. In the present analysis, CHD patients aged 30–44 and 40–55 years had 2.0‐ respectively 2.5‐fold higher odds of HBeAg positivity compared to matched CHB peers, indicating delayed seroconversion [32]. Nevertheless, this prevalence of HBeAg+ in middle and older age individuals with CHD in our analysis is higher compared to western cohorts with ~15% HBeAg+ at diagnosis [6, 10]. However, extrapolating HBV phases in CHD remains challenging, with most patients fitting into HBeAg negative chronic hepatitis characterised by HBeAg‐, elevated ALT but suppressed HBV DNA levels.
Persistent HDV RNA replication and elevated ALT levels are associated with accelerated risk of cirrhosis and promote carcinogenesis by processes of necroinflammation, fibrosis accumulating oxidative stress, and DNA damage [33]. ALT levels declined in the late stages of advanced fibrosis and cirrhosis, consistent with previous studies, with a negative correlation between ALT and platelets count [33, 34]. However, normal ALT does not exclude ongoing low‐grade hepatic inflammation, also seen in CHB, warranting cautious interpretation of normal ALT levels in CHD [35, 36]. Our findings align with recent EASL and WHO guidelines in considering patients with detectable HDV RNA eligible for therapy regardless of age and disease phase, considering the severe necro‐inflammation and fibrosis early in life to prevent later severe liver complications [37, 38]. Similarly, a recent simulated cost‐effectiveness analysis concluded that early treatment (F0 fibrosis of CHD) significantly reduced liver‐related complications, including HCC, and was cost‐effective [39]. Currently, the access of the recently approved anti‐HDV drug bulevirtide is restricted to advanced fibrosis/cirrhosis in some countries with available therapy despite the recommendations [40]. Our findings might motivate amending these recommendations given the accelerated course of CHD; long‐term analyses to confirm our findings are warranted.
ALT normalisation, a surrogate for improved clinical outcomes in CHD under treatment, occurs in 30%–40% with peg‐IFN monotherapy [41], and in 50%–60% with recently introduced bulevirtide monotherapy [42]. In the phase 3 clinical trial of bulevirtide, a discrepancy in the biochemical response of ALT (normalisation of ALT from elevated level at baseline) and the virological response of HDV RNA (≥ 2 log decrease from baseline) was observed during treatment in some patients, with the underlying reason remaining unknown [42]. Patients showing HDV RNA decline but failing to reach ALT normalisation are deemed partial responders. Other confounding factors such as comorbidities of MRF (35% in the current cohort) should be considered when assessing ALT responses [38]. In that context, GGT might be a useful marker of liver disease progression as it correlated with ALT (rho = 0.48, p < 0.001), and with cirrhosis agreeing with prior studies, showing the strongest correlation with ALT in the present analysis [43].
We acknowledge several limitations in the present study. The cross‐section design with significant correlations cannot establish causal relationships. Exclusion of patients with anti‐HBV therapies might have enriched the CHB cohort with those with milder disease, despite PSM and similar eligibility criteria applied to both cohorts. Persistent ALT elevation is a stronger determinant of necro‐inflammation and disease progression rather than a single assessment timepoint [44]. Nevertheless, we could note a similar pattern of ALT elevations as baseline when assessed at extended time points. The mode and age at infection were not directly ascertainable; however, HBV in endemic regions is typically acquired perinatally or during early childhood, while a subgroup of HDV superinfection likely occurs later.
Other granular data on HDV or HBV genotype, socioeconomic, alcohol consumption, health behaviours, therapies except for anti‐HBV/HDV therapies were not assessed. Previous studies have though indicated that HDV genotype 1 and HBV genotype D predominate in Mongolia [12]. Hence, our data may not be generalizable to other genotypes. The use of liver stiffness and platelets might misclassify cirrhosis; however, we used recently biopsy‐proven proposed cut‐offs to classify the fibrosis stages [16]. The study setting, reflective of real‐world practice in resource‐limited regions, caused missing data and introduced potential selection bias towards patients with more symptomatic disease and those who can afford tests. Our data include a population of only Asian ethnicity from one country, but the large and rather homogenous cohort in our study could help in understanding ALT elevation and associations in CHD, with statistical power and the possibility to adjust for confounders.
In conclusion, significant liver inflammation, as indicated by elevated ALT levels, higher HBeAg+ distinguishes CHD from CHB in a large cohort of treatment‐naïve patients from Mongolia. Young adults with CHD exhibit a higher inflammatory process, calling for early administration of and more access to anti‐HDV agents. Further studies are needed to examine the long‐term liver‐related outcome in this population and the implication of early treatment on prognosis.
Author Contributions
All authors contributed to the study conception and design. Material preparation, data collection G.J., S.E., H.K. and analysis were performed by H.K. and D.B. The first draft of the manuscript was written by H.K. and S.A. and all authors commented on previous versions of the manuscript. All authors read and approved the final manuscript.
Funding
This work was supported by ALF, Region Stockholm, Karolinksa Institutet.
Ethics Statement
Institutional ethical boards have approved the study; informed consent was waived as the study involves anonymized registers.
Conflicts of Interest
The authors declare no conflicts of interest.
Supporting information
Data S1: liv70559‐sup‐0001‐Figures.docx.
Data S2: liv70559‐sup‐0002‐Tables.docx.
The reference list from the paper itself. Each links out to its DOI / PubMed record.
- 1R. G. Gish , R. J. Wong , G. L. Di Tanna , et al., “Association of Hepatitis Delta Virus With Liver Morbidity and Mortality: A Systematic Literature Review and Meta‐Analysis,” Hepatology 79 (2024): 1129–1140.37870278 10.1097/HEP.0000000000000642 PMC 11019996 · doi ↗ · pubmed ↗
- 2A. J. Stockdale , B. Kreuels , M. Y. R. Henrion , et al., “The Global Prevalence of Hepatitis D Virus Infection: Systematic Review and Meta‐Analysis,” Journal of Hepatology 73 (2020): 523–532.32335166 10.1016/j.jhep.2020.04.008PMC 7438974 · doi ↗ · pubmed ↗
- 3A. S. Duberg , C. Lybeck , A. Fält , S. Montgomery , and S. Aleman , “Chronic Hepatitis B Virus Infection and the Risk of Hepatocellular Carcinoma by Age and Country of Origin in People Living in Sweden: A National Register Study,” Hepatology Communications 6 (2022): 2418–2430, 10.1002/HEP 4.1974.35503810 PMC 9426385 · doi ↗ · pubmed ↗
- 4“EU/3/24/3012—Orphan Designation for Treatment of Hepatitis Delta Virus Infection”.
- 5H. Kamal , G. Westman , K. Falconer , et al., “Long‐Term Study of Hepatitis D Infection at Secondary Care Centers: The Impact of Viremia on Liver‐Related Outcomes,” Hepatology 72 (2020): 1177–1190, 10.1002/hep.31214.32145073 · doi ↗ · pubmed ↗
- 6A. Wranke , B. Heidrich , K. Deterding , et al., “Clinical Long‐Term Outcome of Hepatitis D Compared to Hepatitis B Monoinfection,” Hepatology International 17 (2023): 1359.37789170 10.1007/s 12072-023-10575-0PMC 10661878 · doi ↗ · pubmed ↗
- 7P. Farci , T. Roskams , L. Chessa , et al., “Long‐Term Benefit of Interferon α Therapy of Chronic Hepatitis D: Regression of Advanced Hepatic Fibrosis,” Gastroenterology 126 (2004): 1740–1749.15188169 10.1053/j.gastro.2004.03.017 · doi ↗ · pubmed ↗
- 8H. Wedemeyer , S. Aleman , M. R. Brunetto , et al., “A Phase 3, Randomized Trial of Bulevirtide in Chronic Hepatitis D,” New England Journal of Medicine 389 (2023): 22–32.37345876 10.1056/NEJ Moa 2213429 · doi ↗ · pubmed ↗