The Effect of Hemolysis on Biochemical Tests: Determining Interference Cutoffs and Managing Hemolytic Samples
Babak Shirazi Yeganeh, Neda Soleimani, Saeedeh Zare, Sahand Mohammadzadeh, Farzaneh Amiri, Mohammad Javad Esmaeili, Davoud Soleimani, Soodabeh Khoshnyat

TL;DR
This study examines how hemolysis affects biochemical test results and determines a cutoff for safely reporting hemolyzed samples.
Contribution
The paper establishes a hemolytic index (HIX) cutoff of 0.5 for safe reporting in mildly hemolyzed samples.
Findings
LDH, uric acid, AST, and total bilirubin were most affected by hemolysis.
In mild hemolysis (HIX < 0.5), analyte biases did not exceed TEa limits.
Moderate and severe hemolysis caused most analytes to exceed acceptable error limits.
Abstract
Hemolysis is a common source of interference in biochemical tests, potentially leading to significant errors in clinical decision‐making and patient management. This study aimed to evaluate the impact of varying degrees of hemolysis on routine biochemical analytes and to find a local hemolytic index (HIX) cutoff for safe reporting. This experimental study was conducted on 30 serum samples from healthy individuals with normal biochemical profiles. Baseline concentrations of 20 routine analytes were measured using a DIRUI CS‐1200 analyzer. To simulate hemolysis, increasing concentrations of autologous hemolysate were added to each sample, creating three grades of hemolysis based on HIX (mild, moderate, and severe). All analytes were remeasured, and the absolute and relative biases were calculated against baseline levels. These biases were then compared with the CLIA‐defined total…
Genes, proteins, chemicals, diseases, species, mutations and cell lines named across the full text — each resolved to its canonical identifier and authoritative record.
Click any figure to enlarge with its caption.
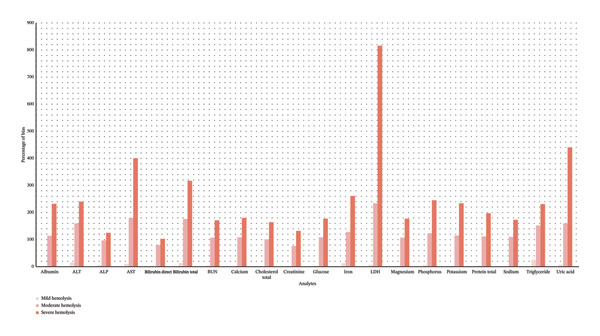 FIGURE 1
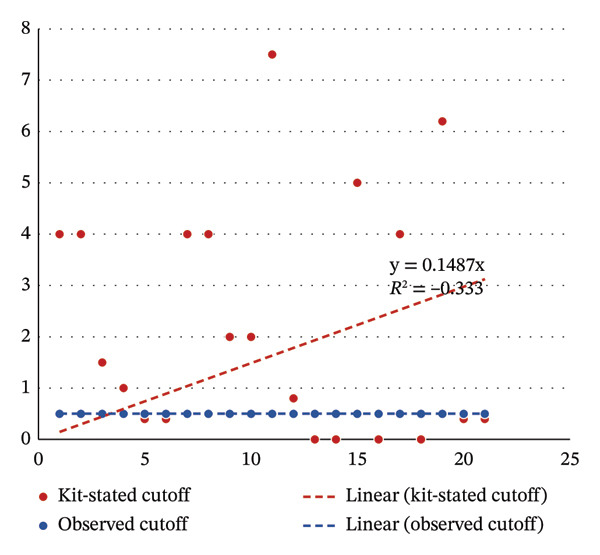 FIGURE 2
| Analyte | Reagent | Method | Wavelength (nm) | Kit‐stated cutoff for free hemoglobin (g/L) | CLIA allowable total error |
|---|---|---|---|---|---|
| Albumin | Biorex | BCG | 546 | 4.0 | 10% |
| ALT | Biorex | UV.IFCC | 340 | 4.0 | 20% |
| ALP | Biorex | DGKC | 405 | 1.5 | 30% |
| AST | Biorex | UV.IFCC | 340 | 1.0 | 20% |
| Bilirubin total | Biorex | Photometric 2,4‐dichloroanyline | 546 | 0.4 | 20% |
| Bilirubin direct | Biorex | Photometric 2,4‐dichloroanyline | 546 | 0.4 | 20% |
| BUN | Biorex | Urease | 340 | 4.0 | 9% |
| Calcium | Biorex | CPC | 620 | 4.0 | 1 mg/dL |
| Cholesterol total | Biorex | Enzymatic | 505 | 2.0 | 10% |
| Creatinine | Biorex | Jaffe | 500 | 2.0 | 15% |
| Glucose | Biorex | GOD‐PAP | 500 | 7.5 | 10% |
| Iron | Biorex | Photometric, Ferene | 600 | 0.8 | 20% |
| LDH | Biorex | Enzymatic | 340 |
| 20% |
| Magnesium | Biorex | Colorimetric | 546 |
| 25% |
| Phosphorus | Biorex | Phosphomolybdate | 340 | 5.0 | 10% |
| Potassium | — | ISE | — | NA | 0.5 meq/L |
| Protein total | Biorex | Biuret | 546 | 4.0 | 10% |
| Sodium | — | ISE | — | NA | 4 meq/L |
| Triglyceride | Biorex | Enzymatic | 505 | 6.2 | 25% |
| Uric acid | Biorex | Enzymatic | 555 | 0.4 | 17% |
| Analyte (unit) | Mean ± SD | |||
|---|---|---|---|---|
| Baseline | Mild hemolysis | Moderate hemolysis | Severe hemolysis | |
| HIX (g/L) | 0.11 ± 0.12 | 0.69 ± 0.24 | 1.6 ± 0.54 | 3.4 ± 1.10 |
| Albumin (gr/dL) | 4.7 ± 0.3 | 4.9 ± 0.3 | 10.1 ± 0.6 | 15.7 ± 1.3 |
| AST (IU/L) | 24 ± 7 | 26 ± 7 | 63 ± 14 | 131 ± 30 |
| ALT (IU/L) | 24 ± 9 | 25 ± 9 | 54 ± 20 | 74 ± 26 |
| ALP (IU/L) | 180 ± 39 | 184 ± 40 | 349 ± 76 | 391 ± 110 |
| BUN (mg/dL) | 12 ± 2 | 13 ± 3 | 24 ± 5 | 31 ± 7 |
| Bilirubin direct (mg/dL) | 0.26 ± 0.11 | 0.27 ± 12 | 0.52 ± 0.25 | 0.58 ± 0.19 |
| Bilirubin total (mg/dL) | 0.63 ± 0.23 | 0.71 ± 0.27 | 1.57 ± 0.54 | 2.46 ± 0.63 |
| Calcium (mg/dL) | 10.4 ± 0.3 | 10.7 ± 0.5 | 21.7 ± 0.9 | 29.2 ± 1.9 |
| Cholesterol total (mg/dL) | 185 ± 33 | 190 ± 35 | 376 ± 70 | 489 ± 93 |
| Creatinine (mg/dL) | 0.80 ± 0.11 | 0.83 ± 1.46 | 1.43 ± 0.29 | 1.87 ± 0.35 |
| Glucose (mg/dL) | 97 ± 8 | 101 ± 10 | 203 ± 17 | 272 ± 23 |
| Iron (μg/dL) | 89 ± 29 | 91 ± 28 | 189 ± 64 | 288 ± 85 |
| LDH (IU/L) | 295 ± 38 | 314 ± 62 | 954 ± 131 | 2389 ± 402 |
| Magnesium (mg/dL) | 2.0 ± 0.2 | 2.1 ± 0.2 | 4.2 ± 0.3 | 5.6 ± 0.9 |
| Phosphorus (mg/dL) | 3.4 ± 0.5 | 3.6 ± 0.5 | 7.6 ± 1.2 | 11.8 ± 1.6 |
| Potassium (meq/L) | 4.2 ± 0.4 | 4.4 ± 0.4 | 9.1 ± 0.8 | 14.1 ± 1.2 |
| Protein total (gr/dL) | 7.5 ± 0.7 | 7.8 ± 0.7 | 15.8 ± 1.5 | 22.2 ± 2.2 |
| Sodium (meq/L) | 138 ± 1.7 | 141 ± 5.2 | 280 ± 18 | 376 ± 14 |
| Triglyceride (mg/dL) | 127 ± 78 | 130 ± 81 | 267 ± 164 | 348 ± 208 |
| Uric acid (mg/dL) | 5.0 ± 0.9 | 5.0 ± 0.7 | 12.6 ± 2 | 26 ± 6 |
| Analyte | Mild hemolysis | Moderate hemolysis | Severe hemolysis |
|---|---|---|---|
| Mean difference ± SD | Mean difference ± SD | Mean difference ± SD | |
| Albumin (gr/dL) | 0.2 ± 0.3 | 5.4 ± 0.6 | 10 ± 1 |
| AST (IU/L) | 1 ± 10 | 29 ± 23 | 49 ± 26 |
| ALT (IU/L) | 4.2 ± 49 | 164 ± 74 | 206 ± 122 |
| ALP (IU/L) | 1.5 ± 7 | 40 ± 18 | 112 ± 34 |
| BUN (mg/dL) | 0.01 ± 0.2 | 0.3 ± 0.3 | 0.2 ± 0.3 |
| Bilirubin direct (mg/dL) | 0.05 ± 0.3 | 0.92 ± 0.6 | 1.81 ± 0.6 |
| Bilirubin total (mg/dL) | 0.3 ± 2.3 | 12 ± 5.1 | 19 ± 7.3 |
| Calcium (mg/dL) | 0.2 ± 0.6 | 11 ± 0.8 | 19 ± 2 |
| Cholesterol total (mg/dL) | 3.7 ± 6 | 190 ± 38 | 304 ± 61 |
| Creatinine (mg/dL) | 0.01 ± 0.1 | 0.61 ± 0.3 | 1.04 ± 0.3 |
| Glucose (mg/dL) | 3 ± 9 | 105 ± 18 | 173 ± 23 |
| Iron (μg/dL) | 3.4 ± 40 | 97 ± 63 | 195 ± 95 |
| LDH (IU/L) | 18 ± 72 | 678 ± 154 | 2374 ± 589 |
| Magnesium (mg/dL) | 0.04 ± 0.3 | 2.15 ± 0.4 | 3.56 ± 1.1 |
| Phosphorus (mg/dL) | 0.1 ± 0.7 | 4.1 ± 1.1 | 8.3 ± 1.7 |
| Potassium (meq/L) | 0.1 ± 0.3 | 4.8 ± 0.8 | 9.9 ± 1.1 |
| Protein total (gr/dL) | 0.2 ± 0.8 | 8.3 ± 1.2 | 15 ± 2.1 |
| Sodium (meq/L) | 3.3 ± 5 | 142 ± 18 | 238 ± 14 |
| Triglyceride (mg/dL) | 2.4 ± 95 | 139 ± 137 | 221 ± 211 |
| Uric acid (mg/dL) | 0.3 ± 1 | 7.8 ± 2 | 21 ± 4.6 |
Peer Reviews
No public reviews on file for this paper yet. If you reviewed it on a platform where reviews are public (OpenReview, ICLR, NeurIPS, ICML), you can paste yours below so the community can read it here.
Videos
No videos yet. Explain this paper in a talk, walkthrough, or lecture? Add one.
Taxonomy
TopicsClinical Laboratory Practices and Quality Control · Blood properties and coagulation · Iron Metabolism and Disorders
1. Introduction
Exogenous and endogenous substances can impact the results of a chemical assay. The most common and significant endogenous interferers are cell‐free hemoglobin, lipids, bilirubin, autoantibodies, and heterophile antibodies. The presence of one or more of these substances in a serum or plasma sample can bias the results, producing inaccurate interpretations [1, 2].
Cell‐free hemoglobin, also known as hemolysis, is defined as the rupture of the surrounding red blood cell (RBC) membranes, followed by the release of intracellular components into serum or plasma [3]. Hemolysis can occur both in vivo and in vitro. In vivo hemolysis can occur before blood collection due to pathological conditions such as infection, immune‐mediated processes, genetic diseases of RBCs, or disseminated intravascular coagulation (DIC). Only 2%‐3% of all hemolyzed samples contain in vivo hemolysis; on the other hand, in vitro hemolysis is the most common preanalytical error, accounting for over 60% of clinical chemistry sample rejections worldwide [4–9]. Increased RBC fragility, errors committed during the phlebotomy procedure, and improper specimen preparation and transportation are the most common causes of hemolysis observed in laboratory medicine [10, 11].
Sample rejection in hemolysis has a significant financial impact due to the need to repeat hemolyzed samples, longer turnaround times (TAT) as a result of sample rejection, diagnostic mistakes, unsuitable follow‐up tests or therapies, and longer hospital stays [10, 12]. Furthermore, if in vivo hemolysis is verified, rejecting samples is not advised. Such samples should be accepted for examination and, if possible, reported, as the results are accurate representations of the contents of the body [9, 10].
Most standard chemical measurements are impacted by hemolysis through four mechanisms. First, hemolysis may falsely raise blood components, such as alanine aminotransferase (ALT), aspartate aminotransferase (AST), blood urea nitrogen (BUN), lactate dehydrogenase (LDH), magnesium, phosphate, and potassium, as these substances are highly concentrated in RBCs and are released during RBC lysis. Second, colorimetric and turbidimetric values for other chemicals, such as bilirubin, may be mistakenly increased or decreased by free hemoglobin produced during hemolysis because hemoglobin absorbs heavily at 415, 540, and 570 nm. Third, because of the competitive activity of RBC adenylate kinase, hemolysis may unintentionally suppress certain metabolic events, such as the creatine kinase (CK) activity, and the fourth is sample dilution, which can have an impact on all other analytes. The ultimate effect is determined by the sum of the effects of several mechanisms [4, 13–16].
When the amount of cell‐free hemoglobin grows, serum or plasma’s color changes from orange at the hemolysis cutoff of 0.5 g/L to red and finally dark brown (10–20 g/L). Compared to automated methods (spectrophotometry) for the assessment of serum or plasma hemolysis, which are fast, accurate, automated, and reasonably priced, visual inspection is not only inaccurate but also highly variable across observers. Furthermore, automated measurement improves the identification of slightly hemolyzed materials that are not visually identifiable or are misjudged by laboratory staff [4, 9, 17].
Owing to the significance of the degree of hemolysis and to avoid needless sample rejection, it is essential to create and coordinate suitable techniques to determine potential cutoff points for the appropriate management of hemolysis. The hemolytic impact is largely dependent on the method and instrument, and different levels of hemolysis, as measured by the hemolytic index (HIX), are correlated with different levels of interference [10, 18–23].
Although cutoff points for rejection of samples are commonly recommended by the manufacturers of analytical systems, results of end‐user verification frequently diverge from what the manufacturer says. The Clinical and Laboratory Standards Institute (CLSI) recommends that the laboratories verify the intended usefulness, strengths, and limitations of manufacturer‐derived cutoff points before they are implemented [16, 21–25].
This study aimed to evaluate the effects of hemolysis at various HIX levels in our biochemical laboratory and establish a protocol for the management of hemolytic samples.
2. Methods
2.1. Study Design and Ethical Considerations
This cross‐sectional study was carried out in January 2024 at the clinical chemistry laboratory of Nemazee and Abu Ali Sina Hospitals (Shiraz, Iran), which are general and transplantation facilities, respectively. The study adhered to the principles of the Declaration of Helsinki. Moreover, the protocol was reviewed and approved by the Ethics Committee of Shiraz University of Medical Sciences (IR.SUMS.MED.REC.1401.555). The approval includes the use of fully de‐identified leftover clinical specimens, which are exempt from informed consent under institutional regulations.
2.2. Sample Preparation and Baseline Testing
Thirty leftover serum samples from healthy individuals with normal biochemical results were collected. Samples exhibiting initial biochemistry abnormalities or preanalytical issues (visible hemolysis, icterus, or lipemia) were excluded. All baseline measurements were performed using a DIRUI CS‐1200 autoanalyzer (DIRUI Industrial Co., China) for 20 routine biochemical analytes (including albumin, ALT, alkaline phosphatase [ALP], AST, bilirubin direct, bilirubin total, BUN, calcium, cholesterol total, creatinine, glucose, iron, LDH, magnesium, phosphorus, potassium, protein total, sodium, triglyceride, and uric acid), and the results were used as the reference/baseline values for subsequent analysis. The DIRUI CS‐1200 chemistry autoanalyzer used in this study was installed in our laboratory in 2019. All of the reagents were of analytical grade, and two levels of analysis were performed on internal quality control (QC) materials: level 1 (normal) and level 2 (high). Table 1 shows the details of the reagents.
2.3. Hemolysate Preparation and HIX Setting
Hemolysate was prepared for each case by mixing the heparinized whole blood of the cases with distilled water in a 1:1 ratio. The lysate was centrifuged at 3000 g for 10 min, and the supernatant was separated. The HIX was determined spectrophotometrically at 571 nm using a saline‐based blanking method [19, 26]. The free hemoglobin concentrations of hemolysates were used for calibration.
2.4. Simulation of Hemolysis and Interference Assessment
Increasing volumes of hemolysate were added to aliquots of each serum sample to obtain three defined levels of hemolysis based on HIX levels (g/L): mild (< 0.5 g/L), moderate (0.5–3.0 g/L), and severe (> 3.0 g/L), based on published recommendations by the IFCC and Guder et al. and adapted to the characteristics of the DIRUI system [27]. Subsequently, each new sample was reanalyzed for the same analytes under identical conditions. The dilution factor was accounted for result correction.
2.5. Bias Calculation and Interference Estimation
For each analyte, the absolute and relative differences (represented as bias) were calculated by comparing hemolyzed and baseline values. The obtained biases were compared against the CLIA‐defined total allowable error (TEa) to determine the safe reporting threshold [28]. The samples with biases greater than TEa were considered significant and nonreportable.
2.6. Statistical Analysis
SPSS v. 25.0 software (IBM Corp., Armonk, NY, USA) was used to analyze all the data. Descriptive statistics, including mean, standard deviation (SD), and percentage, were employed. Differences between hemolysis levels (mild, moderate, and severe) and the baselines were analyzed using repeated‐measures ANOVA with post hoc pairwise comparisons adjusted using the Bonferroni method. The significance threshold for the two‐sided test was less than 0.05.
3. Results
A total of 30 serum samples were evaluated at baseline and in three hemolytic states (mild, moderate, and severe). The mean HIX values for each state were 0.11, 0.69, 1.6, and 3.4 gr/L, respectively (Table 2).
As hemolysis (HIX) increased from mild to severe, a progressive increase was observed across all analytes. Analytes that were more impacted by hemolysis were LDH, uric acid, AST, and total bilirubin, in that order; direct bilirubin was the least impacted analyte (Table 2).
In mild hemolysis (HIX < 0.5), observed biases remained within the CLIA‐defined TEa for all analytes (p value < 0.05), while in moderate and severe hemolysis, the majority of analytes exceeded the TEa threshold (p value < 0.0001) (Table 3).
The percentage of bias for each analyte, relative to baseline value, is illustrated in Figure 1. Nonlinear patterns of interference were especially notable in intracellular analytes, such as LDH, potassium, AST, phosphorus, and iron. Conversely, extracellular markers such as albumin and sodium showed only minor changes. As illustrated in Figure 2, manufacturer‐stated cutoffs showed wide analyte‐to‐analyte variability, whereas our observed cutoffs were uniformly distributed around 0.5 g/L.
Percentage of bias for 20 biochemistry analytes at different levels of hemolysis.
Regression analysis comparing kit‐stated hemolysis cutoffs with the locally observed cutoffs for 20 biochemical analytes.
4. Discussion
Hemolysis is still one of the most prevalent and inevitable interferences in clinical laboratories that has a major effect on the accuracy of biochemical test results. In this study, we investigated the effect of varying degrees of hemolysis on 20 routine biochemical analytes using the DIRUI CS‐1200 autoanalyzer.
Our findings confirmed that the degree of interference is highly analyte‐dependent and tends to follow both linear and nonlinear patterns. While all analytes revealed a positive bias with increasing HIX, the magnitude of change varied significantly. More significant alterations were seen in LDH, uric acid, AST, and total bilirubin, consistent with prior studies highlighting their high intracellular concentrations and susceptibility to hemolysis [29–31]. Moreover, the observed nonlinear positive bias for certain intracellular analytes, such as potassium and phosphorus, supports the concept of concentration‐dependent interference, which has been emphasized in recent publications [15, 32, 33]. Conversely, analytes that are mainly extracellular, including albumin, sodium, total protein, and cholesterol, show minimal or linear increases in bias, as their levels are less affected by cell lysis [34, 35].
Another notable finding was that in mild hemolysis (HIX < 0.5 g/L), the results of all analytes were below the TEa defined by CLIA, indicating acceptable analytical performance. This threshold was thus set in our laboratory as an internal reporting cutoff, facilitating a safe and practical policy for managing mildly hemolyzed samples. In cases of mild hemolysis (HIX < 0.5), results are reported alongside a clear comment indicating the presence of hemolysis and specifying the HIX value, allowing clinicians to interpret results with appropriate caution. This acceptable cutoff was significantly lower than the cutoffs provided by the reagent manufacturer for most analytes.
Importantly, our research underscores the necessity for laboratories to perform local validation of hemolysis interference rather than relying solely on manufacturer‐stated or reference‐derived cutoffs. Instruments, reagents, optical systems, and even population variations may impact hemolysis interference, and guidelines from CLSI (C56‐A) and IFCC recommend such local verifications to ensure clinical accuracy.
A key strength of our study is the comprehensive evaluation of 20 analytes under controlled hemolysis conditions, along with the application of a quantitative HIX method. Nonetheless, our results should be interpreted regarding certain limitations. First, the induced in vitro hemolysis we used may not fully represent the real in vivo hemolysis. Second, although we accounted for sample dilution, enzymatic inactivation or matrix effect could still influence the results.
5. Limitations
A limitation of the study is that the DIRUI CS‐1200 is a mid‐tier analyzer which, despite its use in many regional laboratories, is less commonly utilized in large tertiary or reference centers. This may reduce the generalizability of our findings to laboratories that predominantly operate Abbott, Roche, Siemens, or Beckman chemistry platforms.
Another limitation is that analyzer‐specific CV% values were not used to compute allowable bias thresholds. This omission may cause CLIA‐based limits to appear more permissive than CV‐driven criteria. Therefore, the 0.5 g/L cutoff should be considered a functional reporting threshold rather than the most conservative analytical limit. Incorporating local CV% data will strengthen future validation efforts and allow for a more stringent definition of hemolysis interference.
6. Conclusion
This study supports the implementation of a laboratory‐specific management protocol for hemolysis interference. The use of an HIX‐based cutoff of 0.5 gr/L allows for reliable reporting of biochemistry analytes in mild hemolysis. Other laboratories are encouraged to conduct similar research tailored to their local laboratory settings and population to improve analytical quality and reduce unnecessary specimen rejection.
Author Contributions
N.S., S.Z., B.S.Y., and S.M. developed the concept of the study and the study design and wrote the draft manuscript. N.S., S.Z., and M.J.E. set up the tests on autoanalyzers. M.J.E. and F.A. did the analyses. N.S. and S.Z. selected the cases and samples. N.S., S.Z., D.S., and S.K. with the input of all authors interpreted the data.
Funding
This project has no institutional funding.
Disclosure
The views and opinions expressed in this article are those of the authors and do not necessarily reflect the official policy or position of any affiliated institutions or organizations of the authors. All authors have read and approved the final manuscript.
Conflicts of Interest
The authors declare no conflicts of interest.
The reference list from the paper itself. Each links out to its DOI / PubMed record.
- 1Agarwal S. , Vargas G. , Nordstrom C. , Tam E. , Buffone G. J. , and Devaraj S. , Effect of Interference From Hemolysis, Icterus and Lipemia on Routine Pediatric Clinical Chemistry Assays, Clinica Chimica Acta. (2015) 438, 241–245, 10.1016/j.cca.2014.08.008, 2-s 2.0-84907485552.25128720 · doi ↗ · pubmed ↗
- 2Tian G. , Wu Y. , Jin X. et al., The Incidence Rate and Influence Factors of Hemolysis, Lipemia, Icterus in Fasting Serum Biochemistry Specimens, Public Library of Science ONE. (2022) 17, no. 1, 10.1371/journal.pone.0262748.PMC 876934935045128 · doi ↗ · pubmed ↗
- 3Guder W. G. , Hemolysis as an Influence and Interference Factor in Clinical Chemistry, Journal of Clinical Chemistry and Clinical Biochemistry. (1986) 24, no. 2, 125–126.3711796 · pubmed ↗
- 4Simundic A. M. , Topic E. , Nikolac N. , and Lippi G. , Hemolysis Detection and Management of Hemolyzed Specimens, Biochemical Medicine. (2010) 20, 154–159, 10.11613/bm.2010.018. · doi ↗
- 5Jones B. A. , Calam R. R. , and Howanitz P. J. , Chemistry Specimen Acceptability: A College of American Pathologists Q-Probes Study of 453 Laboratories, Archives of Pathology and Laboratory Medicine. (1997) 121, no. 1, 19–26.9111088 · pubmed ↗
- 6Simundic A. M. , Nikolac N. , Vukasovic I. , and Vrkic N. , The Prevalence of Preanalytical Errors in a Croatian ISO 15189 Accredited Laboratory, Clinical Chemistry and Laboratory Medicine. (2010) 48, no. 7, 1009–1014, 10.1515/cclm.2010.221, 2-s 2.0-77953868631.20441481 · doi ↗ · pubmed ↗
- 7Carraro P. , Servidio G. , and Plebani M. , Hemolyzed Specimens: A Reason for Rejection or a Clinical Challenge?, Clinical Chemistry. (2000) 46, no. 2, 306–307, 10.1093/clinchem/46.2.306.10657399 · doi ↗ · pubmed ↗
- 8Simundic A. M. , Nikolac N. , and Guder W. G. , Rifai N. , Horvath R. , and Wittwer C. , Preanalytical Variation and Preexamination Processes, Tietz Textbook of Clinical Chemistry and Molecular Diagnostics, 2018, 6th edition, Elsevier, St. Louis, Missouri, 81–120.