Deep learning-based assessment of PD-L1 expression in NSCLC predicts outcome for patients treated with anti-PD-1 immunotherapy
Morgane Peroz, Nicolas Roussot, Alis Ilie, David Rageot, Valentin Derangere, Caroline Truntzer, François Ghiringhelli

TL;DR
A deep learning model analyzing PD-L1 immunohistochemistry slides can predict outcomes for lung cancer patients receiving anti-PD-1 therapy better than traditional methods.
Contribution
A novel deep learning approach to PD-L1 IHC slides identifies histological patterns that improve outcome prediction in NSCLC patients.
Findings
Deep learning groups (DLHigh vs. DLLow) showed significantly longer progression-free survival in both training and validation cohorts.
DL classification provided prognostic information beyond conventional PD-L1 tumor proportion scores.
Combining DL groups with clinical variables improved prediction of progression-free survival compared to clinical features alone.
Abstract
PD-L1 expression is widely used as a predictive biomarker for anti-PD-1 therapies in non-small cell lung cancer (NSCLC). However, its prognostic value remains controversial. Here, we investigated whether deep learning (DL) applied to PD-L1 immunohistochemistry (IHC) slides could identify histological patterns predictive of outcome in patients treated with anti-PD-1 therapy. We analyzed two independent NSCLC cohorts: MSK (n=182, training) and CGFL (n=108, validation). Tumor regions were manually annotated, tiled, stain-normalized, and processed through the UNI foundation model to extract deep features. Clustering of tiles from 10 extreme-outcome MSK cases identified histology-based subgroups. These were then applied to the remaining patients by projection and majority voting. Associations with progression-free survival (PFS) and overall survival (OS) were assessed. DL groups were…
Genes, proteins, chemicals, diseases, species, mutations and cell lines named across the full text — each resolved to its canonical identifier and authoritative record.
Click any figure to enlarge with its caption.
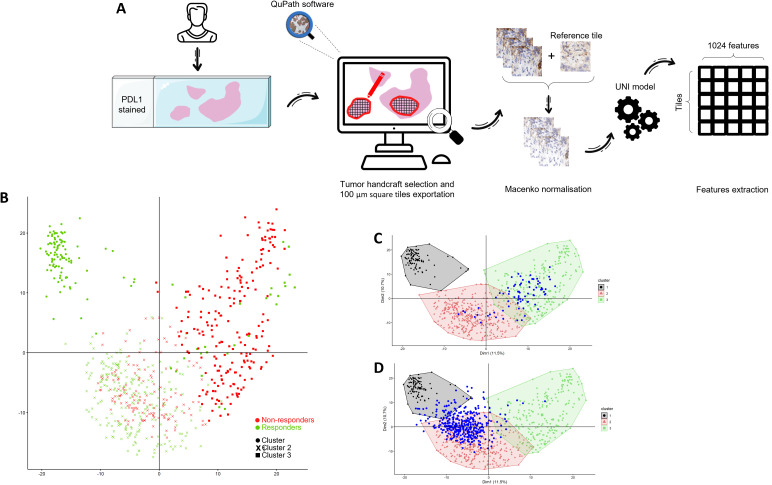 Figure 1
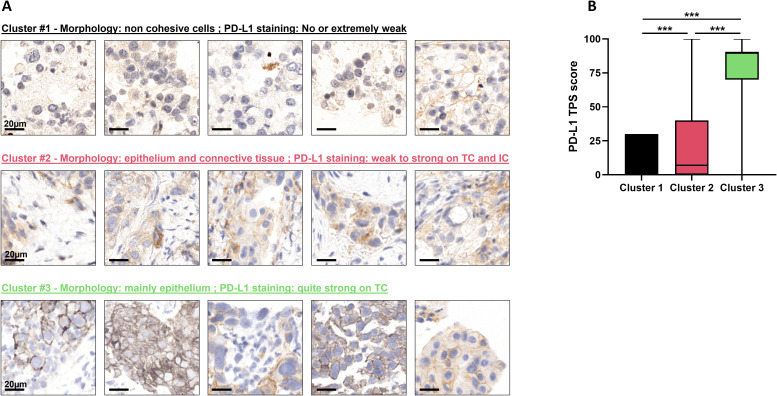 Figure 2
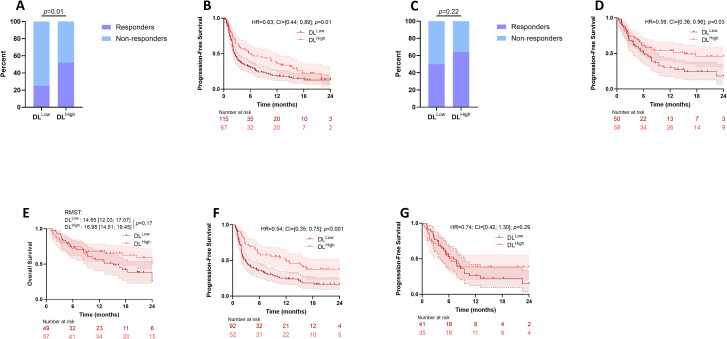 Figure 3
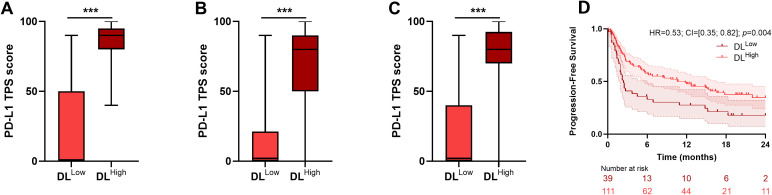 Figure 4
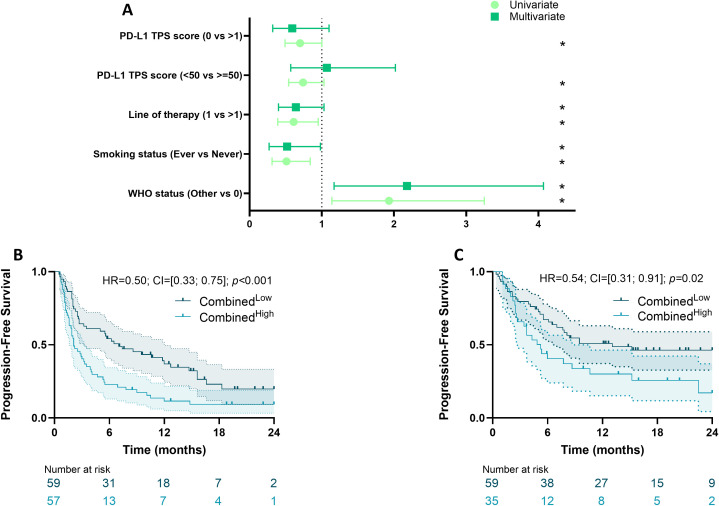 Figure 5
| Characteristics |
|
|
|
|
|
|---|---|---|---|---|---|
| Smoking status | |||||
| Never | 26 (9.3%) | 21 (12%) | 5 (5.2%) | ||
| Current | 149 (53%) | 114 (63%) | 35 (36%) | <0.001 | <0.001 |
| Former | 104 (37%) | 47 (26%) | 57 (59%) | ||
| Unknown | 11 | 0 | 11 | ||
| WHO performance status | |||||
| 0 | 48 (17%) | 26 (14%) | 22 (22%) | <0.001 | <0.001 |
| 1 | 196 (69%) | 142 (78%) | 54 (53%) | ||
| 2 | 35 (12%) | 12 (6.6%) | 23 (23%) | ||
| 3 | 4 (1.4%) | 2 (1.1%) | 2 (2.0%) | ||
| 4 | 1 (0.4%) | 0 (0%) | 1 (1.0%) | ||
| Unknown | 6 | 0 | 6 | ||
| Histological type | |||||
| Adenocarcinoma | 209 (72%) | 129 (71%) | 80 (74%) | 0.4 | 0.4 |
| Squamous | 53 (18%) | 32 (18%) | 21 (19%) | ||
| Other | 28 (9.7%) | 21 (12%) | 7 (6.5%) | ||
| RECIST | |||||
| Complete Response | 22 (10%) | 5 (4.3%) | 17 (17%) | <0.001 | <0.001 |
| Partial Response | 73 (34%) | 32 (28%) | 41 (41%) | ||
| Stable Disease | 34 (16%) | 20 (17%) | 14 (14%) | ||
| Progressive Disease | 87 (40%) | 59 (51%) | 28 (28%) | ||
| Unknown | 74 | 66 | 8 | ||
| Treatment | |||||
| Immunotherapy (Anti PD1 alone) | 142 (64%) | 112 (96%) | 30 (28%) | <0.001 | <0.001 |
| Chemoimmmunotherapy | 76 (34%) | 0 (0%) | 76 (72%) | ||
| Anti PD1 and anti CTLA4 combination | 4 (1.8%) | 4 (3.4%) | 0 (0%) | ||
| Unknown | 68 | 66 | 2 | ||
| Line of therapy | |||||
| 1 | 146 (66%) | 40 (34%) | 106 (100%) | <0.001 | <0.001 |
| >1 | 76 (34%) | 76 (66%) | 0 (0%) | ||
| Unknown | 68 | 66 | 2 | ||
| PDL1 (cutoff at 50%) | |||||
| <50 | 140 (48%) | 86 (47%) | 54 (50%) | 0.7 | 0.7 |
| ≥50 | 150 (52%) | 96 (53%) | 54 (50%) | ||
| PDL1 (cutoff at 1%) | |||||
| 0 | 66 (23%) | 51 (28%) | 15 (14%) | 0.006 | 0.007 |
| ≥1 | 224 (77%) | 131 (72%) | 93 (86%) | ||
|
|
| ||||
|---|---|---|---|---|---|
| Characteristics |
|
|
|
|
|
| Smoking status | 182 | ||||
| Never | |||||
| Ever | 0.51 (0.31; 0.84) | 0.007 | 0.50 (0.27; 0.96) | 0.036 | |
| WHO performance status | 182 | ||||
| 0 | |||||
| ≥1 | 1.93 (1.14; 3.25) | 0.014 | 2.10 (1.13; 3.90) | 0.019 | |
| Histological type | 182 | ||||
| Adenocarcinoma | |||||
| Squamous | 1.18 (0.78; 1.80) | 0.4 | 1.29 (0.74; 2.26) | 0.4 | |
| Other | 0.80 (0.46; 1.40) | 0.4 | 1.95 (0.90; 4.20) | 0.089 | |
| PDL1 (cutoff at 50%) | 182 | ||||
| <50 | |||||
| ≥50 | 0.74 (0.54; 1.03) | 0.076 | 0.79 (0.50; 1.26) | 0.03 | |
| Treatment | 116 | ||||
| Immunotherapy | |||||
| Anti PD1 and anti CTLA4 | 2.99 (1.08; 8.27) | 0.035 | 2.88 (1.03; 8.07) | 0.045 | |
| Line of therapy | 116 | ||||
| >1 | |||||
| 1 | 0.61 (0.39; 0.95) | 0.03 | 0.60 (0.37; 0.95) | 0.03 | |
Peer Reviews
No public reviews on file for this paper yet. If you reviewed it on a platform where reviews are public (OpenReview, ICLR, NeurIPS, ICML), you can paste yours below so the community can read it here.
Videos
No videos yet. Explain this paper in a talk, walkthrough, or lecture? Add one.
Taxonomy
TopicsCancer Immunotherapy and Biomarkers · Radiomics and Machine Learning in Medical Imaging · Ferroptosis and cancer prognosis
Introduction
Immune checkpoint inhibitors (ICIs) targeting the programmed death 1 (PD-1) and programmed death-ligand 1 (PD-L1) axis have revolutionized the treatment landscape of advanced and metastatic non-small cell lung cancer (NSCLC), offering durable clinical benefit and improved survival outcomes for a subset of patients (1–4). Currently, these treatments are commonly used as first-line therapy as monotherapy or in combination with chemotherapy in patients without targetable oncogenic driver alterations (5). Despite these advances, only approximately 20–30% of patients receiving ICI monotherapy experience meaningful responses, highlighting the critical need for more accurate predictive biomarkers to guide patient selection and optimize therapeutic efficacy (6, 7).
Currently, the expression of PD-L1 protein, typically measured by immunohistochemistry (IHC) on tumor biopsies, serves as the unique standard biomarker to stratify patients for anti-PD-1/PD-L1 therapies (8). In particular, the decision to select treatment comprising immunotherapy alone or chemoimmunotherapy is mainly based on the assessment of PD-L1 status using Tumor Proportion Score (TPS). When TPS is above 50%, immunotherapy alone may be used instead of chemoimmunotherapy (9). However, PD-L1 expression is an imperfect indicator of response due to several limitations. First, technical variability arising from different antibody clones (e.g., 22C3, SP263, QR1), staining protocols, and interobserver interpretation can lead to inconsistent scoring (10). In addition, intratumoral PD-L1 expression is not only limited to tumor cells, but heterogeneity of PD-L1 expression and dynamic changes induced by prior treatments or the tumor microenvironment further complicate accurate assessment (11). Clinically, some patients with low or negative PD-L1 expression may respond to ICIs, whereas a significant proportion of patients with high PD-L1 levels do not achieve clinical benefit.
In this context, the emergence of artificial intelligence (AI) and deep learning approaches in computational pathology offers promising solutions to overcome these challenges. Deep convolutional neural networks can analyze whole-slide images and extract subtle histopathologic and spatial features beyond the capabilities of traditional microscopy (12, 13). These models have been demonstrated to provide reproducible and objective PD-L1 quantification across different assays and institutions (14–16). Moreover, deep learning algorithms can integrate information on tumor-infiltrating immune cells, tumor architecture, and stromal components that are critical determinants of immunotherapy response, but difficult to quantify manually (17, 18).
Building on these technological advances, our study aims to develop and externally validate a deep learning–based model for the assessment of PD-L1 expression in NSCLC. We hypothesize that this approach will not only refine the accuracy and consistency of PD-L1 scoring but will also improve the prediction of clinical outcomes for patients treated with anti-PD-1 immunotherapy compared to conventional methods.
Methods
Patient selection
The first cohort was a public dataset downloaded from SYNAPSE (https://www.synapse.org/Synapse:syn26722053) and recently published (19) comprising 182 patients. The inclusion criteria for this cohort were: patients with stage IV NSCLC who initiated treatment with anti-PD-(L)1 blockade therapy between 2014 and 2019 at the study institution, and who had a baseline CT scan, baseline PD-L1 IHC assessment and next-generation sequencing by MSK IMPACT. The second cohort comprised 108 NSCLC tumor biopsies collected between 2015 and 2024 in the Department of Pathology of the Georges François Leclerc Cancer Center in Dijon, France. The inclusion criteria for this cohort were: patients with stage IV NSCLC who initiated treatment with anti-PD-(L)1 blockade therapy between January 2017 and December 2023 at the study institution.
Ethics committee approval
Only patients from whom informed consent was obtained were included in this retrospective study. The present study was approved by the CNIL (French national commission for data privacy) and the Georges François Leclerc Cancer Center (Dijon, France) local ethics committee, and was performed in accordance with the Helsinki Declaration and European legislation. This study falls within the scope of the biobanking authorization registered under the registration number AC-2014-2260.
Histological staining
MSK Cohort: IHC was performed on 4-μm FFPE tumor tissue sections using a standard PD-L1 antibody (E1L3N; dilution 1:100, Cell Signaling Technologies) validated in the clinical laboratory at the study institution. Staining was performed using an automated immunostaining platform (Bond III, Leica) using heat-based antigen retrieval employing a high pH buffer (epitope retrieval solution-2, Leica) for 30 min. A polymeric secondary kit (Refine, Leica) was used for detection of the primary antibody.
CGFL Cohort: PD-L1 protein expression in tumor cells was assessed using immunohistochemistry with a ready-to-use PDL1 commercial kit with QR1 or 22C3 antibodies. Tonsil tissue served as positive control tissue.
Image digitalization
MSK Cohort: PD-L1 IHC-stained diagnostic slides were digitally scanned at a minimum of ×20 magnification using an Aperio Leica Biosystems GT450 v.1.0.0.
CGFL Cohort: PD-L1 IHC-stained diagnostic slides were digitalized with an Evident VS200 (Evident) at 20× magnification to generate a whole slide imaging (WSI) file in vsi format.
Image analysis procedure
For all tumor slides, tumor area zones were manually selected, then these areas were separated into 100µm square tiles. Colors were normalized using MACENKO algorithm (20) and processed using UNI deep learning model (21) to extract high dimensional feature vectors (Figure 1A).
Feature analysis and cluster creation. (A) Flowchart of study design from PDL1 staining to UNI feature extraction. (B) Principal component analysis (PCA) of tile-level features extracted from 5 responder and 5 non-responder MSK patients. PCA was computed using all tiles from these patients (n=681), followed by hierarchical clustering on principal components (HCPC), resulting in three clusters. Different shapes indicate cluster membership, while tile color reflects response status (green: responders; red: non-responders). The numbers of tiles per cluster were 100, 349, and 232, respectively. Tiles from one MSK patient (C) and one CGFL patient (D) were projected a posteriori onto the PCA space trained on the MSK cohort without re-estimating either the PCA loadings or the cluster structure. Colored regions correspond to the convex hull enclosing all MSK tiles belonging to each cluster and are used solely to visualize the spatial extent of each group. Blue dots indicate tiles from the projected patient.
To ensure consistency across datasets, we performed feature-wise normalization using the MSK cohort as a reference. For each of the 1,024 features, we calculated its mean and standard deviation across all MSK patients. These feature-specific statistics were then used to normalize the data in the CGFL cohort: for each patient and each feature, the corresponding MSK cohort mean was subtracted and the result divided by the corresponding MSK cohort standard deviation. This procedure ensures that each feature is scaled relative to its distribution in the MSK cohort.
Statistical analysis
Quantitative variables are described as median and Interquartile Range (IQR), and qualitative variables as number and percentage. Patient characteristics were compared by cohort (whole cohort, MSK and CGFL) using the Chi-2 or Fisher’s exact test for qualitative variables, and the Wilcoxon rank sum test for continuous variables, as appropriate.
Survival analysis was performed using the survival R library. The prognostic value of the different variables was tested using univariate or multivariate Cox models for PFS when conditions of the model validity were applicable. Proportional hazards assumptions were tested based on Schoenfeld residuals. When the proportionality assumption was not verified, we fitted an extended Cox model, with time dependent coefficients for relevant variables; the time varying coefficient was described with a parametric time function. Survival probabilities were estimated using the Kaplan–Meier method and survival curves were compared using the log-rank test when appropriate. When the proportional hazards assumption was not checked, the estimated restricted mean survival time (RMST) for DFS at 24 months was assessed to compare groups of interest (SurvRM2 R library (22)). P-values less than 0.05 were considered statistically significant.
Statistical analyses were performed using the R software (http://www.R-project.org/) and graphs were drawn using GraphPad Prism version 9.0.2.
Results
Patient selection and characteristics
We used a public data set from patients treated for NSCLC at Memorial Sloan Kettering (MSK) Cancer Center and who received PD-(L)1-blockade-based therapy. These patients were treated between 2014 and 2019 (cohort characteristics are shown in Table 1). The second data set is constituted of patients treated in France for NSCLC at Center Georges Francois Leclerc between 2015 and 2024 with PD-(L)1-blockade-based therapy or chemoimmunotherapy; this cohort was used as a validation cohort. In the total population, there were more male than female patients. Most patients were smokers or former smokers, and the main histological type was adenocarcinoma. When pooling both cohorts, in first line, 212 patients were treated with anti PD-1-blockade-based therapy and 76 with chemoimmunotherapy. Immunotherapy was used in first line for 146 (66%) patients. PD-L1 TPS status is 0% for 66 patients, between 1 and 49% for 74 patients and greater than 50% for 150 patients.
Comparison of the clinical variable between the two cohorts showed differences for all available characteristics, except for histological type and PD-L1 TPS status with a cutoff at 50%, thus demonstrating the substantial heterogeneity between the two data sets.
Generation of the deep learning procedure
10 patients from the MSK cohort were then isolated to train the model. We selected the five patients with the longest Progression-Free Survival (PFS) who did not progress, and the five patients with the shortest PFS who progressed. This corresponds to 361 tiles associated with response and 350 tiles associated with absence of response. Using Principal Components Analysis (PCA) followed by Hierarchical Clustering, tiles were separated into 3 clusters. Cluster 1 was constituted of responders only, cluster 2 was a mixture of responders and non-responders and cluster 3 was enriched in non-responders (Figures 1A, B).
To illustrate which histological patterns distinguish DL^High^ from DL^Low^ groups, Figure 2A provides representative tiles of each cluster. Morphologically, Cluster 1 matched tiles with low-cohesive epithelial cells that displayed a negative or an extremely weak stain for PD-L1. Cluster 2 matched tiles that mixed tumor epithelial cells with or without adjacent connective tissue. In this cluster PD-L1 staining was either low or quite strong, localized on tumor cells (TC) or immune cells (IC). Finally, cluster 3 was mainly represented by tiles displaying epithelial tumor cells with strong PD-L1 staining.
*Cluster interpretation. (A) Representative tiles of each cluster with corresponding visual descriptions. (B) Boxplots of the PD-L1 TPS score in Clusters 1 (n=1923 tiles), 2 (n=21–193 tiles) and 3 (n=28–747 tiles) for the pooled cohort. **p-value<0.001.
These observations were concordant with quantitative evaluation of PD-L1 through staining (Figure 2B).
For the remainder of the patients, we projected each new patient’s tile onto the training PCA space (Figures 1C, D). We looked at which centroid this tile was closest to, and assigned it the label of the corresponding cluster. We then counted the total number of tiles assigned to each of the three clusters and, by majority voting, assigned the patient to the cluster with the most tiles. The same process was then applied in the remaining 172 patients from MSK cohort and on the validation set from 108 patients from CGFL (Supplementary Figure S1).
Prognostic role of the deep learning model
Clusters 1 and 2 exhibited similar PFS rates (results not shown) and were thus grouped together: in the so-called DL^High^ group; cluster 3 constituted the DL^Low^ group. In the training set, 67 patients were attributed to the DL^High^ group and 115 patients to DL^Low^. When looking at response rates, there were 2 Complete Responses (CR), 14 Partial Responses (PR) in the DL^High^ group and 3 CR and 18 PR in the DL^Low^ group (Chi-2 test p-value=0.01). When using PFS as an endpoint, patients in the DL^High^ group had better PFS than patients classified as DL^Low^ (HR = 0.63 [0.44, 0.89; p=0.01) with a median PFS of 5.7 vs 2.5 months for training cohort. Overall survival was not available for this cohort(Figures 3A, B).
Association between survival and DL model derived groups. Barplots comparing the proportion of responders (Complete Response and Partial Response) and non-responders (Stable Disease and Progressive Disease) according to DL model derived classifier for the MSK (A) and the CGFL (C) cohorts. Kaplan-Meier curves with patients stratified according to the DL model derived classifier for progression-free survival for the MSK (B) and the CGFL (D) cohorts. (E) Kaplan–Meier curves with patients stratified according to the DL model derived classifier for overall survival for the CGFL cohort. Kaplan-Meier curves with patients stratified according to the DL model derived classifier for progression-free survival for the pooled cohort in patients treated with immunotherapy alone (F) and chemoimmunotherapy (G). DL, Deep Learning.
When applying the DL model in the validation cohort, 58 patients were attributed to the DL^High^ group and 50 patients to DL^Low^. When looking at response rates, there were 11 CR and 25 PR in the DL^High^ group, and 6 CR and 16 PR in the DL^Low^ group (Chi-2 test p-value =0.22). When using PFS as an endpoint, patients classified as DL^High^ had better PFS than patients classified as DL^Low^ (HR = 0.59 [0.36, 0.96]; p=0.03) with median PFS of 15.2 vs 6.2 months for the validation cohort. When looking at Overall Survival (OS), patients classified as DL^High^ did not have significantly better OS than patients classified as DL^Low^ (RMST: DL^Low^ 14.55[12.03;17.07] vs DL^High^ 16.98 [14.51;19.45]; p = 0.17) with median OS of 37.7 vs 15.2 months (Figures 3C-E).
To complete the analysis, all patients were grouped together and divided according to their treatment. The DL model successfully identified significant subgroups with distinct survival, offering a more refined stratification for patients treated with immunotherapy alone (Figure 3F). For patients treated with chemoimmunotherapy, the DL model did not distinguish patients’ outcome (Figure 3G).
Correlation with PD-L1 TPS score
We examined the association between DL model groups and PD-L1 TPS score. In each cohort and in the pooled cohort, PD-L1 TPS score was significantly higher in patients in the DL^High^ group (Figures 4A–C). However, there was not complete agreement between the two scoring systems: PD-L1 TPS score 0% was detected in the DL^High^ group, while PD-L1 TPS score >50% were also detected in the DL^Low^ group.
*Link between PD-L1 TPS score and DL model derived groups. Boxplots of the PD-L1 TPS score in DLLow and DLHigh groups for MSK (A), CGFL (B) and whole (C) cohorts. (D) Kaplan-Meier curves with patients stratified according to the DL model derived classifier for progression-free survival for the pooled cohort in the high PD-L1 TPS score group. **p-value<0.001. DL, Deep Learning.
Moreover, when stratifying patients into high (≥50%) and low (<50%) PD-L1 TPS score groups, the DL model successfully identified significant subgroups with distinct survival, offering a more refined stratification for patients with high PD-L1 TPS score (Figure 4D). In the low (<50%) PD-L1 TPS score group, the DL model did not significantly distinguish patients’ outcome (results not shown).
DL score improves patient prediction in multivariate model
Clinical variables associated with PFS were selected based on univariate Cox models, and a multivariate clinical model was then estimated based on variables with p-values<0.1 (Figure 5A; Table 2). Because PD-L1 TPS score is correlated with the DL model, this variable was excluded from the multivariate model. WHO performance status, smoking status, treatment information and line of therapy were retained in the model. Variables selected in the clinical model and the DL group variable were combined in a unique multivariate survival model, named the “combined model”. A combined score was then estimated using the linear predictor of the combined model. Using the median as a cut-off, patients with a low score had better PFS than those with a high score (HR = 0.50 [0.33; 0.75]; p<0.001, Figure 5B). Similar observations were made in the validation cohort, using a threshold adapted to the cohort (HR = 0.54 [0.31; 0.91]; p=0.02 (Figure 5C). In the pooled cohort, AUCs of the DL model, clinical and combined model were respectively 0.36, 0.66 and 0.71. The likelihood-ratio test showed that our DL score significantly added prognostic value to the clinical model (p=0.03 when comparing clinical and combined model).
*Survival analysis of clinical variables and DL model. (A) Forest plots representing hazard ratios and confidence intervals for univariate and multivariate Cox models for Progression-Free Survival estimated using clinical variables. p-value<0.1. Kaplan-Meier curves with patients stratified according to the combined score for progression-free survival for the MSK (B) and the CGFL (C) cohorts. DL, Deep Learning.
Discussion
The integration of ICIs into the treatment of advanced and metastatic NSCLC has transformed patient care by offering durable responses and improved survival for some patients (1–4). However, despite the revolutionary impact of agents targeting the PD-1/PD-L1 axis, the clinical benefit remains small and limited to approximately 20–30% of patients when allcomers are treated, a reflection of the underlying heterogeneity of NSCLC and the complex nature of antitumor immunity (7). This limitation underscores the critical need for reliable and robust biomarkers to optimize patient selection, guide therapeutic strategies, and ultimately enhance the efficacy of ICIs.
Current clinical decision-making relies heavily on the assessment of PD-L1 expression by IHC, with TPS guiding the choice between ICI monotherapy and chemoimmunotherapy (8, 9). While patients with high PD-L1 TPS (≥50%) may be offered immunotherapy alone, this biomarker is imperfect (10). As shown in recent reviews and practice guidelines, PD-L1 expression is subject to challenges such as technical variability among antibody clones and platforms, subjective interpretation, and spatial as well as temporal heterogeneity within tumors. Furthermore, discordance between PD-L1 status and response is well-documented: some patients with high PD-L1 expression achieve little clinical benefit, while others with low or undetectable PD-L1 respond to ICIs. These shortcomings have driven active research into alternative and complementary biomarkers, including circulating tumor DNA, tumor mutational burden, gene expression signatures, and features derived from the tumor microenvironment. However, the clinical utility of these emerging biomarkers remains under investigation, and none have yet supplemented PD-L1 in routine practice.
In this context, AI and deep learning technologies are emerging as powerful tools in computational pathology. By analyzing digitized histopathology slides, deep learning models can extract high-dimensional features beyond the limits of human interpretation, offering more objective, reproducible, and potentially more informative assessments of the tumor immune landscape. Some studies have established different deep learning models for evaluating or predicting PD-L1 and have shown strong explanatory and predictive power using either H&E or PD-L1 labeled IHC slides (23–30).
In addition, some reports support the capacity of deep learning models to predict outcome in NSCLC using H&E slides (31–34). The present study demonstrates the development and validation of a deep learning-based approach to assess PD-L1 expression and predict outcomes with anti-PD-1 therapy in NSCLC. Not only does the deep learning model provide more consistent scoring versus traditional IHC-based TPS, it also encapsulates critical contextual information such as spatial patterns of immune infiltration that are difficult to quantify manually, thus leading to improved prediction of prognosis in the group of patients with PD-L1 TPS score ≥50%. We assume that our deep learning approach makes it possible to add morphological information that is not taken into account by expression of PD-L1 protein alone.
The clinical utility of this approach is highlighted by its independent prognostic value in both the training and external validation cohorts. Notably, patients classified as DL^High^ by the model experienced significantly better progression-free and overall survival compared to the DL^Low^ group, outperforming conventional PD-L1 TPS for predicting RECIST response, as well as PFS and OS. Importantly, while a significant correlation between DL^High^ status and higher PD-L1 TPS was observed, there remained notable discordance, supporting the notion that deep learning captures complementary—and perhaps more clinically relevant—biological information. The value of the deep learning model in prognostic stratification was further confirmed for patients with high PD-L1 TPS.
These findings align with a growing body of literature advocating for the integration of digital pathology and machine learning into predictive biomarker development for immunotherapy response. AI models enabling clinically relevant risk stratification for cancer immunotherapy beyond conventional PD-L1 TPS have been proposed (31, 34). Some tools for mechanistic interpretability have been designed to extract interpretable spatial features from imaging data (34, 35). The ability of AI-driven models to standardize and enhance the interpretation of complex histological and immunological features represents a major step forward, potentially paving the way for more precise, individualized immunotherapy in lung cancer and beyond.
Nevertheless, several limitations of our study should be acknowledged. First, the choice to select 10 patients may be debated. This choice was intended to consider extreme patients as highlighting representative patterns of response. However, this does raise concerns about the generalizability of our model. Second, the manual annotation of tumor regions by pathologists is inherently subjective and may introduce observer-dependent bias. Third, the retrospective nature of the study, together with the relatively limited sample size used for model training, raises concerns about generalizability. Consequently, extensive validation in larger, prospective, and multi-institutional cohorts is warranted before definitive clinical translation can be considered.
Additionally, while the DL model was built on digitalized IHC slides for PD-L1, integration with other multi-omic and microenvironmental features—such as genomics, transcriptomics, and spatial immune profiling—may further improve predictive power and should be explored in future studies. Finally, future work could be performed to strengthen mechanistic interpretability of our DL model through quantification of tissue heterogeneity and organizational complexity (35).
In summary, this study provides compelling evidence that deep learning models applied to routine histopathology can overcome the technical and biological limitations inherent to traditional PD-L1 assessment, offering a pragmatic and scalable approach to refining immunotherapy selection in NSCLC. As the field moves toward increasingly data-driven and personalized cancer care, such innovations are poised to play a critical role in optimizing outcomes for patients receiving ICIs.
The reference list from the paper itself. Each links out to its DOI / PubMed record.
- 1Brahmer J Reckamp KL Baas P CrinòL Eberhardt WEE Poddubskaya E . Nivolumab versus docetaxel in advanced squamous-cell non–small-cell lung cancer. New Engl J Med. (2015) 373:123–35. doi: 10.1056/NEJ Moa 1504627, PMID: 26028407 PMC 4681400 · doi ↗ · pubmed ↗
- 2Borghaei H Paz-Ares L Horn L Spigel DR Steins M Ready NE . Nivolumab versus docetaxel in advanced nonsquamous non–small-cell lung cancer. New Engl J Med. (2015) 373:1627–39. doi: 10.1056/NEJ Moa 1507643, PMID: 26412456 PMC 5705936 · doi ↗ · pubmed ↗
- 3Herbst RS Baas P Kim DW Felip E Pérez-Gracia JL Han JY . Pembrolizumab versus docetaxel for previously treated, PD-L 1-positive, advanced non-small-cell lung cancer (KEYNOTE-010): a randomised controlled trial. Lancet. (2016) 387:1540–50. doi: 10.1016/S 0140-6736(15)01281-7, PMID: 26712084 · doi ↗ · pubmed ↗
- 4Mok TSK Wu YL Kudaba I Kowalski DM Cho BC Turna HZ . Pembrolizumab versus chemotherapy for previously untreated, PD-L 1-expressing, locally advanced or metastatic non-small-cell lung cancer (KEYNOTE-042): a randomised, open-label, controlled, phase 3 trial. Lancet. (2019) 393:1819–30. doi: 10.1016/S 0140-6736(18)32409-7, PMID: 30955977 · doi ↗ · pubmed ↗
- 5Hendriks LE Kerr KM Menis J Mok TS Nestle U Passaro A . Non-oncogene-addicted metastatic non-small-cell lung cancer: ESMO Clinical Practice Guideline for diagnosis, treatment and follow-up. Ann Oncol. (2023) 34:358–76. doi: 10.1016/j.annonc.2022.12.013, PMID: 36669645 · doi ↗ · pubmed ↗
- 6Gandhi L Rodríguez-Abreu D Gadgeel S Esteban E Felip E Angelis FD . Pembrolizumab plus chemotherapy in metastatic non–small-cell lung cancer. New Engl J Med. (2018) 378:2078–92. doi: 10.1056/NEJ Moa 1801005, PMID: 29658856 · doi ↗ · pubmed ↗
- 7Mountzios G Remon J Hendriks LEL García-Campelo R Rolfo C Van Schil P . Immune-checkpoint inhibition for resectable non-small-cell lung cancer - opportunities and challenges. Nat Rev Clin Oncol. (2023) 20:664–77. doi: 10.1038/s 41571-023-00794-7, PMID: 37488229 · doi ↗ · pubmed ↗
- 8Hirsch FR Mc Elhinny A Stanforth D Ranger-Moore J Jansson M Kulangara K . PD-L 1 immunohistochemistry assays for lung cancer: results from phase 1 of the blueprint PD-L 1 IHC assay comparison project. J Thorac Oncol. (2017) 12:208–22. doi: 10.1016/j.jtho.2016.11.2228, PMID: 27913228 · doi ↗ · pubmed ↗