Glycemic control, including Time in Tight Range (TITR) evaluation, in children with type 1 diabetes treated with the MiniMed 780G system: a 3-year prospective, observational, two-center study
Mateusz Tarasiewicz, Wiktoria Bartnikowska, Agata Chobot, Anna Bielawska, Agnieszka Zając, Joanna Polańska, Przemysława Jarosz-Chobot, Sebastian Seget

TL;DR
This study evaluates glycemic control in children with type 1 diabetes using the MiniMed 780G system over three years.
Contribution
The study provides long-term data on glycemic management using the MiniMed 780G system in children with type 1 diabetes.
Findings
Time in Tight Range (TITR) initially increased but decreased after three years of using the MiniMed 780G system.
Auto-correction boluses significantly increased over time, contributing to maintained glycemic control.
Despite a slight decline, glycemic control metrics remained within recommended ranges for most of the observation period.
Abstract
The MiniMed 780G was the first commercially available automated insulin delivery (AID) system in Poland. The aim of this study was to analyze glycemic management in children with type 1 diabetes (T1D) after three years of using the system. The data included anthropometric measurements, information from insulin pumps, and continuous glucose monitoring (CGM) from fifty children with T1D (mean age: 9.9 ± 2.4 years; T1D duration at baseline: 3.9 ± 2.56 years) using the MiniMed 780G. The data were collected at AID initiation, 12 and 36 months after starting its use. Coefficient of variation (CV) and body mass index (BMI) z-scores at baseline and after 3 years were comparable (p > 0.05). TITR firstly increased after the AID system implementation with the peak value after 6 months (60.82% ± 9.34), then the values decreased to 56.50%± 10.78% after 3 years (p<0.001). Time in range (70–180…
Genes, proteins, chemicals, diseases, species, mutations and cell lines named across the full text — each resolved to its canonical identifier and authoritative record.
Click any figure to enlarge with its caption.
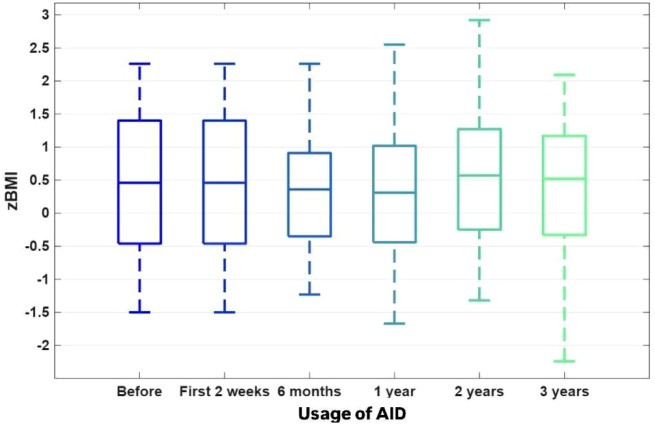 Figure 1
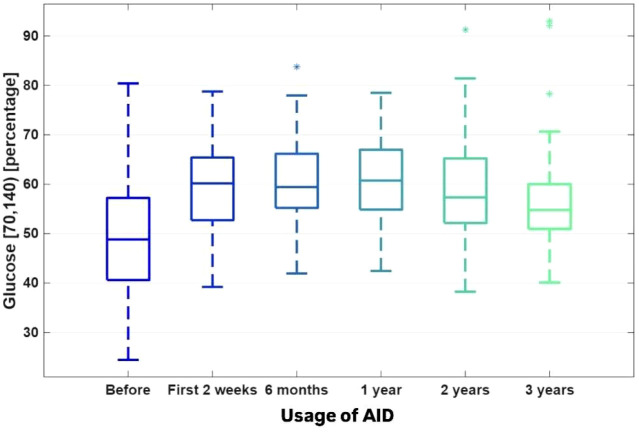 Figure 2
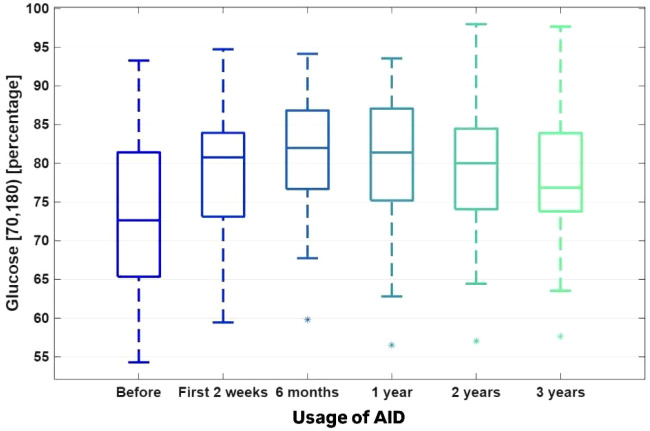 Figure 3
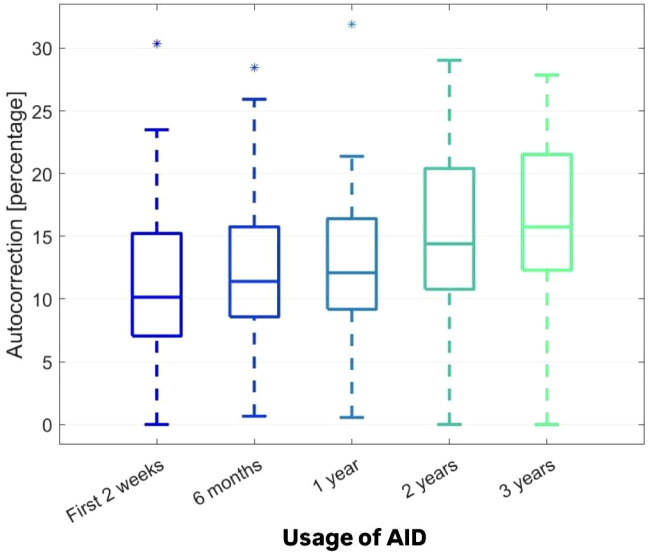 Figure 4
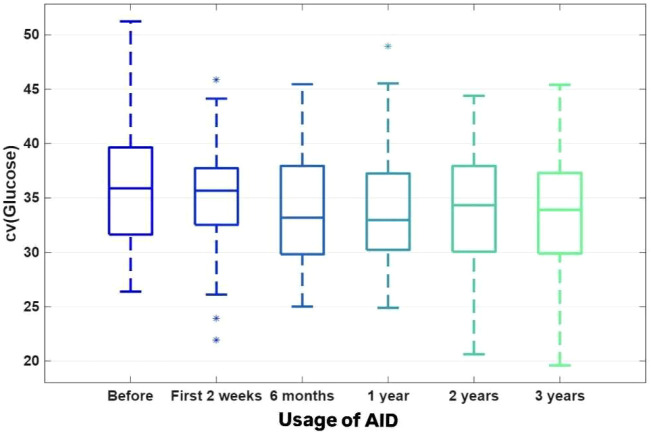 Figure 5
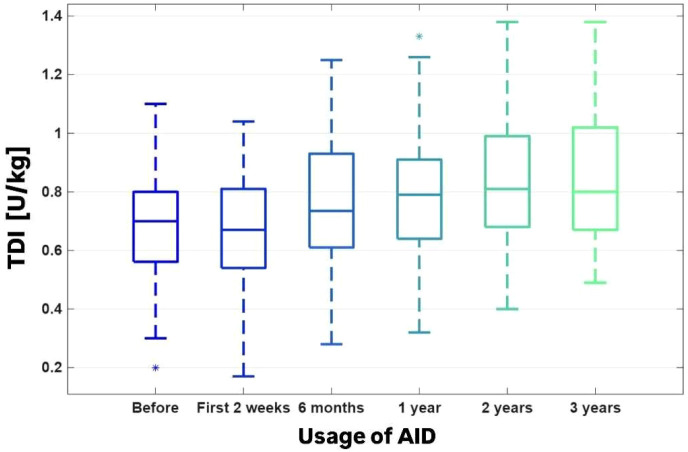 Figure 6
| The assessed parameter | The 2 weeks before AID implementation | The first 2 weeks of AID start | After 6 months | After 12 months | After 24 months | After 36 months | Friedman ANOVA p -value (PA) Jonckheere-Terpstra test p-value (PT) Kendall concordance coefficient (W) Benjamini_Hocheber FDR |
|---|---|---|---|---|---|---|---|
| Avg SG [mg/dl] | 145.03 ± 15.93 | 131.36 ± 11.04 | 132.46 ± 11.73 | 132.45 ± 13.42 | 136.09 ± 13.62 | 139.70 ± 13.69 | PA<0.000001 |
| GMI [%] | 6.68 ± 0.46 | 6.45 ± 0.26 | 6.48 ± 0.28 | 6.48 ± 0.32 | 6.57 ± 0.33 | 6.65 ± 0.33 | PA=0.00007 |
| HbA1C [%] | - | 6.69 ± 0.65 | - | - | - | 6.57 ± 0.61 | PA=0.101050 |
| CV [%] | 35.91 ± 5.72 | 34.99 ± 5.17 | 33.75 ± 5.02 | 34.06 ± 5.38 | 33.93 ± 9.86 | 33.77 ± 5.56 | PA=0.238656 |
| TDI [u/kg] | 0.69 ± 0.19 | 0.67 ± 0.20 | 0.77 ± 0.22 | 0.79 ± 0.20 | 0.84 ± 0.22 | 0.84 ± 0.22 | PA<0.000001 |
| Carbohydrates [g] | 193.24 ± 78.19 | 184.74 ± 78.42 | 206.44 ± 83.04 | 203.10 ± 79.80 | 215.20 ± 97.02 | 220.64 ± 113.10 | PA=0.000646 |
| Basal insulin [%] | 37.63 ± 10.83 | 34.88 ± 6.91 | 33.16 ± 5.09 | 35.08 ± 6.36 | 34.82 ± 6.21 | 34.65 ± 6.91 | PA<0.000001 |
| Bolus insulin [%] | 61.82 ± 10.97 | 65.06 ± 6.90 | 66.84 ± 5.09 | 64.92 ± 6.36 | 65.17 ± 6.21 | 65.12 ± 6.23 | PA<0.000001 |
| Autocorrection [%] | – | 11.24 ± 6.08 | 11.94 ± 5.63 | 12.40 ± 5.79 | 14.61 ± 7.00 | 16.34 ± 6.69 | PA<0.000001 |
| Usage of the sensor [%] | 90.52 ± 8.25 | 95.10 ± 3.94 | 94.04 ± 4.69 | 93.80 ± 4.53 | 95.66 ± 3.66 | 96.02 ± 3.60 | PA<0.000001 |
| Auto mode [%] | – | 94.26 ± 6.28 | 96.62 ± 5.70 | 97.56 ± 2.79 | 97.58 ± 3.21 | 97.16 ± 4.12 | PA=0.009132 |
| TAR 250 mg/dl [%] | 4.45 ± 3.51 | 2.33 ± 2.52 | 2.34 ± 2.31 | 2.68 ± 3.48 | 3.10 v 3.11 | 3.43 ± 3.15 | PA=0.000012 |
| TAR 180–250 mg/dl [%] | 18.05 ± 7.07 | 13.13 ± 5.74 | 12.83 ± 5.88 | 12.59 ± 5.78 | 14.21 ± 6.16 | 15.70 ± 5.51 | PA<0.0000001 |
| TIR 70–180 mg/dl [%] | 73.12 ± 9.77 | 79.28 ± 8.12 | 81.16 ± 7.83 | 80.40 ± 8.25 | 79.33 ± 8.19 | 77.74 ± 7.65 | PA=0.000001 |
| TITR 70–140 mg/dl [%] | 50.40 ± 11.38 | 59.45 ± 8.97 | 60.82 ± 9.34 | 60.72 ± 8.86 | 58.85 ± 10.36 | 56.50 ± 10.78 | PA<0.000001 |
| TBR 54–70 mg/dl [%] | 3.26 ± 2.42 | 4.15 ± 2.70 | 2.95 ± 1.76 | 3.40 ± 2.34 | 2.79 ± 2.09 | 2.50 ± 1.69 | PA=0.013111 |
| TBR <54 mg/dl [%] | 1.12 ± 1.63 | 1.11 ± 1.07 | 0.73 ± 0.77 | 0.93 ± 0.92 | 0.58 ± 0.70 | 0.49 ± 0.52 | PA=0.026647 |
- —Medical University of Silesia in Katowice10.13039/100007771
- —Silesian University of Technology10.13039/501100007835
Peer Reviews
No public reviews on file for this paper yet. If you reviewed it on a platform where reviews are public (OpenReview, ICLR, NeurIPS, ICML), you can paste yours below so the community can read it here.
Videos
No videos yet. Explain this paper in a talk, walkthrough, or lecture? Add one.
Taxonomy
TopicsDiabetes Management and Research · Diabetes and associated disorders · Hyperglycemia and glycemic control in critically ill and hospitalized patients
Introduction
T1D, as the most common type of glucose metabolism disorder in the pediatric population, remains an enormous challenge for young person, their caregivers and healthcare professionals. The incidence of new-onset T1D in children and adolescents is still rising (1).
Through the decades, the therapy standards have changed, and modern insulin delivery systems are still one of the most promising achievements of contemporary medical technology. In 2025, there is strong evidence that the AID technology changed the everyday lives of children and adolescents with T1D, in terms of maintenance of stable glycemia, as well as in the field of quality of life (2–6). The use of AID technology also created a new reality of well-being for caregivers (7, 8). The difficulties specific to the pediatric population change with the age of the person. Early childhood as well as adolescence seem to be one of the most challenging periods. In the latter, T1D treatment needs to take into account the hormonal changes during puberty, the emotional fluctuations and potential risk behaviours.
We present a 3-year prospective, observational, two-center study, a follow-up of two research studies based on the same pediatric population treated with the MiniMed 780G system, published in 2022 and 2024 (2, 3). The current analysis focused on CGM data and anthropometric data of children with T1D using this AID system for the last 3 years and is the first such extended observation of the use of the MiniMed 780G system in the pediatric age group.
Materials and methods
The Minimed 780G was the first approved AID system in Poland (9). We followed prospectively 50 children with T1D using the MiniMed 780G system, who remained under the care of two pediatric diabetes centers in southern Poland (Department of Children’s Diabetology and Lifestyle Medicine, University Clinical Hospital of the Medical University of Silesia in Katowice and Department of Pediatrics, University Clinical Hospital of the University of Opole). Treatment in both centers follows the same standards of care for children with T1D as per the guidelines of the International Society for Pediatric and Adolescent Diabetes [both are Centers of Reference of SWEET (Better control in Pediatric and Adolescent diabeteS: Working to crEate CEnTers of Reference)] and annually updated guidelines by Diabetes Poland (10). All of the children participating in this study used a sensor-augmented pump with predictive low glucose suspend (SAP-PLGS) before starting the AID system. The inclusion criteria for the observation group were age ≦18 years, more than 70% of the CGM wear and usage time, and more than 70% of time spent in the automatic mode after starting AID (for adequate interpretation of the AID system data). Most of the children used the optimal settings of the MiniMed 780G - active insulin time (AIT) 2 hours and target glucose 100 mg/dl. Age, sex, duration of T1D, body weight and height were for each individual were collected prospectively at several time points: right after AID implementation, then 6, 12, 24 and 36 months afterwards. For each time point, we calculated the BMI z-score using the participant’s weight and height, following the World Health Organization (WHO) reference values (11). We also collected the HbA1c values at the baseline and after 36 months of follow-up. Data from the AID system was automatically sent to the CareLink server and retrieved using CareLink Professional software (Medtronic MiniMed, USA). CGM data were analysed using GlyCulator 3.0 software (thanks to Medical University of Łódź, Poland) (12). Two-week AID data were collected prospectively at the same time points as mentioned above, including average sensor glucose (AvgSG), glucose management indicator (GMI), coefficient of variation (CV), time in range (TIR) 70–180 mg/dl, time in tight range (TITR) 70–140 mg/dl, time above range (TAR) > 250 mg/dl, TAR 180–250 mg/dl, time below range (TBR) 54–70 mg/dl, TBR < 54 mg/dl, total daily insulin (TDI), percentage of insulin boluses and basal insulin, percentage of autocorrection usage, percentage of time using CGM, and percentage of time using SmartGuard. For each variable, the standard descriptive statistics (mean value, standard deviation, and their 95% confidence intervals, range, minimum and maximum values, quartiles, skewness and kurtosis) were estimated. The Lilliefors test was applied to check the normality of distribution within each endpoint. Friedmann’s ANOVA test for repeated measures with Nemenyi post hoc tests were applied to detect changes in time responses. Kendall’s concordance coefficient W was calculated to quantify agreement in time responses across patients and estimate the effect size (13). The Jonckheere-Terpstra test for trend was used to recognise significant linear patterns in time responses. The Benjamini-Hochberg estimates of the false discovery rate (FDR) were calculated to accompany the p-values.
Results
The baseline mean age of the 50 children (24 [48%] boys) was 9.9 ± 2.4 years, and the mean duration of T1D was 3.9 ± 2.56 years. BMI z-scores showed heterogeneous fluctuations over time (W = 0.05), with an upward trend observed during the initial 24-month period (Friedman ANOVA p = 0.043789). The significant increase observed during the first 24 months was subsequently counterbalanced, resulting in values at 36 months that were comparable to baseline (p = 0.818202) (Figure 1).
The BMI Z-scores.
TITR increased after AID system implementation, reaching a peak after 6 months (60.82% ± 9.34%; Friedman ANOVA p = 0.000001, FDR < 0.000001), followed by a decrease to 56.50% ± 10.78% after 3 years (p = 0.079950) (Figure 2).
The TITR (time in tight range) 70–140 mg/dl [%]. Figures 1–4. The boxplots for the CGM data, BMI Z-score and TDI values before the implementation of the system, 2 weeks after the initiation of the AID system (Minimed 780G), and after 6, 12, 24 and 36 months of follow-up. The data after 3 years were compared to the previous values after 1 and 2 years of observation, which were presented by Seget S. et al. (3)(4).
TIR changed significantly over the 3-year observation period (Friedman ANOVA p = 0.000001, W = 0.14, FDR = 0.000002). The value at 36 months (77.74% ± 7.65%) was significantly lower than the peak value observed at 6 months (81.16% ± 7.83%; p = 0.030933) (Figure 3). Both TIR and TITR demonstrated statistically significant improvement over the first 2 years compared with baseline values (p < 0.05).
The TIR (time in range) 70–180 mg/dl [%].
In addition, a statistically significant downward trend was observed for both TBR categories (Friedman ANOVA p < 0.05, FDR < 0.05). Baseline TBR values of 1.11% ± 1.07% for glucose <54 mg/dL and 4.15% ± 2.70% for glucose 54–70 mg/dL decreased significantly to 0.49% ± 0.52% and 2.50% ± 1.69%, respectively.
An unfavorable increase in TAR was observed during the final observation period. Both TAR 180–250 mg/dL and TAR >250 mg/dL reached values at 36 months comparable to those observed before initiation of AID therapy (p > 0.05). The time spent in the 180–250 mg/dL range increased significantly after 3 years compared with values after 1 year (p < 0.05). Additionally, the time spent at glucose levels >250 mg/dL showed a significant increase after 3 years of AID use compared with the periods after the first 2 weeks and after 1 year (p < 0.05).
Concurrently, a consistent and significant increase was observed in the proportion of auto-correction within the total daily insulin (TDI) dose (Friedman ANOVA p < 0.000001, FDR < 0.000001) (Figure 4). Despite changes in most parameters over time, the CV remained unchanged (Friedman ANOVA p = 0.238656, FDR = 0.238655) (Figure 5).
The autocorrection usage [%].
The coefficient of variation (CV) [%].
A significant increase in sensor usage was observed from baseline throughout the 3 years of AID therapy (Friedman ANOVA p < 0.000001, FDR < 0.000001).
TDI (U/kg) after 2 weeks of AID usage was comparable to the baseline values (0.69 ± 0.19 vs. 0.67 ± 0.20, p > 0.05), then it starts to increase, and according to the baseline it was statistically significant change in TDI value after 3 years of observation (0.69 ± 0.19 vs. 0.84 ± 0.22, p<0.01). (Figure 6).
The TDI [U/kg].
The summarized data are presented in Table 1.
Discussion
The current study supports and adds interesting data to the former results of the previous observations of this group of children - after 12 and 24 months of using the AHCL system (2, 3).
Although TIR and TITR decreased slightly after the third year of observation, TIR and TITR remained in recommended ranges. The change in TIR was not associated with an increase in hypoglycemia, as both TBR 54–70 mg/dl and < 54 mg/dl values remained low. Both TARs increased in comparison to the previous time points after the initiation of the system, and it was correlated with a stable CV value and increase in AID usage time.
The TITR (70–140 mg/dl) is an emerging CGM parameter and was identified as an independent risk factor for the occurrence of acute and chronic complications of T1D (14–17). The association between TIR and TITR was shown to be nonlinear. TITR seems to better reflect the changes in CV and AvgSG in case of lower HbA1c values (18, 19).
Similar outcomes were presented in the study of 100,000 individuals treated with Minimed 780G in automatic mode. The authors observed a slight decrease in TIR over 12 months of the AID use (75.5% in the first month, vs. 73.3% in the next 12 months) (20). Interestingly, this decrease in our studied group occurred much later, in the third and not in the first year of AID use.
These findings could be attributed to several factors. People may become accustomed to the pump’s increased support in diabetes management and the “novelty effect” wearing off over time. Another issue could be the decrease in adherence to the orders of caregivers, which is commonly observed in the teenage group. The mentioned insights can be upheld by another crucial observation in the study. The percentage of auto-correction dose in TDI dose increased significantly with time of our observation. This shows that the children and their caregivers relied with time more on the AID system, but on the other hand, the users made less aware therapeutic decisions in their day-to-day life. Other data support the thesis that the use of autocorrection in the MiniMed 780G system allows a less restrictive adherence to the therapy (21).
Children setting out puberty can be less scrupulous in daily actions like carbohydrate counting or even entering carbs into the system. Carbohydrate counting is perceived as one of the most burdensome tasks in T1D and is frequently done inconsistently and with poor accuracy (22). It was shown that meal announcement by using a preset of three personalised fixed-carbohydrate amounts is a valuable alternative to the conventional carbohydrate counting and allows achieving international glycemic targets by most adolescents. Additionally, increasing age of the person with T1D was associated with more insulin delivered by autocorrection boluses due to fewer reported meals, more underestimated reported carbohydrates, and more possible changes in the amount of carbohydrates consumed (23). In the described group of age (mean age of studied participants was 9.9 ± 2.4 years) every simplification in insulin therapy which can lead to remaining optimal glycemic management seems to be helpful.
The dietary habits in children entering puberty change and the parental supervision decreases. Teenagers are prone to stick to an unbalanced diet based on high calories consumption from solid fats, added sugars and alcoholic beverages, also a significant decrease in the amount of consumed fruit and vegetables. Skipping meals is also a common behaviour. Unhealthy eating habits are associated with risky behaviors in adolescence, which can be an additional factor leading to deterioration of the glycemic outcomes (24). Studies highlight the need for parental involvement for improving glycemic outcomes, adherence to the recommended regimen, and the practice of self-management in adolescents with T1D (25).
Most of our study group entered adolescence during the 3rd year of observation. The decrease in TIR after 36 months compared to the values from the first year could result also from the physiological adversities related to puberty, such as insulin resistance (26–28).
To the best of our knowledge, this study is the first such long-term observation of children with T1D using the Minimed 780G system. The glycemic outcomes at baseline were satisfactory and quite homogenous within this group. The lack of data about the pubertal status of the investigated group of children is one of the limitations of the study. Other limitations include the lack of assessment of potential changes in dietary habits, the degree of independence in making therapeutic decisions, and the level of caregivers’ involvement in diabetes management throughout the observation time. Another limitation is a lack of patient-reported outcomes.
Conclusions
The children and adolescents with T1D followed for 3 years while using the MiniMed 780G system, despite entering puberty, maintained recommended glycemic outcomes. Sustaining high TIR and TITR, with CV values in the recommended target, was accompanied by an increase of the percentage of auto-correction. It shows that throughout the observation period the users relied increasingly on the algorithm.
The reference list from the paper itself. Each links out to its DOI / PubMed record.
- 1Patterson CC Harjutsalo V Rosenbauer J Neu A Cinek O Skrivarhaug T . Trends and cyclical variation in the incidence of childhood type 1 diabetes in 26 European centres in the 25 year period 1989-2013: a multicentre prospective registration study. Diabetologia. (2019) 62:408–17. doi: 10.1007/s 00125-018-4763-3, PMID: 30483858 · doi ↗ · pubmed ↗
- 2Seget S Jarosz-Chobot P Ochab A Polanska J Rusak E Witoszek P . Body mass index, basal insulin and glycemic control in children with type 1 diabetes treated with the advanced hybrid closed loop system remain stable - 1-year prospective, observational, two-center study. Front Endocrinol (Lausanne). (2022) 13:1036808. doi: 10.3389/fendo.2022.1036808, PMID: 36303875 PMC 9592809 · doi ↗ · pubmed ↗
- 3Seget S Chobot A Tarasiewicz M Bielawska A Rusak E Ochab A . Glycemic control in children with type 1 diabetes treated with the advanced hybrid closed loop system 2-year prospective, observational, two-center study. Front Endocrinol. (2024) 15:1332418. doi: 10.3389/fendo.2024.1332418, PMID: 38390211 PMC 10882083 · doi ↗ · pubmed ↗
- 4Seget S Chobot A Rusak E Ochab A Bielawska A Polanska J . Mini Med 780GTM in children with type 1 diabetes under seven years of age: Prospective open-label, single-arm, double-center, follow-up study. Technol Health Care. (2024) 32:1463–72. doi: 10.3233/THC-230490, PMID: 37781828 · doi ↗ · pubmed ↗
- 5Jalilova A Pilan BŞ Demir G Özbaran B BalkıHG Arslan E . The psychosocial outcomes of advanced hybrid closed-loop system in children and adolescents with type 1 diabetes. Eur J Pediatr. (2024) 183:3095–103. doi: 10.1007/s 00431-024-05551-1, PMID: 38661816 PMC 11192657 · doi ↗ · pubmed ↗
- 6Wheeler BJ Collyns OJ Meier RA Betts ZL Frampton C Frewen CM . Improved technology satisfaction and sleep quality with Medtronic Mini Med® Advanced Hybrid Closed-Loop delivery compared to predictive low glucose suspend in people with Type 1 Diabetes in a randomized crossover trial. Acta Diabetol. (2022) 59:31–7. doi: 10.1007/s 00592-021-01789-5, PMID: 34453208 · doi ↗ · pubmed ↗
- 7Lai ST Styles SE Boucsein A Zhou Y Michaels V Jefferies C . Parental perspectives following the implementation of advanced hybrid closed-loop therapy in children and adolescents with type 1 diabetes and elevated glycaemia. Diabetes Med. (2025) 42:e 15448. doi: 10.1111/dme.15448, PMID: 39587412 PMC 11823305 · doi ↗ · pubmed ↗
- 8Knoll C Schipp J O’Donnell S Wäldchen M Ballhausen H Cleal B . Quality of life and psychological well-being among children and adolescents with diabetes and their caregivers using open-source automated insulin delivery systems: Findings from a multinational survey. Diabetes Res Clin Pract. (2023) 196:110153. doi: 10.1016/j.diabres.2022.110153, PMID: 36423699 · doi ↗ · pubmed ↗