Nomogram-based prediction models for clinical outcomes in pediatric RUNX1::RUNX1T1-positive acute myeloid leukemia: a retrospective analysis from AML-CAMS serial trials
Xiaoli Chen, Luyang Zhang, Yangyang Zheng, Tianyuan Hu, Meihui Yi, Ye Guo, Xiaojuan Chen, Yumei Chen, Yao Zou, Li Zhang, Wenyu Yang, Yingchi Zhang, Min Ruan, Xiaofan Zhu

TL;DR
This study developed and validated prediction models to assess survival and relapse risks in children with a specific type of leukemia, aiming to improve personalized treatment decisions.
Contribution
The study introduces novel nomogram-based prediction models for 3-year outcomes in pediatric RUNX1::RUNX1T1-positive AML patients.
Findings
Nomograms incorporating MRD status, treatment regimen, and WBC group effectively predicted overall survival.
Additional factors like BM blasts and extramedullary infiltration improved relapse-free survival predictions.
The nomograms showed strong discrimination and calibration, outperforming single predictors.
Abstract
To identify prognostic factors and develop nomograms predicting short-term mortality and relapse in pediatric RUNX1::RUNX1T1-positive AML, thereby enabling individualized risk assessment and optimizing clinical management. We retrospectively analyzed 136 pediatric patients with RUNX1::RUNX1T1-positive AML who achieved morphologic complete remission (CR) after one induction course under AML-CAMS-2009 or AML-CAMS-2016 regimen. Least absolute shrinkage and selection operator (LASSO) and multivariable Cox regression identified independent predictors of 3-year overall survival (OS) and relapse-free survival (RFS). Nomograms were built from these predictors. Model performance was assessed by time-dependent receiver operating characteristic (ROC) curves, calibration plots, decision curve analysis (DCA), and concordance index (C-index), with internal validation performed by bootstrap…
Genes, proteins, chemicals, diseases, species, mutations and cell lines named across the full text — each resolved to its canonical identifier and authoritative record.
Click any figure to enlarge with its caption.
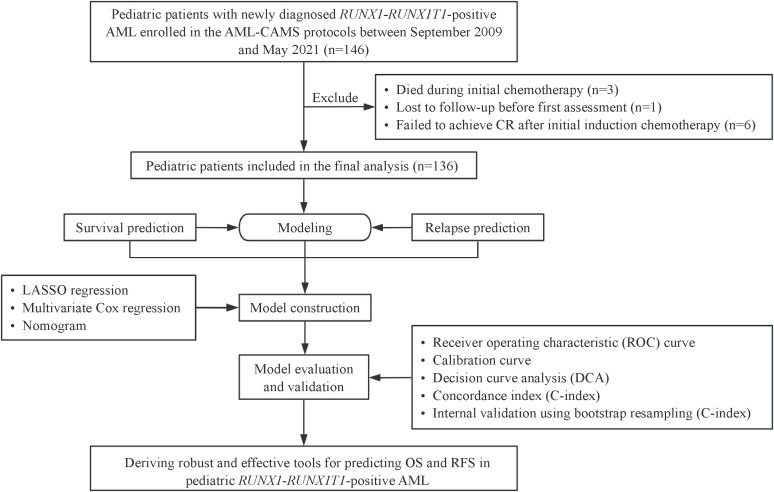 Figure 1
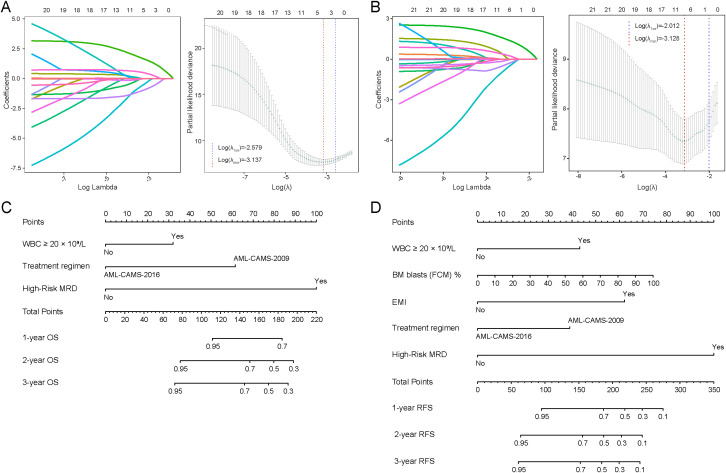 Figure 2
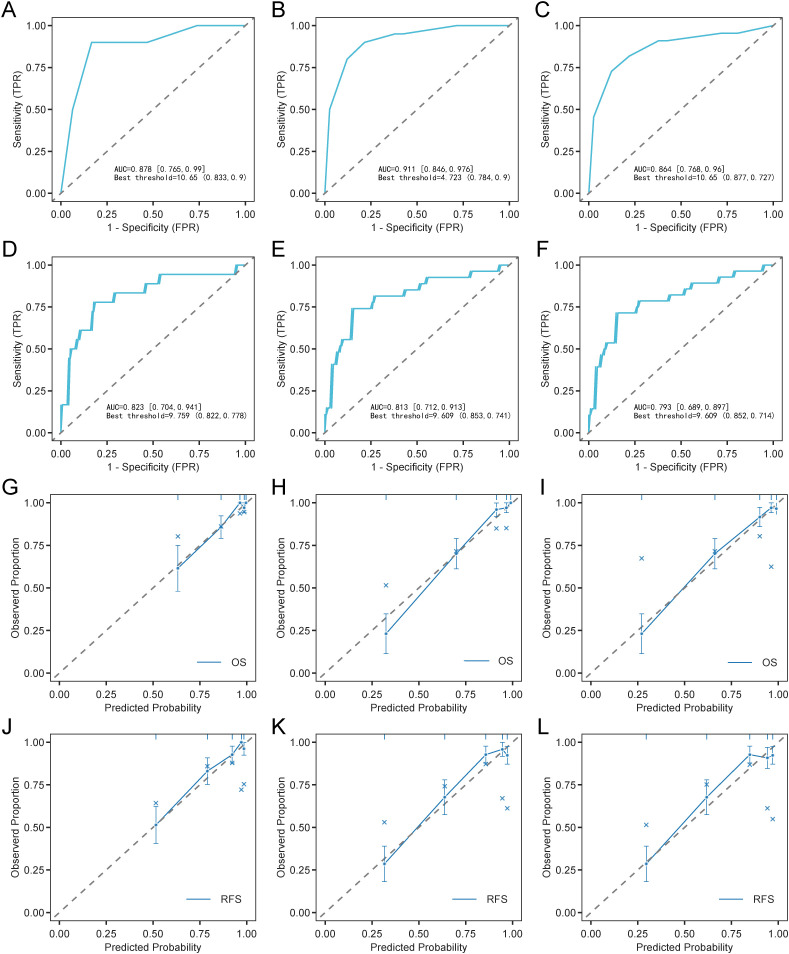 Figure 3
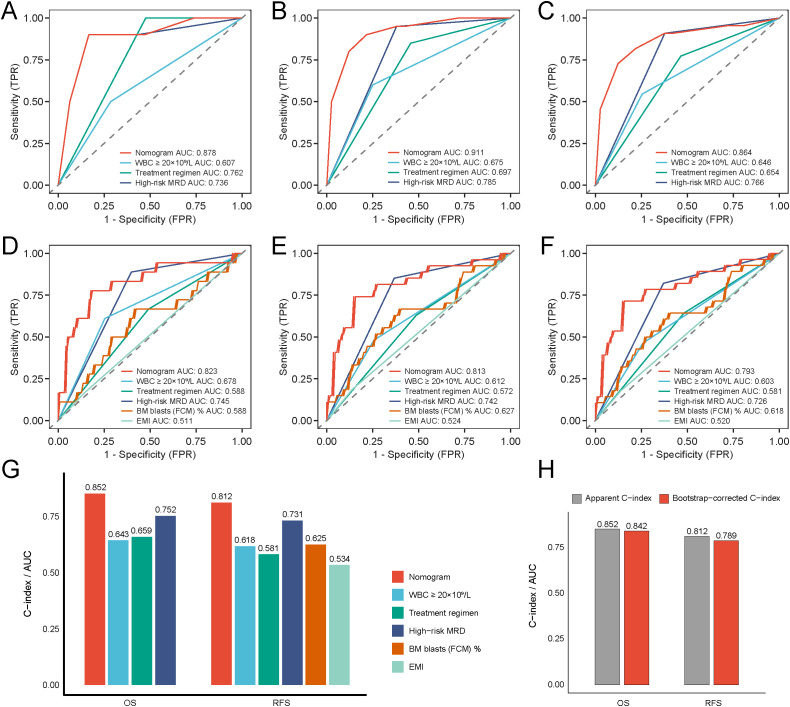 Figure 4
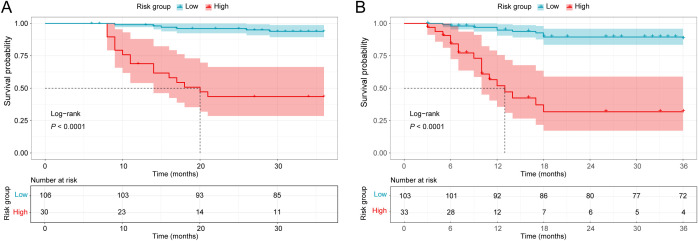 Figure 5
| Characteristics | Total (n = 136) | OS | RFS | ||||
|---|---|---|---|---|---|---|---|
| Alive ( | Dead (n = 22) | P value | Relapse-free ( | Relapsed (n = 28) | P value | ||
| Age, y | 8.00 (6.00 - 11.00) | 8.00 (6.00 - 11.00) | 8.00 (6.00 - 10.00) | 0.535 | 8.00 (6.00 - 11.00) | 8.50 (6.00 - 10.00) | 0.588 |
| Sex | 0.111 | 0.091 | |||||
| Male | 78.00 (57.35%) | 62.00 (54.39%) | 16.00 (72.73%) | 58.00 (53.70%) | 20.00 (71.43%) | ||
| Female | 58.00 (42.65%) | 52.00 (45.61%) | 6.00 (27.27%) | 50.00 (46.30%) | 8.00 (28.57%) | ||
| WBC, ×10⁹/L | 13.51 (7.43 - 23.11) | 11.83 (7.33 - 20.07) | 22.31 (14.59 - 32.40) | 0.325 | 12.43 (7.31 - 20.15) | 18.14 (9.77 - 29.70) | 0.664 |
| WBC group | 0.006 | 0.035 | |||||
| <20×10⁹/L | 95.00 (69.85%) | 85.00 (74.56%) | 10.00 (45.45%) | 80.00 (74.07%) | 15.00 (53.57%) | ||
| ≥20×10⁹/L | 41.00 (30.15%) | 29.00 (25.44%) | 12.00 (54.55%) | 28.00 (25.93%) | 13.00 (46.43%) | ||
| Hemoglobin, g/L | 80.50 (65.00 - 94.00) | 81.50 (65.00 - 94.00) | 76.50 (60.00 - 94.00) | 0.297 | 80.50 (65.00 - 93.50) | 80.00 (60.00 - 94.50) | 0.614 |
| Platelet, ×10⁹/L | 44.00 (23.50 - 67.00) | 45.00 (25.00 - 72.00) | 39.00 (19.00 - 65.00) | 0.204 | 44.50 (25.00 - 73.00) | 42.50 (20.50 - 60.50) | 0.152 |
| LDH, U/L | 528.00 (350.75 - 949.50) | 506.00 (337.00 - 930.00) | 756.50 (411.00 - 1,412.00) | 0.187 | 506.00 (337.00 - 924.50) | 756.50 (416.00 - 1,028.00) | 0.271 |
| BM blasts (Morph) % | 60.00 (47.75 - 75.50) | 59.75 (48.50 - 75.00) | 71.25 (43.00 - 80.00) | 0.814 | 59.75 (48.75 - 74.00) | 64.00 (43.50 - 86.00) | 0.630 |
| BM blasts (FCM) % | 36.75 (19.85 - 60.15) | 34.78 (18.70 - 57.10) | 54.40 (20.92 - 68.50) | 0.043 | 34.78 (17.45 - 56.75) | 52.77 (20.99 - 67.85) | 0.052 |
| EMI | 0.615 | 0.597 | |||||
| No | 116.00 (85.29%) | 98.00 (85.96%) | 18.00 (81.82%) | 93.00 (86.11%) | 23.00 (82.14%) | ||
| Yes | 20.00 (14.71%) | 16.00 (14.04%) | 4.00 (18.18%) | 15.00 (13.89%) | 5.00 (17.86%) | ||
| Complex karyotype | 0.372 | 0.301 | |||||
| No | 132.00 (97.06%) | 110.00 (96.49%) | 22.00 (100.00%) | 104.00 (96.30%) | 28.00 (100.00%) | ||
| Yes | 4.00 (2.94%) | 4.00 (3.51%) | 0.00 (0.00%) | 4.00 (3.70%) | 0.00 (0.00%) | ||
| X chromosome monosomy | 0.597 | 0.336 | |||||
| No | 119.00 (87.50%) | 99.00 (86.84%) | 20.00 (90.91%) | 93.00 (86.11%) | 26.00 (92.86%) | ||
| Yes | 17.00 (12.50%) | 15.00 (13.16%) | 2.00 (9.09%) | 15.00 (13.89%) | 2.00 (7.14%) | ||
| Y chromosome monosomy | 0.953 | 0.379 | |||||
| No | 92.00 (67.65%) | 77.00 (67.54%) | 15.00 (68.18%) | 75.00 (69.44%) | 17.00 (60.71%) | ||
| Yes | 44.00 (32.35%) | 37.00 (32.46%) | 7.00 (31.82%) | 33.00 (30.56%) | 11.00 (39.29%) | ||
| 9 chromosome monosomy | 0.317 | 0.246 | |||||
| No | 131.00 (96.32%) | 109.00 (95.61%) | 22.00 (100.00%) | 103.00 (95.37%) | 28.00 (100.00%) | ||
| Yes | 5.00 (3.68%) | 5.00 (4.39%) | 0.00 (0.00%) | 5.00 (4.63%) | 0.00 (0.00%) | ||
| Any monosomy | 0.528 | 0.940 | |||||
| No | 73.00 (53.68%) | 60.00 (52.63%) | 13.00 (59.09%) | 58.00 (53.70%) | 15.00 (53.57%) | ||
| Yes | 63.00 (46.32%) | 54.00 (47.37%) | 9.00 (40.91%) | 50.00 (46.30%) | 13.00 (46.43%) | ||
| 0.409 | 0.359 | ||||||
| No | 82.00 (60.29%) | 67.00 (58.77%) | 15.00 (68.18%) | 63.00 (58.33%) | 19.00 (67.86%) | ||
| Yes | 54.00 (39.71%) | 47.00 (41.23%) | 7.00 (31.82%) | 45.00 (41.67%) | 9.00 (32.14%) | ||
| 0.653 | 0.356 | ||||||
| No | 87.00 (63.97%) | 72.00 (63.16%) | 15.00 (68.18%) | 67.00 (62.04%) | 20.00 (71.43%) | ||
| Yes | 49.00 (36.03%) | 42.00 (36.84%) | 7.00 (31.82%) | 41.00 (37.96%) | 8.00 (28.57%) | ||
| 0.228 | 0.351 | ||||||
| No | 106.00 (77.94%) | 91.00 (79.82%) | 15.00 (68.18%) | 86.00 (79.63%) | 20.00 (71.43%) | ||
| Yes | 30.00 (22.06%) | 23.00 (20.18%) | 7.00 (31.82%) | 22.00 (20.37%) | 8.00 (28.57%) | ||
| 0.923 | 0.427 | ||||||
| No | 104.00 (76.47%) | 87.00 (76.32%) | 17.00 (77.27%) | 81.00 (75.00%) | 23.00 (82.14%) | ||
| Yes | 32.00 (23.53%) | 27.00 (23.68%) | 5.00 (22.73%) | 27.00 (25.00%) | 5.00 (17.86%) | ||
| 0.712 | 0.766 | ||||||
| No | 109.00 (80.15%) | 92.00 (80.70%) | 17.00 (77.27%) | 86.00 (79.63%) | 23.00 (82.14%) | ||
| Yes | 27.00 (19.85%) | 22.00 (19.30%) | 5.00 (22.73%) | 22.00 (20.37%) | 5.00 (17.86%) | ||
| 0.111 | 0.065 | ||||||
| No | 124.00 (91.18%) | 102.00 (89.47%) | 22.00 (100.00%) | 96.00 (88.89%) | 28.00 (100.00%) | ||
| Yes | 12.00 (8.82%) | 12.00 (10.53%) | 0.00 (0.00%) | 12.00 (11.11%) | 0.00 (0.00%) | ||
| HSCT | 0.952 | 0.039 | |||||
| No | 118.00 (86.76%) | 99.00 (86.84%) | 19.00 (86.36%) | 97.00 (89.81%) | 21.00 (75.00%) | ||
| Yes | 18.00 (13.24%) | 15.00 (13.16%) | 3.00 (13.64%) | 11.00 (10.19%) | 7.00 (25.00%) | ||
| Treatment regimen | 0.008 | 0.128 | |||||
| AML-CAMS-2009 | 70.00 (51.47%) | 53.00 (46.49%) | 17.00 (77.27%) | 52.00 (48.15%) | 18.00 (64.29%) | ||
| AML-CAMS-2016 | 66.00 (48.53%) | 61.00 (53.51%) | 5.00 (22.73%) | 56.00 (51.85%) | 10.00 (35.71%) | ||
| High-Risk MRD | <0.001 | <0.001 | |||||
| No | 73.00 (53.68%) | 71.00 (62.28%) | 2.00 (9.09%) | 68.00 (62.96%) | 5.00 (17.86%) | ||
| Yes | 63.00 (46.32%) | 43.00 (37.72%) | 20.00 (90.91%) | 40.00 (37.04%) | 23.00 (82.14%) | ||
| Characteristic | OS | RFS | ||
|---|---|---|---|---|
| HR (95% CI) | P value | HR (95% CI) | P value | |
| Sex | ||||
| Male | Reference | |||
| Female | 0.522 (0.215–1.265) | 0.150 | ||
| BM blasts (FCM) % | 1.016 (0.996, 1.035) | 0.111 | 1.018 (1.001–1.036) |
|
| EMI | ||||
| No | Reference | |||
| Yes | 5.148 (1.663–15.938) |
| ||
| High-Risk MRD | ||||
| No | Reference | Reference | ||
| Yes | 13.983 (3.188, 61.341) |
| 9.633 (3.428–27.073) |
|
| No | Reference | Reference | ||
| Yes | 0 (0, Inf) | 0.998 | 0 (0, Inf) | 0.998 |
| Treatment regimen | ||||
| AML-CAMS-2009 | Reference | Reference | ||
| AML-CAMS-2016 | 0.172 (0.061, 0.479) |
| 0.343 (0.144–0.819) |
|
| WBC group | ||||
| <20×10⁹/L | Reference | Reference | ||
| ≥20×10⁹/L | 2.928 (1.166, 7.354) |
| 2.553 (1.167–5.586) |
|
Peer Reviews
No public reviews on file for this paper yet. If you reviewed it on a platform where reviews are public (OpenReview, ICLR, NeurIPS, ICML), you can paste yours below so the community can read it here.
Videos
No videos yet. Explain this paper in a talk, walkthrough, or lecture? Add one.
Taxonomy
TopicsAcute Myeloid Leukemia Research · Genomics and Rare Diseases · Acute Lymphoblastic Leukemia research
Introduction
1
Acute myeloid leukemia (AML) is a clonal hematologic disorder characterized by uncontrolled proliferation and arrested differentiation of myeloid precursors, leading to cytopenias and bone marrow failure (1, 2). Although AML predominantly affects older adults, pediatric incidence is relatively low, with an estimated incidence of seven per million children annually (3, 4). The t (8,21)(q22;q22)/RUNX1::RUNX1T1 fusion—generated by translocation between RUNX1 (21q22) and RUNX1T1 (8q22)—is the most frequent cytogenetic abnormality in AML (5), accounting for 10–15% of pediatric cases (6). This subtype is chemo-sensitive with overall favorable outcomes (4, 7); however, only 45-70% of patients remain disease-free long-term and approximately 30% relapse, making relapse the leading cause of treatment failure and death (8, 9).
Early post-remission identification of patients at high risk for relapse is therefore critical for optimizing consolidation and maintenance strategies. Prior studies have evaluated prognostic factors—age, initial WBC count, bone marrow blast burden, and measurable residual disease (MRD) —with inconsistent findings in children (10–13). We previously showed that a reduction in RUNX1::RUNX1T1 transcript levels of less than three logs after induction therapy, together with MRD ≥0.01% after two consolidations, independently predicted inferior RFS (RFS; HR = 4.230, P = 0.016) and overall survival (OS; HR = 5.128, P = 0.045) (14). However, previous pediatric studies in this subtype have often been limited by relatively small cohort sizes, heterogeneous endpoints and follow-up durations, and variability in MRD methodologies and treatment strategies across institutions and time periods. Consequently, many reports have focused on identifying individual prognostic factors rather than delivering a clinically deployable prediction model. These gaps underscore the rationale for developing the present nomograms to predict outcomes using routinely available clinical variables and standardized response metrics in pediatric RUNX1::RUNX1T1-positive AML. Published evidence indicates that patients who achieve an initial complete remission are unlikely to relapse after three years of sustained remission (15). Consistently, among patients who remained in remission for ≥36 months, the cumulative incidence of relapse at 60 months was reported to be 8%, and relative survival after 3 years in remission was comparable to that of a matched general population (16). Given the clinical decision-making relevance and practical actionability of a 3-year endpoint, we selected it as the primary time horizon for risk assessment and developed nomogram-based models integrating routinely available clinical indicators to predict OS and RFS in this population.
Materials and methods
2
Study population and treatment regimens
2.1
We retrospectively identified consecutive children with de novo RUNX1::RUNX1T1-positive AML diagnosed between September 2009 and May 2021 and treated on AML-CAMS serial trials at the Pediatric Blood Disease Center, Blood Diseases Hospital, Chinese Academy of Medical Sciences (CAMS). In total, 146 patients received treatment under AML-CAMS-2009 (NCT03165851) or AML-CAMS-2016 (NCT03173612) protocols. After excluding induction deaths (n = 3), loss to follow-up before the initial assessment (n = 1), and induction refractory disease (n = 6), 136 patients achieving morphological CR after one induction course were included (Figure 1).
Flowchart illustrating patient screening and the overall study design.
Both protocols used induction followed by high-dose cytarabine-based consolidation. Regimen assignment was primarily determined by protocol availability during the corresponding trial period based on the calendar time of diagnosis and enrollment, rather than concurrent allocation within the same time period. AML-CAMS-2009 regimen comprised five consolidation cycles; AML-CAMS-2016 used four cycles with reduced-intensity chemotherapy plus dasatinib. Regimen details were reported previously (14, 17). This study was approved by the Institutional Ethics Committee of the Blood Diseases Hospital, CAMS, and performed in compliance with the Declaration of Helsinki. Written informed consent was obtained from guardians. Data were abstracted from existing records and anonymized before analysis.
Clinical variables
2.2
Candidate covariates were prespecified a priori based on published evidence and biological plausibility in pediatric RUNX1::RUNX1T1-positive AML, with an emphasis on clinical relevance and routine availability at diagnosis and early treatment response. Variables were additionally constrained by data completeness and quality in our cohort. We reviewed baseline demographics (age, sex), peripheral blood counts at diagnosis (WBC, hemoglobin, and platelets), presence of extramedullary infiltration (EMI), treatment regimen, and transplantation status. Laboratory and molecular data included RUNX1::RUNX1T1 transcript quantification by real-time quantitative polymerase chain reaction (RT-qPCR) at diagnosis and subsequent time points, cytogenetics, and KIT mutations (14). “High-Risk MRD” was defined as <3-log transcript reduction in RUNX1::RUNX1T1 after induction and MRD ≥0.01% after two consolidations (14). This combined criterion was prespecified based on our published AML-CAMS MRD dynamics study, in which it was independently associated with inferior RFS and OS (14), and it was also included as a covariate in the prognostic modeling. To more comprehensively capture baseline disease burden and biologically relevant factors potentially associated with clinical outcomes, we additionally incorporated baseline bone marrow (BM) blasts by morphology (BM blasts [Morph]), BM blasts by flow cytometry (BM blasts [FCM]), lactate dehydrogenase (LDH) levels, and RAS-pathway mutations.
Conventional cytogenetic karyotyping and fluorescence in situ hybridization (FISH) were routinely performed to screen for and rapidly confirm the t (8,21)(q22;q22) translocation at diagnosis. RT-qPCR was used for baseline quantification of the RUNX1::RUNX1T1 fusion transcript and for subsequent response assessment and molecular MRD monitoring. A standardized RT-qPCR protocol was implemented. RNA was prepared from BM mononuclear cells, using fresh specimens from AML-CAML-2016 and cryopreserved specimens from AML-CAML-2009, and then reverse-transcribed into cDNA. Quantification of RUNX1::RUNX1T1 was performed with a TaqMan probe system, with ABL serving as the internal reference. Assays were accepted only when ABL exceeded 1 × 10^5 copies. The assay sensitivity reached 10 copies per reaction, and transcript levels were presented as the RUNX1::RUNX1T1-to-ABL copy-number ratio. All molecular analyses were performed in an accredited reference laboratory following standardized protocols. A complex karyotype indicated ≥2 additional clonal chromosomal abnormalities alongside t (8,21). KIT and RAS pathway mutations were identified by first- or next-generation sequencing in BM.
Follow-up and endpoints
2.3
Patients were followed by visits, phone contact, and electronic records. BM aspiration was performed before each chemotherapy course to evaluate treatment response. CR was characterized by <5% blasts in bone marrow smears, no Auer rod, no circulating or extramedullary disease, absolute neutrophil ≥1.0 × 10⁹/L, and platelet count ≥100 × 10⁹/L.
Given the rarity of relapse beyond three years, the observation window was set at three years (15). OS was measured from diagnosis to death due to any cause or last follow-up within this period. RFS was measured from the date of CR to relapse, death, or last follow-up within the same timeframe. Relapse was defined as ≥5% BM blasts (excluding post-chemotherapy regeneration), recurrence of leukemic cells in peripheral blood, or extramedullary infiltration confirmed by morphological or cytogenetic examination.
Statistical analyses
2.4
Continuous variables were presented as medians with interquartile ranges (IQRs), and categorical variables were reported as frequencies and proportions. Variables with <10% missingness (excluding outcomes/follow-up) were imputed using the random forest algorithm (mice package, R). Clinical, MICM (morphology, immunophenotyping, cytogenetics, and molecular biology), and treatment variables were analyzed by the least absolute shrinkage and selection operator (LASSO) regression, with optimal penalty parameter (λ) determined by ten-fold cross-validation. Selected variables entered multivariate Cox regression to identify independent prognostic factors, based on which nomograms predicting 1-, 2-, and 3-year OS and RFS were constructed. Model performance was evaluated using receiver operating characteristic (ROC) curves, calibration plots, decision curve analysis (DCA), and concordance index (C-index). Internal validation was performed using 500 bootstrap resamples. Risk scores derived from the nomogram were calculated, and optimal cutoffs identified via X-tile (v3.6.1) to classify patients into high- and low-risk groups. Survival differences were compared using Kaplan-Meier and log-rank tests. In the survival analyses, HSCT was not treated as a censoring event. Patients were followed from diagnosis to the predefined endpoints regardless of HSCT, and relapse or death occurring after HSCT was counted as an event for RFS or OS, respectively. All statistical analyses were conducted using R software (version 4.3.0), and statistical significance was defined as a two-tailed P value below 0.05.
Results
3
Cohort characteristics
3.1
A total of 136 pediatric patients diagnosed with RUNX1::RUNX1T1-positive AML who achieved CR following one course of induction chemotherapy were enrolled in the study. In this cohort, the earliest death occurred 8 months after diagnosis; no induction-related deaths were observed within the first 30 or 60 days after diagnosis. The median diagnostic age was 8 years (IQR, 6–11), and 57.35% were male. During follow-up, 22 patients (16.2%) died and 28 patients (20.6%) relapsed (Table 1).
At diagnosis, the median WBC count was 13.51×10⁹/L (IQR, 7.43–23.11). Mortality was higher in patients with WBC ≥20×10⁹/L than in those with WBC <20×10⁹/L (54.55% vs 25.44%; P = 0.006). Consistently, a greater proportion of relapsed patients had WBC ≥20×10⁹/L at diagnosis compared with non-relapsed patients (46.43% vs 25.93%; P = 0.035). When stratified by diagnostic WBC, relapse occurred more frequently in the WBC ≥20×10⁹/L group (13/41, 31.71%) than in the WBC <20×10⁹/L group (15/95, 15.79%) (Supplementary Table 1). Moreover, among patients who relapsed, post-relapse mortality was higher in the WBC ≥20×10⁹/L group than in the WBC <20×10⁹/L group (Supplementary Figure 1). No significant intergroup differences were observed for hemoglobin, platelet count, LDH levels, or BM blasts (Morph). Cytogenetic abnormalities included complex karyotype (2.94%), monosomy X (12.50%), monosomy Y (32.35%), and any monosomy (loss of X, Y, or chromosome 9, 46.32%) without significant differences between survival or relapse groups. KIT, NRAS, and KRAS mutations were detected in 39.71%, 19.85%, and 8.82% of patients, respectively, with no prognostic significance (all P>0.05). Similarly, no marked difference was observed in the frequencies of KIT exon 17 or KIT p.D816 mutations among groups. Of the entire cohort, 18 patients (13.2%) underwent allogeneic hematopoietic stem cell transplantation (allo-HSCT), with comparable frequencies between survivors and non-survivors (13.16% vs. 13.64%; P>0.05). Additional clinical characteristics of HSCT recipients and HSCT-related details, including indications and timing, are summarized to document real-world HSCT practice in our cohort (Supplementary Tables 2, 3). Treatment regimen and MRD status were key prognostic indicators. The AML-CAMS-2016 regimen was used significantly more often among survivors than non-survivors (53.51% vs. 22.73%; P<0.008), but the difference was not significant between relapse-free and relapsed patients (51.85% vs. 35.71%; P = 0.128). High-Risk MRD was markedly more prevalent in non-survivors vs survivors (90.91% vs. 37.72%; P<0.001) and in relapsed versus relapse-free patients (82.14% vs. 37.04%; P<0.001) (Table 1).
Variable selection and nomogram construction
3.2
Based on LASSO regression analysis, key clinical variables associated with OS and RFS in pediatric RUNX1::RUNX1T1-positive AML cases were identified. LASSO algorithm with an L1 penalty was employed for variable selection, effectively shrinking the coefficients of non-significant variables to zero, thus eliminating those with minimal contribution to survival prediction. For OS, BM blasts (FCM) %, High-Risk MRD (No/Yes), KRAS mutation (No/Yes), treatment regimen (AML-CAMS-2009 vs. AML-CAMS-2016), and WBC group (<20×10⁹/L vs. ≥20×10⁹/L) were selected at λmin (Figure 2A). Multivariate Cox analysis confirmed High-Risk MRD, treatment regimen, and WBC group as independent prognostic indicators for OS (Table 2), forming the basis of a 1-, 2-, and 3-year OS nomogram (Figure 2C). Similarly, the λ min for RFS via LASSO regression selected the following key variables: sex (male vs. female), BM blasts (FCM) %, EMI (No/Yes), High-Risk MRD (No/Yes), KRAS mutation (No/Yes), treatment regimen (AML-CAMS-2009 vs. AML-CAMS-2016), and WBC group (<20×10⁹/L vs. ≥20×10⁹/L) (Figure 2B). Multivariate Cox regression analysis indicated that BM blasts (FCM), EMI, High-Risk MRD, treatment regimen, and WBC group were independent prognostic factors for RFS in pediatric t (8,21) AML patients (Table 2). A nomogram model for 1-year, 2-year, and 3-year RFS was developed and visualized (Figure 2D).
Variable selection using LASSO regression and construction of prognostic nomograms for OS and RFS. LASSO regression coefficient profiles of variables and tuning of the optimal penalty parameter (λ) using ten-fold cross-validation for OS (A) and RFS (B). Nomogram for predicting 1-, 2-, and 3-year OS (C) and RFS (D) in pediatric patients with RUNX1-RUNX1T1-positive-AML. LASSO, least absolute shrinkage and selection operator; λ1se, λ under the one-standard-error rule; λmin, λ at minimum cross-validation error.
In the established nomogram, each category of the prognostic variables was assigned a weighted score proportional to its relative contribution to survival outcomes. The total score, obtained by summing individual points, corresponded to the estimated 1-, 2-, or 3-year OS or RFS probability. A higher total score corresponds to an increased risk and poorer prognosis.
Performance and internal validation
3.3
Nomogram performance was systematically evaluated for discrimination, calibration, and clinical applicability. ROC curves showed high area under curve (AUC) values for OS (0.878, 0.911, 0.864 at 1-, 2-, and 3-years) and RFS (0.823, 0.813, 0.793 at 1-, 2-, and 3-years), confirming strong discriminatory ability across different time points (Figures 3A–F). Calibration plots showed excellent consistency between predicted and observed outcomes, with calibration curves for 1-, 2-, and 3-year OS and RFS closely aligning with the reference line (Figures 3G–L). DCA revealed favorable net clinical benefit across a wide range of threshold probabilities (Supplementary Figure 1). Compared with single predictors (OS: High-Risk MRD, treatment regimen, WBC group; RFS: BM blasts (FCM), EMI, High-Risk MRD, treatment regimen, WBC group), the nomograms exhibited consistently higher AUCs, C-index values, and greater clinical net benefit (Figures 4A–G; Supplementary Figure 2). These findings highlighted the models’ strong predictive performance and practical value for individualized survival estimation in pediatric t (8,21) AML. Bootstrap validation (500 resamples) produced C-indices of 0.842 (OS) and 0.789 (RFS), supporting model robustness (Figure 4H).
Evaluation of prognostic nomograms for OS and RFS. 1- (A), 2- (B), and 3-year ROC curve (C) of nomogram for OS. 1- (D), 2- (E), and 3-year ROC curve (F) of nomogram for RFS. 1- (G), 2- (H), and 3-year calibration curve (I) of nomogram for OS. 1- (J), 2- (K), and 3-year calibration curve (L) of nomogram for RFS.
Comparative assessment of the nomogram predictive performance and internal validation of the models. ROC curves of the nomogram and its individual components for predicting 1- (A), 2- (B), and 3-year OS (C). ROC curves of the nomogram and its individual components for predicting 1- (D), 2- (E), and 3-year RFS (F). (G) C-index value of the nomogram and its individual components for predicting OS and RFS. (H) C-index value using 500 bootstrap resamples of nomogram models for internal validation.
Nomogram-based risk stratification
3.4
Drawing on nomogram-based scoring results, the optimal cutoff values were determined using X-Tile software to establish a risk stratification system. All participants were stratified into low- and high-risk groups. For OS, scores of 0–160 and 161–194 represented low- and high-risk groups, respectively; for RFS, low-risk group corresponded to scores of 0–240 and high-risk group to scores of 241-350. The Kaplan-Meier survival curves demonstrated that this risk stratification system exhibited excellent discriminatory and stratification abilities (Figure 5).
Kaplan-Meier survival curves of different risk groups stratified by nomogram scores. HSCT was not treated as a censoring event; events occurring after HSCT were included in the analysis. (A) OS Kaplan-Meier curve. (B) RFS Kaplan-Meier curve.
Discussion
4
Pediatric RUNX1::RUNX1T1-positive AML is considered as a favorable cytogenetic subtype; however, relapse remains the leading cause of treatment failure and death (4, 7–9, 18). Integrating routine clinical data with dynamic treatment responses improves identification of children at high risk of early adverse outcomes. In this study, 136 pediatric patients with RUNX1::RUNX1T1-positive AML were retrospectively reviewed and concise prognostic nomograms were developed to predict short-term OS and RFS. LASSO and multivariate Cox regression analyses revealed three independent prognostic factors—High-Risk MRD, treatment regimen, and WBC group—for OS, and five factors—BM blasts (FCM), EMI, High-Risk MRD, treatment regimen, and WBC group—for RFS. The nomograms demonstrated excellent discrimination, calibration, and clinical utility, as confirmed by ROC curves, calibration curves, and DCA analyses. Moreover, the models effectively distinguished patients across high- and low-risk strata, displaying markedly different survival and relapse patterns between groups.
MRD monitoring aims to sensitively detect residual leukemic cells that may lead to relapse and plays a key role in treatment evaluation, relapse prediction, and therapy optimization (19–21). Dynamic changes in molecular MRD levels strongly correlate with prognosis in AML, particularly in cases harboring fusion genes (22–25). Persistent or increasing MRD positivity during or after therapy markedly elevates relapse risk. Previous reports have shown that patients with RUNX1::RUNX1T1-positive AML who achieved a ≥2–3 log reduction in transcript levels after induction chemotherapy exhibited a significantly lower relapse risk (26–28). Aligned with previous evidence, our earlier investigation identified that inadequate transcript clearance, defined as a <3-log decline in RUNX1::RUNX1T1 levels post-induction, was linked to inferior RFS and OS (14). By integrating post-consolidation MRD kinetics, we further delineated a High-Risk MRD pattern, combining suboptimal molecular response (<3-log reduction) with sustained MRD ≥0.01% after two consolidation courses. This MRD profile corresponded to significantly adverse clinical outcomes and an elevated cumulative incidence of relapse (CIR) (14). In this study, High-Risk MRD was incorporated into the prognostic model and further reconfirmed as an independent adverse prognostic factor for 3-year survival and relapse in pediatric t (8,21) AML, exhibiting superior predictive performance compared with other individual variables, except the nomogram model. These results highlight the strong prognostic implication of High-Risk MRD and its potential utility in early risk stratification, personalized therapeutic intervention, and optimizing the timing of HSCT in pediatric AML patients with RUNX1-RUNX1T1.
In this study, patients were stratified by WBC counts at diagnosis using a cutoff of 20×10⁹/L. Patients with WBC ≥20×10⁹/L had higher proportions of deaths and relapses, and elevated WBC independently predicted poorer OS and RFS within three years among pediatric t (8,21) AML cases. These findings align with previous studies showing that leukocytosis is generally associated with adverse prognosis, more aggressive disease, and reduced survival (29, 30). For example, one study reported that patients with WBC >10×10⁹/L at induction exhibited significantly worse OS (HR 1.369, 95% CI 1.066–1.759; P = 0.013) and event-free survival (EFS, HR 1.286, 95% CI 1.035–1.599; p = 0.013), as well as increased early death (P<0.001) compared with those without leukocytosis (31). Another study in our center found that WBC ≥50×10⁹/L was linked to higher relapse and early mortality, resulting in markedly poorer outcomes (17). Furthermore, our analyses indicate that the increased mortality observed among patients with diagnostic WBC ≥20×10⁹/L is largely relapse-driven: these patients not only experienced a higher relapse rate but also had poorer survival after relapse. Collectively, these findings underscore the clinical relevance of diagnostic WBC as a readily available marker of relapse susceptibility and post-relapse prognosis in pediatric RUNX1::RUNX1T1-positive AML.
Optimization of treatment regimen improved survival and reduced relapse among pediatric t (8,21) AML patients in our study. Compared with AML-CAMS-2009, the AML-CAMS-2016 regimen incorporated the tyrosine kinase inhibitor dasatinib during consolidation with reduced chemotherapy intensity. Given the frequent KIT mutations in pediatric RUNX1-RUNX1T1-positive AML, dasatinib may improve prognosis via KIT pathway inhibition, although prospective clinical studies are warranted to validate its therapeutic effectiveness and safety profile (32, 33). Nevertheless, KIT mutation status did not retain independent prognostic significance after multivariable adjustment in our cohort, possibly due to subtype- and VAF-dependent heterogeneity that could not be assessed given the limited sample size and number of events.
Our analysis identified increased BM blasts (FCM) and the occurrence of EMI as independent predictors of three-year relapse in pediatric RUNX1-RUNX1T1-positive AML. Within the MICM diagnostic framework, FCM provides quantitative and qualitative assessment of leukemic immunophenotypes. Notably, patients with a higher proportion of BM blasts (FCM) at diagnosis exhibited a significantly increased risk of relapse. This finding supports the concept that the combined interpretation of blast burden and genetic alterations may improve risk stratification and guide more individualized, MRD-adapted management (34, 35). EMI, defined as leukemic blasts infiltration of extramedullary sites such as the liver, spleen, lymph nodes, skin, or central nervous system, occurs more frequently in t (8,21) AML and is associated with inferior outcomes (36–38). Echoing our results, earlier reports confirmed EMI as an independent adverse prognostic factor, with affected patients exhibiting significantly lower three-year RFS compared with those without EMI (68.8 ± 8.8% vs. 88.0 ± 3.4%; P = 0.004) (39). In our cohort, EMI and baseline BM blasts (FCM) were independently associated with RFS but not OS. Clinically, EMI may reflect a more disseminated disease phenotype and potential sanctuary-site involvement, which can facilitate persistence of residual leukemic clones and increase relapse risk (40). Likewise, a higher baseline BM blasts (FCM) likely indicates a higher leukemic burden and may capture biological features link to treatment-tolerant subclones, which may compromise depth of remission and predispose to relapse (41). In contrast, OS represents a more downstream endpoint and is substantially influenced by post-relapse management strategies and interventions (e.g., salvage therapy and HSCT), such that the direct effect of certain baseline risk factors on survival may be attenuated or reshaped by subsequent treatments.
This study has several notable strengths. First, it focuses on the unique subtype of pediatric RUNX1::RUNX1T1-positive AML and represents the first study based on a Chinese cohort achieving CR after a single induction course to develop nomograms predicting 3-year mortality and relapse risk. Second, all patients were consecutively enrolled in two national clinical trials (AML-CAMS-2009 and AML-CAMS-2016), ensuring standardized diagnosis, treatment, and follow-up procedures and thereby minimizing study heterogeneity. Third, MRD was dynamically monitored throughout therapy using RT-qPCR, and clinical, MICM, and therapeutic variables were integrated using LASSO and multivariate Cox regression analyses to construct robust prognostic nomograms with strong discriminatory and calibration performance. Finally, internal validation through bootstrap resampling confirmed the models’ stability and clinical applicability, offering a practical tool for individualized prognosis and treatment optimization in pediatric t (8,21) AML.
Notwithstanding its merits, this study is subject to several limitations. First, it was a single-center retrospective study with a modest cohort size, which might introduce selection bias and limit the generalizability of the results. Although strict inclusion and exclusion criteria were applied to minimize bias, the limited number of clinical events (22 deaths and 28 relapses) led to wide confidence intervals for certain variables, such as High-Risk MRD, indicating potential statistical instability. Additionally, as HSCT is a non-randomized therapeutic intervention and was not modeled as a time-dependent exposure, confounding by indication cannot be ruled out. Given that the regimens were implemented in different enrollment periods, temporal changes in supportive care and clinical practice may confound outcome comparisons. Second, the nomograms incorporated only routine clinical data, without including other potential biomarkers. Moreover, genomic profiling was limited largely to KIT and RAS-pathway alterations, and other mutations and co-mutation patterns were not uniformly available, potentially reducing the detectability of mutation-based prognostic effects. Finally, since all patients were derived from a single Chinese cohort, future studies with larger, multicenter, and ethnically diverse populations are warranted to validate the robustness and broader applicability of the nomograms.
Conclusion
5
We developed internally validated nomograms to predict 3-year OS and RFS in children with RUNX1::RUNX1T1-positive AML who achieved CR after a single induction cycle. High-Risk MRD, treatment regimen, and WBC group independently predicted OS, while BM blasts (FCM), EMI, high-risk MRD, treatment regimen, and WBC group independently predicted RFS. These clinically parsimonious tools demonstrated strong performance and practical utility for individualized risk assessment and may inform post-remission decision-making. Prospective multicenter validation is warranted.
The reference list from the paper itself. Each links out to its DOI / PubMed record.
- 1De Kouchkovsky I Abdul-Hay M . ‘Acute myeloid leukemia: a comprehensive review and 2016 update’. Blood Cancer J. (2016) 6:e 441. doi: 10.1038/bcj.2016.50, PMID: 27367478 PMC 5030376 · doi ↗ · pubmed ↗
- 2Newell LF Cook RJ . Advances in acute myeloid leukemia. Bmj. (2021) 375:n 2026. doi: 10.1136/bmj.n 2026, PMID: 34615640 · doi ↗ · pubmed ↗
- 3Chin PS Bonifer C . Modelling t(8;21) acute myeloid leukaemia - What have we learned? Med Comm. (2020) 1:260–9. doi: 10.1002/mco 2.30, PMID: 34766123 PMC 8491201 · doi ↗ · pubmed ↗
- 4Zwaan CM Kolb EA Reinhardt D Abrahamsson J Adachi S Aplenc R . Collaborative efforts driving progress in pediatric acute myeloid leukemia. J Clin Oncol. (2015) 33:2949–62. doi: 10.1200/JCO.2015.62.8289, PMID: 26304895 PMC 4567700 · doi ↗ · pubmed ↗
- 5Lin S Mulloy JC Goyama S . RUNX 1-ETO leukemia. Adv Exp Med Biol. (2017) 962:151–73. doi: 10.1007/978-981-10-3233-2_11, PMID: 28299657 · doi ↗ · pubmed ↗
- 6Harrison CJ Hills RK Moorman AV Grimwade DJ Hann I Webb DK . Cytogenetics of childhood acute myeloid leukemia: United Kingdom Medical Research Council Treatment trials AML 10 and 12. J Clin Oncol. (2010) 28:2674–81. doi: 10.1200/JCO.2009.24.8997, PMID: 20439644 · doi ↗ · pubmed ↗
- 7Zampini M Tregnago C Bisio V Simula L Borella G Manara E . Epigenetic heterogeneity affects the risk of relapse in children with t(8;21)RUNX 1-RUNX 1T 1-rearranged AML. Leukemia. (2018) 32:1124–34. doi: 10.1038/s 41375-017-0003-y, PMID: 29472719 · doi ↗ · pubmed ↗
- 8Papaemmanuil E Gerstung M Bullinger L Gaidzik VI Paschka P Roberts ND . Genomic classification and prognosis in acute myeloid leukemia. N Engl J Med. (2016) 374:2209–21. doi: 10.1056/NEJ Moa 1516192, PMID: 27276561 PMC 4979995 · doi ↗ · pubmed ↗