Risk Assessment of Dibutyl Phthalate (DBP) and Bis(2-Ethylhexyl) Phthalate (DEHP) in Hot Pot Bases with a Hybrid Modeling Approach
Xiangyu Bian, Siyu Huang, Dongya Chen, Depeng Jiang, Daoyuan Yang, Yingzi Zhao, Zhujun Liu, Shiqi Chen, Yan Song, Haixia Sui, Jinfang Sun

TL;DR
This study assesses the risk of phthalate contamination in hot pot bases using advanced statistical models, finding that children aged 7–13 face the highest risk despite overall acceptable exposure levels.
Contribution
The study introduces a hybrid modeling approach to better capture extreme phthalate contamination events, improving risk assessment accuracy.
Findings
DEHP and DBP contamination levels were best modeled using advanced statistical distributions that capture extreme values.
Children aged 7–13 had the highest calculated risk, with a maximum DEHP hazard quotient of 0.68.
Hybrid models outperformed traditional methods in identifying sporadic high-exposure events.
Abstract
(1) Background: Hot pot bases are susceptible to phthalate (PAE) contamination due to their high lipid content. Standard risk models often fail to capture extreme values, leading to biased exposure estimates. This study characterized dibutyl phthalate (DBP) and bis(2-ethylhexyl) phthalate (DEHP) contamination using a hybrid modeling framework to ensure precise risk profiling. (2) Methods: A total of 91 samples were analyzed via GC-MS. Concentration data were fitted using traditional parametric, extreme value mixture (EVMM), and finite mixture models. Probabilistic dietary risks were assessed for Chinese demographic groups using 10,000-iteration Monte Carlo simulations. (3) Results: DEHP (detection rate: 55%) and DBP (32%) were best modeled by a two-component Gamma mixture and a Lognormal–Generalized Pareto distribution, respectively. These advanced models significantly outperformed…
Genes, proteins, chemicals, diseases, species, mutations and cell lines named across the full text — each resolved to its canonical identifier and authoritative record.
Click any figure to enlarge with its caption.
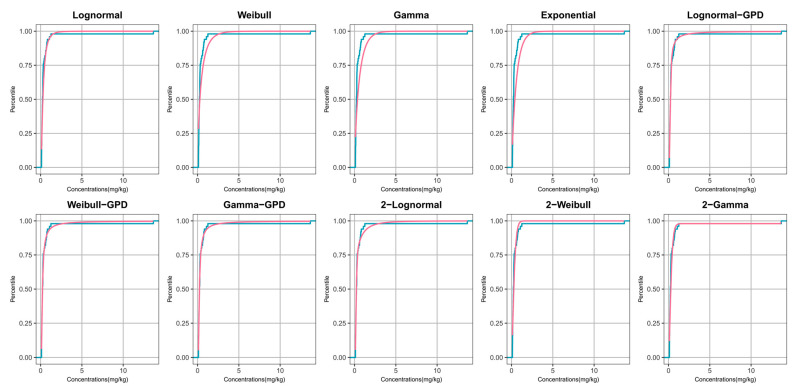 Figure 1
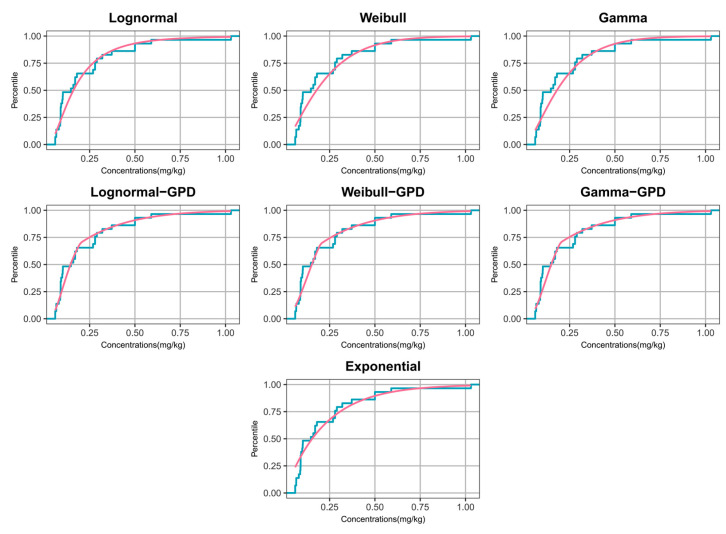 Figure 2
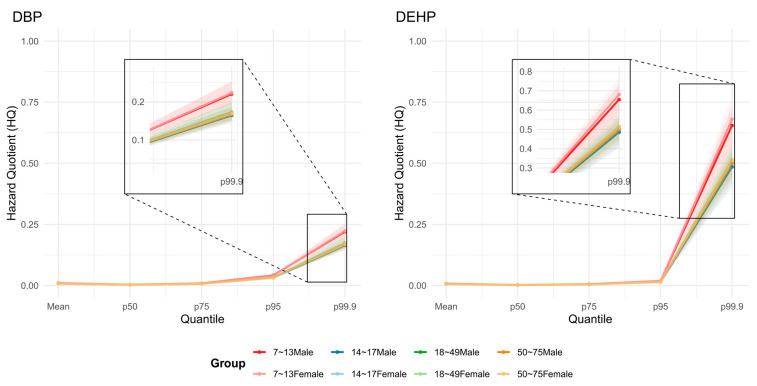 Figure 3
- —National Key Research and Development Program of China
- —China Food Safety Talent Competency Development Initiative
Peer Reviews
No public reviews on file for this paper yet. If you reviewed it on a platform where reviews are public (OpenReview, ICLR, NeurIPS, ICML), you can paste yours below so the community can read it here.
Videos
No videos yet. Explain this paper in a talk, walkthrough, or lecture? Add one.
Taxonomy
TopicsEffects and risks of endocrine disrupting chemicals · Pesticide Residue Analysis and Safety · Biochemical Analysis and Sensing Techniques
1. Introduction
Phthalic acid esters (PAEs), with an annual global production of several million tons, have become pervasive environmental and food-chain contaminants [1,2,3,4]. In nationally representative U.S. biomonitoring (NHANES), recent reports indicate that urinary metabolites of dibutyl phthalate (DBP) and di(2-ethylhexyl) phthalate (DEHP) are detected in nearly all participants, indicating ubiquitous population exposure [5]. Phthalate exposure is linked to a range of adverse health effects that are primarily mediated by endocrine disruption, including interference with thyroid, estrogen, and androgen signaling [6,7]. These disturbances can lead to reproductive, developmental, and hepatic toxicity in both experimental models and humans, and epidemiological evidence also suggests a potential association between DEHP metabolites and cardiovascular disease [8,9,10,11]. Given their inherent lipophilicity and strong plastic affinity, PAEs readily migrate from plastic materials during manufacturing, storage, and transportation, leading to environmental persistence and resistance to degradation [12,13]. PAEs consequently tend to accumulate in lipid-rich food matrices, particularly in edible oils and other high-fat products [14,15]. Some types of phthalate esters, such as DEHP, which is widely used in the manufacturing and processing of plastic products (e.g., plasticizers), are already blacklisted as priority water pollutants by the U.S. Environmental Protection Agency (EPA) [16] and are included in the List of Priority Controlled Chemicals issued by the Ministry of Ecology and Environment of China [17,18,19,20,21]. Accordingly, food safety authorities have established health-based guidance values for these plasticizers; for example, the European Food Safety Authority (EFSA) has set tolerable daily intake (TDI) values of 10 µg/kg body weight/day for DBP and 50 µg/kg body weight/day for DEHP [22].
Hot pot, a traditional Chinese cuisine characterized by its distinctive flavor, has gained widespread popularity in China and internationally and has developed into a distinctive dietary culture encompassing a wide variety of regional styles [23,24]. However, contamination from production equipment and raw materials, inadequate storage and transportation conditions, insufficient regulatory oversight, and inappropriate consumer handling practices may all contribute to plasticizer contamination in hot pot soup bases. Moreover, the potential for human exposure to plasticizers from hot pot soup bases remains poorly characterized in the Chinese population, particularly among vulnerable groups such as children and adolescents. This knowledge gap underscores the urgent need for comprehensive and systematic assessments of plasticizer-related health risks in the Chinese population, with particular attention to sensitive demographic groups.
Traditional dietary risk assessment typically uses either point estimates or probabilistic models to quantify exposure, which is then compared with health-based guidance values (HBGVs) for risk characterization [25,26]. Point estimation offers a simple, deterministic approach to integrate food consumption and contaminant concentration data, but it often yields conservative exposure estimates and ignores inter-individual variability [27,28]. In contrast, probabilistic models assume that body weight, food consumption, and contaminant concentrations follow probability distributions that describe variability across individuals and food commodities [28]. These distributions may be empirical (i.e., based on representative samples) or parametric (i.e., defined by specified parameters and applicable to smaller sample sizes) [29]. Conventional distribution models (e.g., Lognormal or exponential) often fail to capture critical tail data (i.e., extreme values), potentially skewing risk assessments [30,31]. To address these constraints, this study proposes the extreme value mixture model (EVMM) and the mixture model to more accurately characterize contaminant concentration distributions in exposure assessment scenarios. The EVMM combines a distribution for the bulk of the data with a generalized Pareto distribution (GPD) for the upper tail to characterize heavy-tailed behavior. This framework enables more precise prediction of maximum contaminant concentrations and exceedance frequencies [32]. Mixture models have gained considerable attention in statistical data analysis because of their ability to represent complex distributions and play a crucial role in descriptive modeling when a single distribution is inadequate [33]. The superior performance of mixture distribution models in health-related data analysis has been demonstrated in recent studies. For example, Campolieti and Ramos compared model performance using the Akaike information criterion (AIC) and the Bayesian information criterion (BIC). Their assessment showed that mixture models consistently fit COVID-19 mortality data better than non-mixture models [34]. This finding was further supported by Fricke et al., who observed a substantial reduction in BIC values when transitioning from single-Gaussian models to more complex two-Gaussian-component additive models. Moreover, their study indicated that models incorporating three or more Gaussian components achieved greater stability and improved goodness of fit [35].
In light of these limitations, this study developed a hybrid modeling approach for probabilistic risk assessment to better capture tail distribution characteristics and improve the precision of data fitting. This approach enabled a systematic analysis of the distribution patterns of DBP and DEHP concentrations in commercially available hot pot bases in China. Furthermore, we quantitatively assessed the potential health risks associated with dietary exposure to DBP and DEHP from hot pot soup bases across different demographic groups. Therefore, we provide a scientific basis for the assessment and management of plasticizer-related health risks from hot pot soup bases in the Chinese population.
2. Materials and Methods
2.1. Chemicals and Reagents
The mixed phthalate standard solution (1000 µg/mL; purity ≥ 95%) and isotope-labeled internal standards (mixed D4-DBP and D4-DEHP, 100 μg/mL; purity 99.0% each) were obtained from BePure (Beijing, China) and stored at 0–4 °C in the dark. Detailed purities and working-solution preparation are provided in Supplementary Text S1. A certified quality-control (QC) material for phthalates in edible oil was purchased from the Testing and Evaluation Center of the Chinese Academy of Inspection and Quarantine (Beijing, China). The certified value (characteristic range) was 2.732 mg/kg (2.462–3.002 mg/kg) for DBP and 1.654 mg/kg (1.326–1.982 mg/kg) for DEHP. Primary–secondary amine (PSA) and C18 sorbents were purchased from Agilent Technologies (Santa Clara, CA, USA). Chromatographic-grade acetonitrile and n-hexane were obtained from Tianjin Kemiou Chemical Reagent Co., Ltd. (Tianjin, China). Anhydrous MgSO_4_ (analytical grade) was purchased from Chengdu Kelong Chemical Co., Ltd. (Chengdu, China).
2.2. Sample Collection and Preparation
A total of 91 commercially available hot pot soup base samples were purchased between September and November 2022 via both online and offline retail channels across multiple regions of China. Due to the high oil content and the presence of solid ingredients (e.g., spices) in the samples, a specific homogenization protocol was applied. Samples were frozen at −18 °C for 24 h and pulverized to ensure the uniform distribution of solid particles within the lipid matrix. The homogenized samples were then stored in stoppered glass containers at room temperature. Prior to extraction, the pulverized samples were melted in a 60 °C water bath and thoroughly shaken to ensure homogeneity. An aliquot of 0.50 g of the melted sample was weighed into a glass centrifuge tube and spiked with 40 μL of the internal standard working solution (5 μg/mL each of D4-DBP and D4-DEHP). Extraction was performed with 1 mL of n-hexane and 6 mL of acetonitrile, assisted by warm water bath incubation (10 min), vortex mixing (1 min), and ultrasonication (20 min). To facilitate the precipitation of lipid impurities, the mixture was cooled at 4 °C for 15 min before centrifugation at 3000 rpm for 5 min. The supernatant was cleaned using dispersive solid-phase extraction (d-SPE) with PSA (50 mg), C18 (50 mg), and anhydrous MgSO_4_ (100 mg). The mixture was vortexed for 1 min and centrifuged at 3000 rpm for 5 min. The cleaned extract was evaporated to dryness under a gentle nitrogen stream at 40 °C, reconstituted in 2.0 mL of n-hexane, vortexed for 1 min, and filtered through a phthalate-free 0.45 μm PTFE membrane prior to GC-MS analysis. The injection volume was 1.0 μL.
2.3. GC–MS Analysis
The analysis was performed on an Agilent 7890B GC (Agilent Technologies, Santa Clara, CA, USA) coupled to an Agilent 5977B MS (Agilent Technologies, Santa Clara, CA, USA) using an HP-5MS column (30 m × 0.25 mm × 0.25 μm). The MS operated in electron ionization (EI) mode (70 eV) with selected ion monitoring (SIM). Detailed instrument settings, including the oven temperature program and optimized SIM parameters, are provided in Supplementary Text S2. The compounds were identified by retention time (±0.5%) and diagnostic ion ratios using the SIM ions listed in Supplementary Table S1 and the tolerance criteria in Supplementary Table S2 (Commission Decision 2002/657/EC) [36]. Representative chromatograms are shown in Supplementary Figures S1–S3.
2.4. Quality Assurance and Method Performance
Strict contamination control measures were implemented. The glassware was cleaned with potassium dichromate solution, baked at 450 °C for 2 h, and rinsed with n-hexane. Reagents were pre-screened to ensure background levels were below detection limits. Quantification was performed using isotope dilution with multi-point calibration curves (0–1.00 μg/mL). Calibration solution preparation is described in Supplementary Text S1, and representative calibration curves are shown in Supplementary Figures S4 and S5. Procedural blanks were analyzed in every batch to monitor background levels; sample results were blank-corrected. Batch accuracy was verified using the certified edible-oil QC material (Certificate No. 103CO02055), with all measured values falling within the certified ranges. Precision was assessed by duplicate analyses, and accuracy was further evaluated by spike-recovery experiments at three concentration levels. The limits of detection (LOD) and quantification (LOQ) were determined in accordance with the standard GB/T 27417-2017 [37]. The LOD was estimated using a signal-to-noise (S/N) ratio of 3 in matrix-spiked samples. The LOQ was defined as 3 times the LOD. The resulting LOD/LOQ values were 0.05/0.15 mg/kg for DBP and 0.10/0.30 mg/kg for DEHP. Detailed validation data are provided in Supplementary Text S3.
2.5. Dietary Consumption Data Source
For the exposure assessment, consumption of hot pot base was evaluated using a dietary survey conducted among hot pot consumers in China, from 2016 to 2018 [38]. Participants were categorized into four age groups (7–13, 14–17, 18–49, and 50–78 years), and each age group was further stratified by sex to form eight subgroups. The daily consumption ranges of hot pot base and body weights for each subgroup are presented in Table 1. Consistent with the assumption that food consumption data typically follow a Lognormal distribution [39], the consumption levels were modeled using Lognormal distributions with parameters estimated from the dataset. To ensure a robust statistical representation of population patterns, 10,000 random values were generated for each demographic group based on these distributions [40].
2.6. Hybrid Modeling of Concentration
2.6.1. Modeling of Positive Concentration Data
The positive concentration data were fitted using three modeling frameworks: a traditional parametric model, an extreme value mixture model (EVMM), and a finite mixture model. To identify the optimal model for each contaminant, a three-stage evaluation procedure was applied. In Stage 1, candidate models were screened using the Kolmogorov–Smirnov (KS) and Anderson–Darling (AD) tests, and models failing the goodness-of-fit criteria (based on p-values) were excluded; in Stage 2, the remaining models were ranked using AIC and BIC; in Stage 3, the top-ranked models were evaluated by 10,000 Monte Carlo simulations, with empirical cumulative distribution functions (ECDFs) and absolute deviations at the mean, P95, and P99.9, and the model with the smallest overall deviation was selected.
Traditional Parametric Model
Given the right-skewed concentration data, four conventional parametric distributions (Lognormal, Weibull, Gamma, and Exponential) were considered to model the positive concentration values [41].
Extreme Value Mixture Model
Three EVMMs were implemented: Lognormal–generalized Pareto distribution (GPD), Weibull–GPD, and Gamma–GPD. These models operate under the fundamental assumption that observations below a specified threshold (u) follow a parametric distribution H(·|η), whereas exceedances follow a generalized Pareto distribution (GPD) [42]: (Equation (1)). Parameters were estimated using the evmix (2.12) package in R (version 4.3.1) [32].
In this equation, represents the parameters of the bulk distribution, and denote the shape and scale parameters of the GPD, respectively, and indicates the location parameter. Model parameter estimation was performed using the evmix package in R, which provides specialized tools for extreme value mixture modeling.
Mixture Model
Three dual-distribution mixture models (2-Lognormal, 2-Weibull, and 2-Gamma) were fitted to the positive concentration data (Equation (2)). Parameters were estimated by maximum likelihood using the MixR package (0.2.0) in R (version 4.3.1) (EM algorithm), with mixing proportions constrained to sum to 1.
f(x, Φ) is the probability density function (pdf) or probability mass function (pmf) of the mixture model, is the pdf or pmf of the ith component of the mixture model, is the proportion of the ith component and is the parameter of the ith component, which can be a scalar or a vector, is a vector of all the parameters of the mixture model.
2.6.2. Modeling Detection Rate and Data Below the Limit of Detection
A binomial distribution, parameterized by the detection rate, was used to generate binary (0, 1) variables . These binary variables were then multiplied by the randomly simulated positive values from the final optimal model determined in Section 2.6.1 to generate a simulated contaminant distribution of .
where indicator variables = 1 indicate that a positive concentration was sampled, while = 0 indicates that a non-detected sample was generated. The probability of being 1 or 0 depends on the real detection rate. Values below the LOD were imputed by sampling from a uniform distribution between 0 and the LOD.
2.7. Exposure Estimation and Risk Characterization
Probabilistic modeling of dietary exposure was implemented by Monte Carlo (MC) simulations, which are mathematically defined as:
where is the daily consumption of hot pot bases by the i-th simulated individual (Section 2.5), and denotes the simulated contaminant concentration in hot pot bases consumed by the i-th person (Section 2.6.2). represents the mean body weight of a certain demographic group.
The exposure estimation employed 10,000 MC iterations per demographic group. Exposure levels were evaluated at the 50th, 75th, 95th, and 99.9th percentiles, as well as the mean value of the intake distribution.
The hazard quotient (HQ) is commonly used to assess chronic exposure risk to contaminants in food. The HQ is calculated via the following formula [43]:
where the TDI values were recommended by the EFSA; that is, the TDI was 50 and 10 µg/(kg·bw)/day for DEHP and DBP, respectively. An HQ < 1 indicates no significant health risk, whereas an HQ ≥ 1 suggests a potential health risk.
Cumulative risk assessment for the co-exposure of DEHP and DBP was performed by calculating the Hazard Index (HI) in accordance with EFSA (2019) guidelines [44]. The Relative Potency Factor (RPF) approach was applied based on a Group-TDI of 50 µg/(kg·bw)/day (expressed as DEHP equivalents), with RPFs assigned as 1 for DEHP and 5 for DBP [44]. The HI was calculated as follows:
The uncertainty in the MC simulations of consumption and concentration estimates was evaluated using bootstrap resampling to generate approximate confidence intervals (CIs) for the specified percentiles [45]. For each demographic group, 100 bootstrap samples were generated, and the corresponding 95% confidence intervals (CIs) for both the EDI and the HQ were calculated.
2.8. Statistical Analysis
All statistical analyses were conducted in R (version 4.3.1), with statistical significance defined as p < 0.05. The analysis employed the packages stats (4.3.1), evmix (2.12), and MixR (0.2.0), whereas visualization relied on ggplot2 (3.5.1) and GridExtra (2.3).
3. Results
3.1. Description of the Consumption and Contaminant Data
To characterize the consumption distribution for each demographic group, we assumed a Lognormal distribution based on the data in Table 1 and performed a 10,000-iteration Monte Carlo simulation to generate key consumption quantiles (Table 2).
An analysis of 91 hot pot soup base samples revealed that 59% (54/91) contained detectable levels of at least one phthalate congener (DEHP or DBP). DEHP was the more prevalent contaminant, detected in 55% (50/91) of the samples, whereas DBP was detected in 32% (29/91). Table 3 presents a detailed summary for both compounds, including their mean concentrations and key percentiles among the positive samples. Co-occurrence analysis showed that 86% (25/29) of DBP-positive samples also contained DEHP, indicating a high likelihood of simultaneous exposure to multiple phthalates among consumers of hot pot soup bases. Quantitative analysis further demonstrated that DEHP concentrations (mean: 0.34 mg/kg; 99.9th percentile: 12.54 mg/kg) substantially exceeded those of DBP (mean: 0.09 mg/kg; 99.9th percentile: 0.99 mg/kg). These detection frequencies and concentration percentiles were broadly consistent with previous surveys reporting the widespread presence of lipophilic plasticizers in edible oils and other oil-rich food matrices [46].
3.2. Parametric Fitting of Positive Concentration Data
A hybrid modeling framework, comprising ten distinct distribution models from three categories (traditional parametric, extreme value mixture, and mixture models) was used to characterize DEHP and DBP concentrations. Because of the limited number of positive samples, DBP was excluded from the dual-component mixture model analysis and was evaluated only with traditional parametric and extreme value mixture models. The results of the goodness-of-fit tests and information criteria are summarized in Table 4. For DEHP, the KS and AD tests for the Weibull, Gamma, and Exponential models yielded p-values < 0.05. For DBP, the KS test for the Gamma and Exponential models also produced p-values < 0.05. The estimated parameters for all models are provided in Supplementary Tables S3–S5. Based on the goodness-of-fit test results and the AIC and BIC values, we selected a set of candidate models for further evaluation.
Model performance was evaluated by overlaying the empirical CDF (step function) with the fitted CDF (smooth curve) from each candidate model (Figure 1 and Figure 2), with particular attention to both the bulk region and the upper tail. For DEHP, several single-distribution models that were rejected by KS/AD tests (e.g., Weibull, Gamma, and Exponential) showed visible departures from the ECDF, whereas the 2-Gamma, Lognormal–GPD, and Lognormal models provided the closest overall agreement (Figure 1). Notably, the Lognormal and Lognormal–GPD model tended to under-represent extreme upper-tail probabilities; the 2-Gamma model achieved a better balance between bulk fit and tail representation. For DBP, the Lognormal–GPD model tracked the ECDF more closely in the upper tail than single-distribution models, whereas some traditional parametric models showed systematic deviations consistent with the goodness-of-fit results (Figure 2). Based on visual assessment and statistical criteria (non-significant goodness-of-fit tests and the smallest BIC and AIC values), the candidate models selected for further evaluation were the 2-Gamma, Lognormal-GPD, and Lognormal models for DEHP, and the Lognormal–GPD and Lognormal models for DBP.
Subsequently, Monte Carlo simulations (n = 10,000) were performed to generate selected percentiles from these models, which were then compared with the corresponding empirical percentiles (Table 5 and Table 6). This percentile-based comparison complements the ECDF diagnostics by quantifying model performance at decision-relevant points, particularly in the extreme upper tail (P99.9), which is critical for conservative risk characterization. For DEHP (Table 5), the 2-Gamma model showed the closest agreement between simulated and observed values, with relative differences of 7.59% for the mean, 11.82% for the 95th percentile, and 4.66% for the 99.9th percentile. For DBP (Table 6), although the Lognormal–GPD model showed a slightly poorer fit at the 95th percentile (relative difference of 12.02% from the measured value), it outperformed the Lognormal model across all other evaluated percentiles. Adopting a conservative approach that prioritizes performance at the 99.9th percentile, we identified the 2-Gamma model as the optimal fit for DEHP and the Lognormal–GPD model as the optimal fit for DBP.
3.3. Dietary Exposure Levels and Risk Assessment
Concentration data simulated from the optimal models were integrated with consumption data to estimate the distributions of EDI and the corresponding HQ for each contaminant using Equations (4) and (5). The 95% CIs for selected exposure percentiles were estimated using 100 bootstrap iterations. Table 7 presents the detailed distributions of EDIs, along with the HQs at mean and 95th percentile (P95) levels to highlight key risk scenarios. Complete data regarding HQs and their 95% CIs are provided in Table S6.
Regarding dietary exposure, Table 7 shows that children aged 7–13 years exhibited the highest intake levels per body weight for both contaminants. In terms of risk characterization, across all demographic groups, no significant non-carcinogenic health risks were identified, as all HQs remained below the safety threshold of 1. As shown in Table 7, HQs at mean exposure levels were approximately 0.010 for both compounds, indicating negligible risk at central tendencies, while higher values were observed at the 95th percentile and above.
Extreme exposure scenarios were further analyzed. As detailed in Table 7, the estimated intakes at the 99.9th percentile were notably high, particularly for females aged 7–13 years, reaching 34.025 µg/(kg·bw)/day for DEHP and 2.232 µg/(kg·bw)/day for DBP. The highest HQ for DEHP exposure at the 99.9th percentile was observed among females aged 7–13 years (HQ = 0.681; 95% CI, 0.571–0.767) (Table S6), which exceeded those in all other demographic groups. For DBP exposure, the 99.9th percentile HQ ranged from 0.15 to 0.25 (Table S6), with the highest values again observed in children aged 7–13 years. In magnitude, these exposure estimates were broadly comparable to those reported for edible-oil–related assessments in western China [47] but lower than whole-diet-based estimates reported in population-specific studies [48].
Figure 3 displays the quantile distribution of HQ for each demographic group, with HQ values plotted on the vertical axis against their corresponding quantiles on the horizontal axis. This figure illustrates that for both contaminants, the 7–13-year-old groups (males in red, females in pink) exhibit the highest HQ values, particularly at the upper quantiles (e.g., the 99.9th percentile). The 95% CIs indicated that the mean and lower exposure percentiles were relatively stable, whereas the higher percentiles showed substantially greater uncertainty, reflecting larger sampling variability in the upper tail.
Under the cumulative risk assessment framework, the highest HI was observed in females aged 7–13 at the extreme 99.9th percentile, reaching a value of 0.904 (Table 8). Crucially, even this worst-case estimate remained below the safety threshold of 1.
4. Discussion
This study combined a hybrid distributional modeling framework with a probabilistic exposure assessment to characterize dietary exposure to DEHP and DBP from hot pot soup bases. A substantial proportion of samples (59%) contained detectable levels of at least one phthalate. DEHP was detected more frequently (55%) than DBP (32%), and its concentrations were consistently higher. The frequent co-occurrence of DEHP and DBP in positive samples (86%) suggests that consumers are likely to experience simultaneous exposure to multiple phthalates through this product category. Such patterns are consistent with surveys of edible oils and other fat-rich foods, in which DBP and DEHP are repeatedly reported as dominant congeners, supporting the propensity of oil-based matrices to accumulate these plasticizers. For example, an investigation of imported plant oils in western China reported that PAEs (mainly DBP and DEHP) were detected in up to 56.83% of 366 imported plant oil samples [47]. Across food-monitoring datasets, cooking oils have been highlighted as a food group with relatively high DEHP concentrations, reinforcing the relevance of oil-based foods as an important dietary source of DEHP [49]. This matrix dependence is further supported by migration evidence showing that packaged cooking oil facilitates higher PAE migration from plastic containers than mineral water under comparable conditions [50].
In terms of exposure magnitude, our findings indicate that phthalate exposure levels from hot pot soup bases are broadly comparable to those reported for imported vegetable oils in western China, as assessed by Tang et al. [47]. By contrast, our estimated dietary exposure levels of DEHP and DBP are substantially lower than those reported for pregnant women by Shan et al. [48] and lower than the estimated maximum daily intake of DEHP and DBP from edible oils reported by Luo and colleagues [51]. This discrepancy is anticipated given that previous studies typically assessed total dietary intake (or multiple major food sources) rather than a single product category. Additionally, variations in target populations and exposure-scenario definitions may further contribute to the observed between-study variability. Thus, the lower absolute exposure levels observed in our study should be interpreted within the narrower context of hot pot soup base consumption rather than overall dietary intake.
Although all estimated HQs in our study remained below 1, indicating no apparent non-carcinogenic health concern under current exposure conditions, the upper-tail estimates warrant attention. At the 99.9th percentile, DEHP HQs were considerably higher than those for DBP, with the highest values observed among children aged 7–13 years. This age group consistently exhibited the greatest risk across both contaminants, reflecting higher intake relative to body weight. The finding that DEHP posed a relatively higher risk than DBP at extreme percentiles is consistent with previous work that has identified DEHP as a major contributor to overall phthalate exposure [47]. Furthermore, the biomonitoring study by Jeddi et al. [52] in Iranian children and adolescents reported combined exposure dominated by DEHP and DBP, and Dewalque et al. [53] highlighted that children are more vulnerable to the high-risk impacts of PAEs than adults are. These external data align with our observation that school-aged children represent a key at-risk group for high-end exposure, even when average exposure levels appear acceptable.
Our results are also consistent with previous dietary risk assessments indicating that mean or median PAE exposure typically falls below health-based guidance values but that upper-bound estimates can approach or exceed TDI thresholds. For example, Gkrillas et al. [54] reported that PAE exposure from food remained below the daily tolerable intake levels established by the EFSA, but could approach approximately twice the TDI under upper-bound scenarios. Similarly, in our assessment, central-tendency HQs were close to 0.01 for both compounds, whereas upper-tail HQs for DEHP approached levels that merit closer scrutiny in high-consumption subgroups. Taken together, these findings support the view that, while typical dietary exposure to PAEs from individual food categories may not pose immediate non-carcinogenic concerns, high-end exposure scenarios—particularly among children—require continued monitoring and periodic re-evaluation.
The probabilistic framework used here also highlights the importance of explicitly characterizing uncertainty in upper-tail risk estimates. The 95% CIs around mean and lower-percentile HQs were narrow, indicating stable estimates. In contrast, CIs at the 95th and 99.9th percentiles were considerably wider, reflecting the influence of sparse extreme concentration values on model fitting and simulation. This pattern is expected in the context of limited sample sizes and rare extreme events, but it underscores the need to interpret high-percentile estimates with caution and to report uncertainty intervals alongside point estimates in dietary risk assessments.
Several limitations of this study should be acknowledged. First, the relatively small sample size contributed to high variability in the observed concentration data, particularly for DEHP, thereby introducing additional uncertainty into the parameter estimates and model performance. While the Lognormal–GPD model was robust for predicting extreme values (P99.9) for DBP, it was less accurate at the P95. Nonetheless, this model was retained because it provided conservative estimates in the upper tail, which is of primary interest for health protection. Second, although uncertainty was quantified using bootstrapping, the resulting 95% CIs at the upper percentiles remained wide, which is inherent to tail-end estimation based on limited data. Third, consumption was characterized from survey-based intake ranges rather than individual-level dietary records, which may introduce additional exposure misclassification. Finally, this assessment focused on oral exposure to two target phthalates from a single food category and did not account for cumulative exposure to multiple phthalates or for other routes such as dermal contact and inhalation. Finally, due to data constraints, the HI was calculated using only DEHP and DBP. Since the EFSA Group-TDI also includes BBP and DINP, this partial assessment may result in a slight underestimation of the cumulative risk.
Despite these limitations, the present work demonstrates that extreme value and mixture models can provide more precise and informative estimates for probabilistic dietary risk assessment than traditional single-distribution approaches, particularly when contaminant data include extreme but plausible values. To better characterize phthalate exposure from hot pot soup bases, future studies should increase both the sample size and sampling representativeness by including products from a wider range of brands, geographic regions, and production seasons. This expanded sampling strategy will help clarify whether the observed extreme concentrations represent sporadic events or indicate systemic contamination patterns. In addition, targeted source-tracking investigations should be conducted for samples exhibiting extreme concentrations, with particular attention to raw material sourcing, processing conditions, and migration from packaging materials. Such efforts will facilitate the identification of critical contamination sources and support the development of targeted mitigation strategies, ultimately contributing to more effective risk management for phthalate exposure in the general population, especially among vulnerable groups such as children and pregnant women.
5. Conclusions
This study systematically analyzed the concentrations of DEHP and DBP in hot pot bases and conducted a probabilistic risk assessment. Using a hybrid statistical modeling approach, DEHP was best described by a two-component Gamma (2-Gamma) distribution, whereas DBP was best described by a Lognormal–Generalized Pareto (Lognormal–GPD) distribution. These models effectively predicted both the mean concentrations and the 99.9th percentile (P99.9) levels.
Overall, the estimated chronic risks for the evaluated demographic groups were generally low under the current exposure assumptions (all HQs < 1). However, the modeled upper tail (P99.9) suggests potential “long-tail” risks driven by sporadic high-contamination events, with children aged 7–13 years representing the most sensitive subgroup. This underscores the need for continued monitoring and further source tracing, as well as methodological improvements to reduce uncertainty and better distinguish sporadic incidents from systematic pollution. These findings provide a scientific basis for prioritizing targeted monitoring and risk-management actions.
The reference list from the paper itself. Each links out to its DOI / PubMed record.
- 1Nanni N. Fiselier K. Grob K. Di Pasquale M. Fabrizi L. Aureli P. Coni E. Contamination of vegetable oils marketed in Italy by phthalic acid esters Food Control 20112220921410.1016/j.foodcont.2010.05.022 · doi ↗
- 2OECD Considerations for Assessing the Risks of Combined Exposure to Multiple Chemicals OECD Publishing Paris, France 2018
- 3Lazăr N.N. Călmuc M. MileaȘ.A. Georgescu P.L. Iticescu C. Micro and nano plastics in fruits and vegetables: A review Heliyon 202410 e 2829110.1016/j.heliyon.2024.e 2829138545146 PMC 10966681 · doi ↗ · pubmed ↗
- 4Giuliani A. Zuccarini M. Cichelli A. Khan H. Reale M. Critical Review on the Presence of Phthalates in Food and Evidence of Their Biological Impact Int. J. Environ. Res. Public Health 202017565510.3390/ijerph 1716565532764471 PMC 7460375 · doi ↗ · pubmed ↗
- 5National Center for Environmental Health (U.S.) Division of Laboratory Sciences Fourth National Report on Human Exposure to Environmental Chemicals: Updated Tables, January 2019, Volume One Centers for Disease Control and Prevention Atlanta, GA, USA 201910.15620/cdc 75822 · doi ↗
- 6Yang T.C. Jovanovic N. Chong F. Worcester M. Sakhi A.K. Thomsen C. Garlantézec R. Chevrier C. Jensen G. Cingotti N. Interventions to Reduce Exposure to Synthetic Phenols and Phthalates from Dietary Intake and Personal Care Products: A Scoping Review Curr. Environ. Health Rep.20231018421410.1007/s 40572-023-00394-836988899 PMC 10300154 · doi ↗ · pubmed ↗
- 7Kahn L.G. Philippat C. Nakayama S.F. Slama R. Trasande L. Endocrine-disrupting chemicals: Implications for human health Lancet Diabetes Endocrinol.2020870371810.1016/S 2213-8587(20)30129-732707118 PMC 7437820 · doi ↗ · pubmed ↗
- 8Gray L.E.Jr. Ostby J. Furr J. Price M. Veeramachaneni D.N. Parks L. Perinatal exposure to the phthalates DEHP, BBP, and DINP, but not DEP, DMP, or DOTP, alters sexual differentiation of the male rat Toxicol. Sci.20005835036510.1093/toxsci/58.2.35011099647 · doi ↗ · pubmed ↗