Source Profile Analysis of Atmospheric Volatile Organic Compounds in Chongqing
Anqi Zhang, Xin Qi, Yuchun Jiang, Hanfei Zuo, Yang Chen, Xiaoqian Li

TL;DR
This study identifies and compares VOC sources in Chongqing, China, highlighting health risks from automotive manufacturing emissions.
Contribution
The first systematic VOC source profile analysis for key industries in Chongqing, revealing sector-specific chemical signatures.
Findings
Furniture manufacturing emissions are dominated by alkanes (65%).
Automotive manufacturing emits 64% aromatic hydrocarbons, posing significant health risks.
Locally derived profiles provide essential data for emission reduction strategies in Chongqing.
Abstract
This study presents the first systematic investigation of Volatile Organic Compounds (VOC) source profiles from key industrial sectors in Chongqing, China. Source-specific emission data were collected from fifteen representative facilities encompassing furniture manufacturing, automobile production, and chemical industries through a combination of on-site sampling and comprehensive literature review. Our results reveal distinct chemical signatures and regional variations among different source categories: furniture manufacturing emissions are dominated by alkanes (65%), chemical industries exhibit 51% alkane contribution, while automobile manufacturing demonstrates a remarkably high aromatic hydrocarbon content (64%), significantly exceeding other investigated sectors. Notably, aromatic hydrocarbons—particularly benzene derivatives—emitted from automotive manufacturing facilities pose…
Genes, proteins, chemicals, diseases, species, mutations and cell lines named across the full text — each resolved to its canonical identifier and authoritative record.
Click any figure to enlarge with its caption.
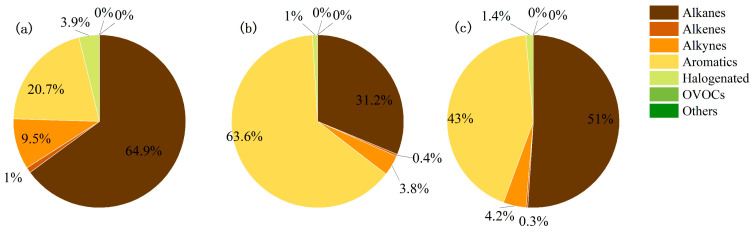 Figure 1
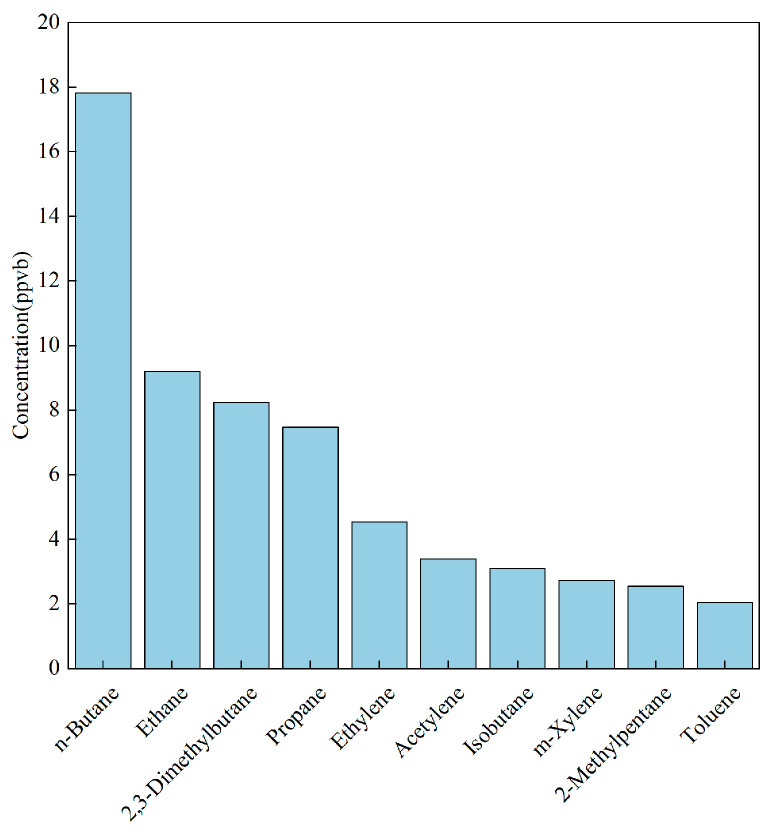 Figure 2
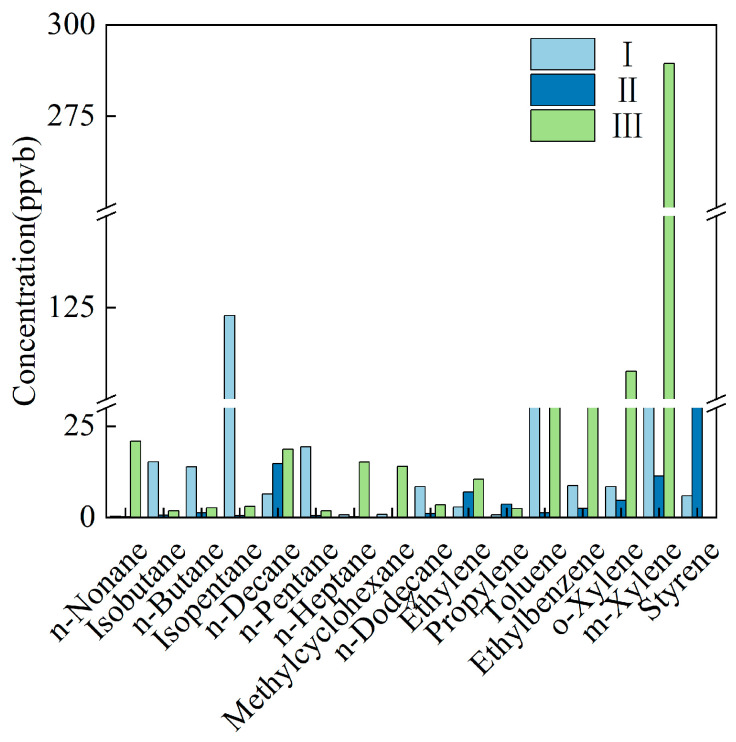 Figure 3
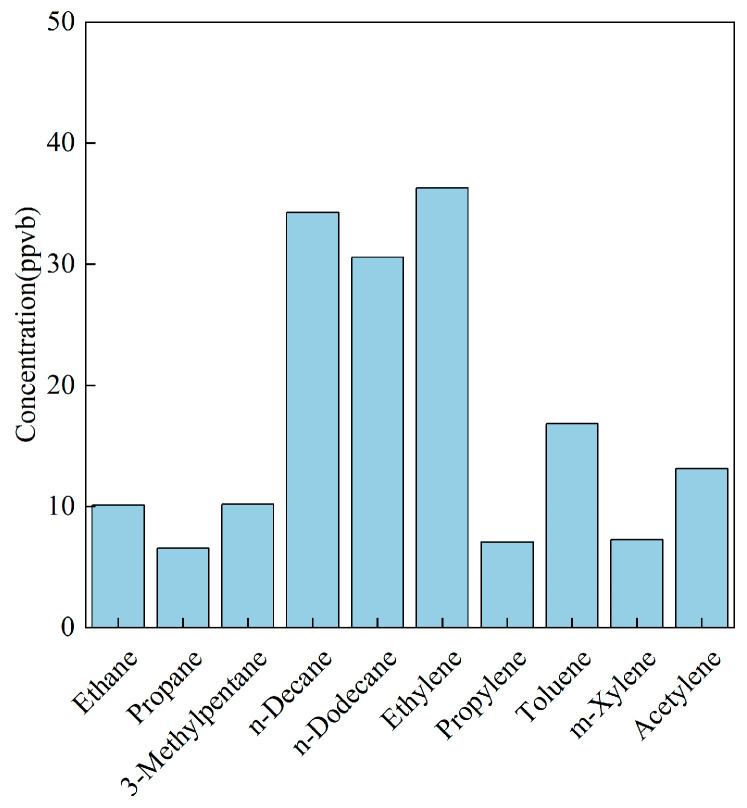 Figure 4
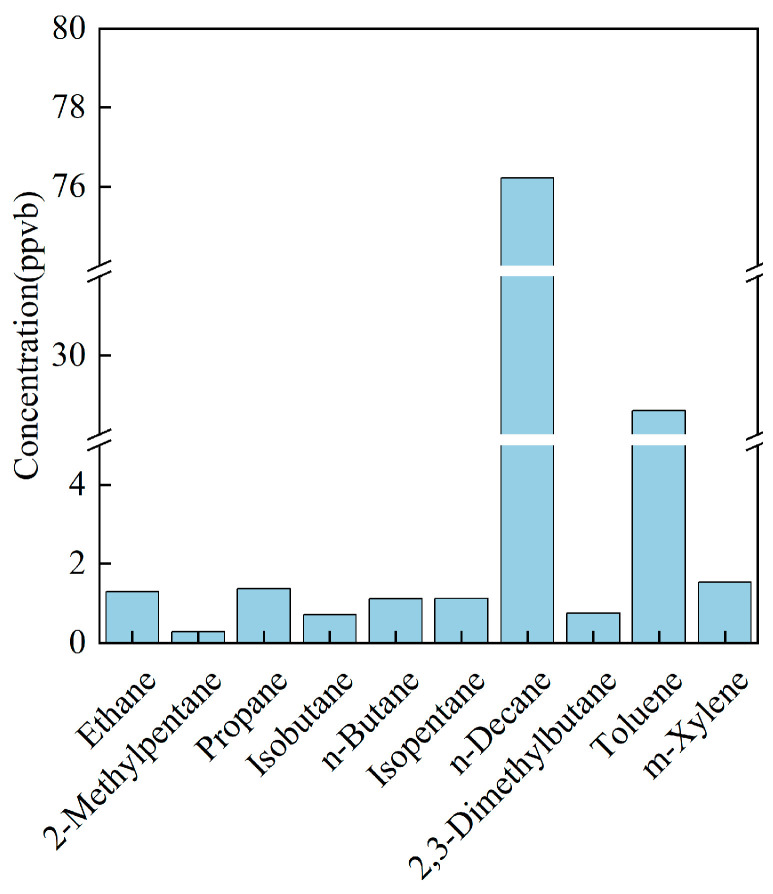 Figure 5
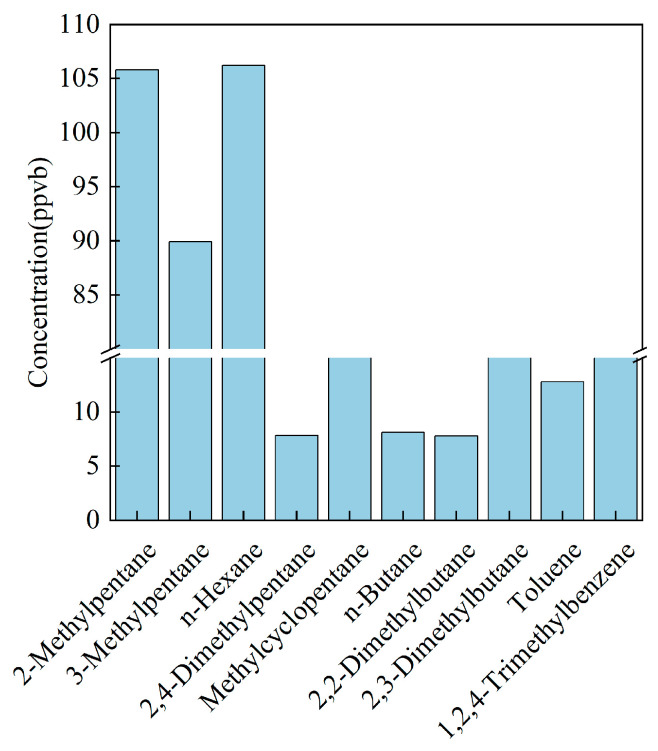 Figure 6
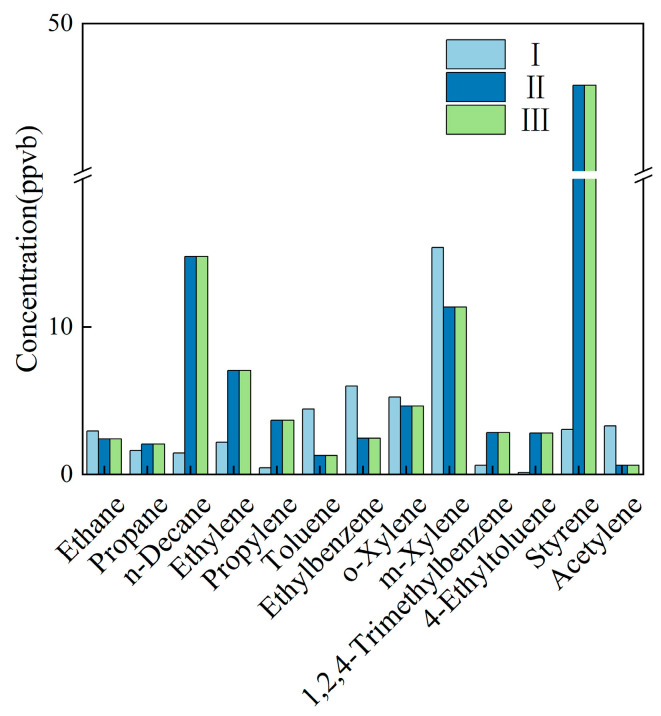 Figure 7
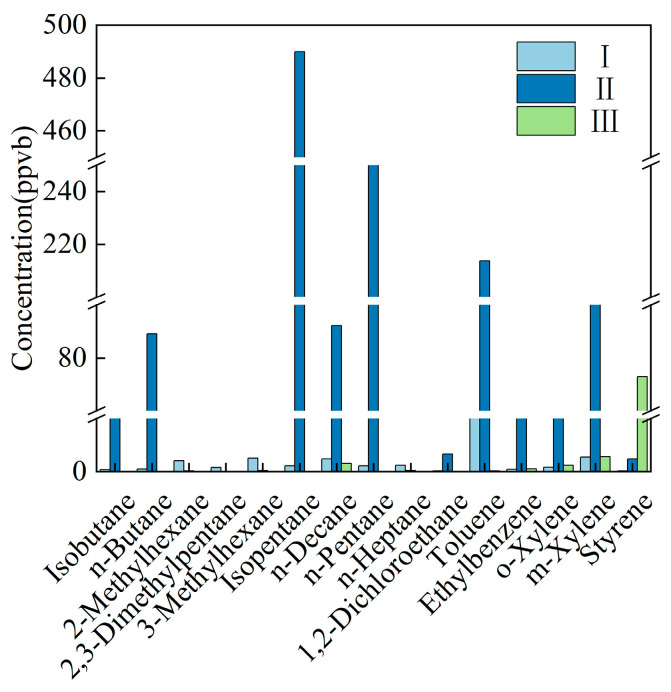 Figure 8
- —Central Public-Interest Scientific Institution
- —Chinese Academy of Engineering
Peer Reviews
No public reviews on file for this paper yet. If you reviewed it on a platform where reviews are public (OpenReview, ICLR, NeurIPS, ICML), you can paste yours below so the community can read it here.
Videos
No videos yet. Explain this paper in a talk, walkthrough, or lecture? Add one.
Taxonomy
TopicsAtmospheric chemistry and aerosols · Indoor Air Quality and Microbial Exposure · Odor and Emission Control Technologies
1. Introduction
Volatile Organic Compounds (VOCs) are defined as all organic chemicals exhibiting a saturated vapor pressure ≥ 70 Pa at ambient temperature and a boiling-point range of 50–260 °C at standard pressure. These species actively participate in the photochemical formation of tropospheric ozone (O_3_) and secondary organic aerosols (SOAs), exerting a decisive influence on regional O_3_ episodes and PM_2.5_ pollution, and constitute key precursors of urban haze and photochemical smog [1]. Most VOCs possess unpleasant odors and exhibit toxicity, irritation, teratogenicity, and carcinogenicity; benzene, toluene, and formaldehyde, in particular, impose substantial adverse health effects [2,3,4]. Owing to their structural diversity, VOCs are conventionally classified into six chemical families: alkanes, alkenes, alkynes, aromatics, halogenated hydrocarbons, and oxygenated VOCs (OVOCs) [5]. Individual VOCs differ markedly in their physicochemical properties, such as ozone-formation potential and health hazard. Numerous studies have quantified carcinogenic and non-carcinogenic risks, demonstrating that aromatics, aldehydes, and halogenated hydrocarbons exert varying degrees of harm to human health [6,7,8,9]. Consequently, accurate characterization of VOC speciation from distinct emission sources and comprehensive toxic-risk assessment are prerequisite steps toward establishing a robust VOC source-profile database, indispensable for O_3_ source apportionment and effective pollution mitigation.
VOCs sources are broadly categorized as biogenic (BVOCs) and anthropogenic (AVOCs) [10]. BVOCs are dominated by vegetation emissions [11], whereas AVOCs arise from stationary combustion [12], mobile sources [13], industrial processes [14], solvent use [15], fuel storage and transportation [16], biomass burning [17], cooking fumes [18], solid-waste treatment [19], and miscellaneous anthropogenic activities [20].
To date, most VOC studies report ambient concentrations; speciated characterization of individual emission sources—especially key industrial sectors—remains scarce. Nationwide, industrial VOC emissions increased 11.6-fold between 1980 and 2010 [21], underscoring that abating industrial sources is pivotal to curbing China’s total VOC burden. Chongqing exemplifies this challenge: its industrial structure is highly heterogeneous, emission nodes are numerous, and VOC fingerprints differ markedly among sectors, rendering source-profile construction particularly demanding. Moreover, anthropogenic VOCs pose non-negligible health risks [22,23,24]. To quantify sector-specific emissions and toxic impacts in Chongqing, we selected representative industrial parks and conducted in-plant measurements along the full production chains of typical facilities. By documenting raw materials, products, process configurations, and emission behaviors, we provide robust data for evaluating industrial VOC emissions in Chongqing and across China, and help identify the priority enterprises for control.
2. Materials and Methods
2.1. Sampling Period and Sites
Industrial parks were targeted to capture VOC emissions from key processes. Fifteen facilities were selected in Chongqing, covering furniture manufacturing, automobile production, and the chemical industry. On-site investigations documented raw materials, products, process configurations, and emission characteristics. Stack sampling was performed at each facility between May and July 2020; details are provided in Table 1.
2.2. Sampling Method
The 8 h integrated samples were collected at each sampling location. Whole-air samples were in pre-cleaned, evacuated SUMMA canisters. After removing the protective nut and plug, a 2 µm PTFE filter was attached and inserted as deeply as possible into the stack. For ducts under negative pressure, the annulus between the probe and the port was sealed with a PTFE gasket to prevent ambient ingress. The canister valve was then opened to start sampling; after ~2 min, the valve was closed clockwise, the filter removed, and the transport plug reinstalled.
2.3. Analytical Method
Samples were analyzed with a TH300B–GC–FID/MS system (Wuhan Tianhong Instruments Co., Ltd., Wuhan, China). Sample pre-concentration was performed with a TH300B unit (Wuhan Tianhong Instruments Co., Ltd., Wuhan, China), and separation/identification with an Agilent 7820A-5977E GC-MS (Agilent Technologies, Inc., Santa Clara, CA, USA). Both instruments are verified by metrological certification; certificate details are given in Table 2.
The TH300B-GC-FID/MS system used an ultra-low-temperature empty-tube trap at −160 °C, followed by thermal-desorption injection to complete one enrichment–desorption–analysis–back-flush cycle per hour. C_2_–C_5_ hydrocarbons were separated on a PLOT Al_2_O_3_/KCl column and detected by FID (channel I), while C_5_–C_10_ hydrocarbons, halocarbons, and oxygenated VOCs were separated on a DB-624 column and detected by MS (channel II). Overall detection limits ranged from 20 ppt to 300 ppt (≈0.08–1.2 µg m^−3^ for benzene). Quantitative repeatability was ≤15% RSD, linearity error ≤ ±10% (r ≥ 0.995), and expanded uncertainty ≈ 25% (k = 2), meeting the requirements for online VOC monitoring.
A total of 57 target compounds were quantified, as listed in Table 3.
3. Results
3.1. VOC Source Profiles in Chongqing
Figure 1 summarizes the speciated profiles for the three investigated sectors. In furniture manufacturing, alkanes dominated (65%), followed by aromatics (21%) and alkenes (9%); alkynes and halocarbons contributed 4% and 1%, respectively. Vehicle-coating operations were characterized by an aromatic-rich signature (64%), with alkanes accounting for 31% and alkenes 4%; alkynes represented 1%. Chemical-industry emissions were more evenly split between alkanes (51%) and aromatics (43%), while alkenes and alkynes comprised 4% and 2%.
3.2. Regional Discrepancies in Typical Anthropogenic Source Profiles
To quantify inter-city variability, we compared VOC fingerprints of the same industries reported for different regions, restricting the analysis to profiles that speciate ≥90% of the emitted mass. Here we first address furniture manufacturing and vehicle-coating emissions in Chongqing, followed by a sector-specific examination of several chemical-industry sources.
3.2.1. Furniture Manufacturing
We compared the solvent-use VOC profile measured in Chongqing with the recently published Guangdong inventory [25]. Both datasets show a qualitatively similar pattern—alkanes and aromatics dominate—but quantitative splits differ. Alkanes contributed 13–65% and aromatics 21% in the two cities, while the sum of m,p-xylene, toluene, ethyl-benzene, o-xylene, and styrene consistently accounted for 8–17% of total mass, identifying these five species as robust tracers for furniture solvent emissions (Table 4).
Region-specific disparities are nevertheless evident. In Chongqing, alkanes are markedly enriched: n-butane, ethane, 2,3-dimethyl-butane, and propane together comprise 20–8% of the profile (Figure 2), almost twice their collective share in Guangdong. Conversely, Guangdong exhibits a pronounced oxygenated fraction (OVOCs ≈ 30%), underscoring the influence of regional factors on source-profile composition.
3.2.2. Vehicle Manufacturing
Solvent-use VOC profiles were established for three automobile plants in Chongqing and one in Shanghai [26]. Except for Chongqing I, aromatics dominated at all facilities, accounting for 67–99% of the speciated mass; Chongqing I was uniquely alkane-rich.
As shown in Table 5, isopentane alone represented 34% of Chongqing I’s emissions, with n-pentane, isobutane, and n-butane also abundant. Aromatics ranked second, led by toluene (19%) and m,p-xylene (8%).
Chongqing II displayed the highest aromatic fraction; the top five species were m,p-xylene, styrene, n-decane, o-xylene, and ethyl-benzene. Chongqing III was almost pure styrene (97%), with only 1% m,p-xylene (Figure 3).
3.2.3. Industrial Processes
One Chongqing-based chemical-process profile (tire-rubber internal mixing) was compared with a recent dataset from the Pearl River Delta [27]. For the Chongqing facility, alkanes dominated (≈60%), followed by aromatics; the top five species were ethene, n-decane, n-dodecane, toluene, and acetylene (Figure 4). In contrast, the PRD chemical plant was aromatic-rich (≈50%) with OVOCs as the second-largest class (Table 6). These contrasts highlight the strong sector- and process-dependence of VOC fingerprints even within the same industrial umbrella.
3.2.4. Petrochemical Industry
Two petrochemical source profiles—one from Chongqing and one from Beijing [28]—were examined (Table 7). Both are alkane-dominated, with aromatics as the second-largest class, yet the dominant homologues differ by site. In the Chongqing lubricant-oil unit, n-decane alone accounted for 64% of the speciated mass, followed by toluene at 24% (Figure 5), illustrating that even within the same sector, feedstock and unit operation choices create distinct VOC fingerprints. Some studies have shown that ethylene, propylene, benzene, toluene, and styrene exhibit the highest factor loadings in petrochemical sources [29].
3.2.5. Solvent Use
Two solvent-use profiles were compiled: one for an electronics plant in Chongqing and one for a coating-solvent facility in Zhejiang (Table 8) [30]. In the Chongqing electronics source, alkanes prevailed (≈55%); n-hexane, 2-methylpentane, 3-methylpentane, methyl cyclopentane, and 2,3-dimethylbutane ranked as the top five species, whereas aromatics were limited to 1,2,4-trimethylbenzene and toluene (Figure 6). Conversely, the Shaoxing (Zhejiang) electronics stack was halocarbon-rich (31.7%), with alkanes contributing 30.4%. These large discrepancies confirm that solvent-use fingerprints are dictated by the exact thinner blends employed in each sector. Measurements of solvent-based and water-borne coatings show that highly reactive species—such as aromatic hydrocarbons and oxygenated VOCs—dominate the emissions [31], whereas printing processes are characterized primarily by long-chain alkanes and heavy aromatic hydrocarbons [32].
3.2.6. Metal Spraying
Three Chongqing profiles for metal-surface coating and one Wuhan profile for automotive repair spraying [33] were compared. Except for Chongqing III, aromatics dominated the two remaining Chongqing stacks, whereas the Wuhan source was richest in halogenated hydrocarbons in Table 9.
The Chongqing I and Chongqing II fingerprints were broadly similar: the top six species were m,p-xylene, ethyl-benzene, o-xylene, toluene, acetylene, and styrene for I, and styrene, n-decane, m,p-xylene, ethene, o-xylene, and propene for II. Chongqing III’s profile was instead alkene-dominated, with ethene and propene alone accounting for 69.3% and 17.6% of the total mass, respectively. The main VOCs emitted from solvent-based coating/spraying processes primarily include alcohols, benzenes, esters, and aldehydes [32] (Figure 7).
3.2.7. Plastic-Product Manufacturing
The database contains three solvent-use profiles from Chongqing plastic plants and one from the Yangtze River Delta [34]. Table 10 shows that Chongqing sources are alkane-dominated, with ethane alone exceeding 20%, whereas the Yangtze Delta profile is richest in halogenated hydrocarbons.
Within Chongqing, I and II share similar fingerprints: toluene, m,p-xylene, and n-decane all appear among the top five species. Toluene represents 34% of Chongqing I’s emissions, while isopentane (31%) and n-pentane (19.7%) head the list at Qingling (Figure 8). Chongqing III’s profile is instead aromatic-rich, with styrene reaching 83% of the total mass.
4. Discussion
The VOC profile of the furniture manufacturing sector is dominated by alkanes (volume fraction 65%), primarily originating from the extensive use of C6–C12 straight- and branched-chain alkanes in solvent-borne coatings, adhesives, and wood preservatives [34]. In contrast, aromatics account for 64% of the total VOC emissions from automobile manufacturing, a pattern directly linked to the widespread use of toluene, xylene, and trimethylbenzene in basecoats and clearcoats. The chemical industry exhibits a bimodal “alkane–aromatic” distribution (51% vs. 43%), reflecting integrated processes that consume naphtha and liquefied petroleum gas while simultaneously producing benzene-based intermediates. These three source profiles are statistically distinct and can serve as robust chemical fingerprints in receptor-oriented source apportionment models.
Further analysis of benzene, toluene, and xylene (BTX) reveals that their combined contributions reach ~60% of total VOCs in both automotive and chemical plant emissions, significantly exceeding the 20% observed for furniture manufacturing. Owing to their high acute toxicity and carcinogenic potential, together with secondary formation of toxic carbonyls such as formaldehyde and glyoxal during atmospheric oxidation, BTX emissions pose chronic health risks to occupational workers and residents within 1–3 km of the facilities [35,36]. Consequently, priority should be given to monitoring and controlling benzene-series compounds released by the automotive and chemical industries to achieve precise regulation of high-risk VOCs.
The close linkage between solvent recipe and emitted spectrum confirms that the above five aromatics can serve as chemical fingerprints in receptor modeling [37,38]. Their elevated abundance relative to other anthropogenic sectors makes them priority markers for attributing ambient VOCs to furniture-manufacturing activities and for designing solvent-substitution control policies.
In the field of vehicle manufacturing, across the sector, n-/iso-butanes and -pentanes, higher n-alkanes, toluene, xylenes, trimethyl-benzenes, ethyl-toluenes, together with the OVOCs n-butyl acetate and propylene-glycol methyl-ether acetate and light alcohols, are consistently elevated [39,40]. Their exact distribution is, however, tightly linked to paint formulation, application technology, and abatement configuration.
Across the results of industrial processes, the tire-compounding workshop in Chongqing displays a “dominated-by-alkanes, followed-by-aromatics” emission pattern, whereas the same process in the Pearl River Delta (PRD) shows aromatics as the largest contributor and OVOCs as the second, with alkanes markedly reduced. This inter-regional discrepancy demonstrates that raw-material formulation, process temperature, and tail-gas control level exert a decisive influence on the type of VOCs released.
In summary, VOC source profiles from China’s petrochemical industry are commonly dominated by alkanes, followed by aromatics, yet notable plant-to-plant and region-to-region disparities exist. Consequently, establishing localized profiles and selecting the species with the highest factor loadings as tracers are essential for accurately identifying and quantifying petrochemical VOC emissions.
Although electronic-device and coating-solvent emissions are conventionally grouped under the umbrella of “solvent evaporation,” their dominant VOC categories diverge markedly once industry, process, and region are taken into account. Coating-solvent profiles shift sharply with product type: solvent-borne and water-borne coatings are dominated by highly reactive aromatics and oxygenated VOCs, whereas printing operations are characterized by long-chain alkanes and heavy aromatics. These contrasts underscore that solvent use cannot be treated as a single source type; instead, high-resolution, locality-specific source profiles must be established for each clearly defined industrial process.
Based on the comprehensive source profiles of metal surface coatings in Chongqing and Wuhan, this source category is jointly regulated by three factors: enterprise, region, and coating type. It exhibits a trend dominated by aromatic hydrocarbons, with high levels of halogenated hydrocarbons and prominent alkenes. In Chongqing, Enterprises I and II share highly similar profiles, with benzene series such as m/p-xylene, ethylbenzene, o-xylene, and toluene serving as core tracers (Figure 7). This reflects the common use of traditional solvent-based coatings that contain benzene-series diluents. In contrast, samples from Wuhan show halogenated hydrocarbons ranking first, suggesting the widespread use of chlorine/fluorine-based cleaning agents or special functional additives in the region. Compared to the literature-reported [31] profile of “solvent-based coatings jointly characterized by alcohols, esters, aldehydes, and benzene series,” this study further reveals that metal surface coating is not a uniform “benzene-series source.” Instead, it should be subdivided into sub-sources based on coating formulations, processes, and pretreatment agents.
The VOC source profiles for plastic product manufacturing and solvent use in this research source library indicate that VOC emissions from different regions and enterprises are jointly influenced by variations in raw material formulations and production processes. Plastic manufacturing and solvent use sources are not uniformly “alkane-based” or “benzene-series-based”. Therefore, further subdivision based on region, enterprise, production process, and raw materials is necessary to accurately support regional VOC source apportionment and control strategies.
5. Conclusions
Atmospheric VOC sources are highly heterogeneous; their source profiles are shaped by industry type, feedstock properties, production technologies, air-control devices, and analytical protocols. Consequently, both the chemical classes and the abundances of individual species differ markedly among source categories. Process emissions are richest in aromatics, followed by alkanes and OVOCs, whereas solvent-use sources place aromatics first, OVOCs second, and alkanes third. Even when two sources exhibit similar class-level splits, scrutiny at the species level reveals distinct fingerprints that can unambiguously separate their contributions. Meanwhile, emission sources dominated by aromatic hydrocarbons should be given priority in control measures. VOC emissions vary by region, enterprise, process, and feedstock; source profiles must be disaggregated accordingly to enable accurate attribution and targeted control. This study bridges the gap in local industrial VOC source profiles for Chongqing, furnishing place-specific scientific evidence that enables accurate source apportionment and targeted, industry-specific emission-reduction strategies.
The reference list from the paper itself. Each links out to its DOI / PubMed record.
- 1Kulmala M. Wei D. Zhang X. Zhang T. Xia M. Wang Y. Zou Z. Zheng F. Zhang Y. Yang C. Understanding atmospheric processes: Insights from the comparison between Beijing and Hyytiälänpj Clean Air 202512610.1038/s 44407-025-00020-x · doi ↗
- 2Zhu L. Guan X. Li J. Peng Y. Zhang X. Gong A. Li M. Xie H. Chen S. Li J. Characterization of VO Cs emissions and associated health risks inherent to the packaging and printing industries in Shandong Province, China Sci. Total Environ.202494617410810.1016/j.scitotenv.2024.17410838914328 · doi ↗ · pubmed ↗
- 3Jia J. Wang J. Jin W. Yu N. Gong S. Ni J. Zhang X. Zhou L. Inter-annual variability and health risk assessment of summer VO Cs in a Plain City of China Atmos. Environ.202433712079010.1016/j.atmosenv.2024.120790 · doi ↗
- 4Gope M. Masto R.E. Basu A. Bhattacharyya D. Saha R. Hoque R.R. Khillare P.S. Balachandran S. Elucidating the distribution and sources of street dust bound PA Hs in Durgapur, India: A probabilistic health risk assessment study by Monte-Carlo simulation Environ. Pollut.202026711566910.1016/j.envpol.2020.11566933254680 · doi ↗ · pubmed ↗
- 5Hao S. Du Q. Wei X. Yan H. Zhang M. Sun Y. Liu S. Fan L. Zhang G. Composition and Reactivity of Volatile Organic Compounds and the Implications for Ozone Formation in the North China Plain Atmosphere 20241521310.3390/atmos 15020213 · doi ↗
- 6Xiong Y. Bari M.A. Xing Z. Du K. Ambient volatile organic compounds (VO Cs) in two coastal cities in western Canada: Spatiotemporal variation, source apportionment, and health risk assessment Sci. Total Environ.202070613597010.1016/j.scitotenv.2019.13597031846882 · doi ↗ · pubmed ↗
- 7Partha D.B. Cassidy-Bushrow A.E. Huang Y. Global preterm births attributable to BTEX (benzene, toluene, ethylbenzene, and xylene) exposure Sci. Total Environ.202283815639010.1016/j.scitotenv.2022.15639035654176 · doi ↗ · pubmed ↗
- 8Xiong Y. Huang Y. Du K. Health Risk-Oriented Source Apportionment of Hazardous Volatile Organic Compounds in Eight Canadian Cities and Implications for Prioritizing Mitigation Strategies Environ. Sci. Technol.202256120771208510.1021/acs.est.2c 0255835939835 · doi ↗ · pubmed ↗