AI-Driven Tuberculosis Hotspot Mapping to Optimize Active Case-Finding: Implementing the Epi-Control Platform in Uganda
Geofrey Amanya, Sumbul Hashmi, Jessica Sarah Stow, Philip Tumwesigye, Bernadette Nkhata, Kelvin Roland Mubiru, Anne-Laure Budts, Matthys Gerhardus Potgieter, Seyoum Dejene Balcha, Muzamiru Bamuloba, Andiswa Zitho, Luzze Henry, Mary G. Nabukenya-Mudiope, Caroline Van Cauwelaert

TL;DR
An AI tool called Epi-Control was used in Uganda to identify tuberculosis hotspots, improving the efficiency of active case-finding by targeting high-risk areas.
Contribution
The study introduces an AI-driven platform for predicting TB hotspots at a sub-parish level in Uganda using Bayesian modeling and open-source data.
Findings
The model identified significantly higher TB yields in hotspot areas (risk ratio = 1.69, 95% CI 1.41–2.02; p < 0.001).
Central and Western regions showed the highest concentrations of hotspots, linked to population density and urbanization.
The model prioritized areas with higher observed active case-finding yields, suggesting potential for operational use.
Abstract
Tuberculosis remains a major public health concern in Uganda, one among the thirty high TB burden countries globally. Despite national progress, gaps persist due to asymptomatic disease, diagnostic limitations, and uneven access to healthcare within the country. This study implemented the Epi-control platform, an AI-driven predictive modelling tool, to predict community-level hotspots and support data-driven active case-finding (ACF). Using retrospective chest X-ray screening data, we integrated demographic, environmental, and human development indicators from open-source databases to model TB risk at sub-parish level. A proprietary Bayesian modelling framework was deployed and validated by comparing TB yields between predicted hotspots and non-hotspot locations. Across Uganda, the model identified significantly higher TB yields in hotspot areas (risk ratio = 1.69, 95% CI 1.41–2.02; p <…
Genes, proteins, chemicals, diseases, species, mutations and cell lines named across the full text — each resolved to its canonical identifier and authoritative record.
Click any figure to enlarge with its caption.
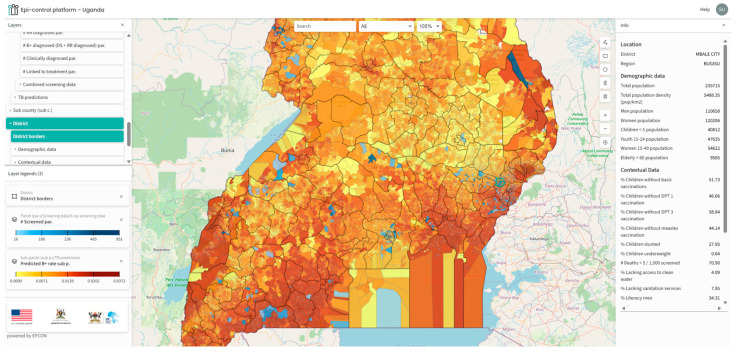 Figure 1
Peer Reviews
No public reviews on file for this paper yet. If you reviewed it on a platform where reviews are public (OpenReview, ICLR, NeurIPS, ICML), you can paste yours below so the community can read it here.
Videos
No videos yet. Explain this paper in a talk, walkthrough, or lecture? Add one.
Taxonomy
TopicsTuberculosis Research and Epidemiology · Diagnosis and treatment of tuberculosis · Data-Driven Disease Surveillance
1. Introduction
Tuberculosis (TB) continues to pose a significant public health challenge in Uganda. The country is among the thirty high TB burden countries globally, with an estimated 240 new cases reported daily [1]. While stakeholders use national estimates of incidence and prevalence to determine high-burden areas, these figures can vary locally due to differences in local risk factors [2]. Moreover, passive case-finding often fails to fully capture the true TB incidence [3,4]. This is attributable to factors such as limited healthcare access, asymptomatic cases, diagnostic shortcomings, or misdiagnosis as other respiratory ailments [4]. Active case-finding (ACF) proactively identifies individuals at risk of TB, a shift from reactive healthcare [3,5]. It is vital for diagnosing TB in both urban and rural areas, stopping its spread through early detection and treatment [6]. ACF also helps to understand challenges faced by individuals that prevent them from seeking care, allowing efficient resource allocation and reducing disease burden [7].
Ugandan studies highlight the effectiveness of ACF strategies in boosting TB case detection. One study found targeted community-based ACF had a tenfold higher screening yield than healthcare facility screening (3.7% vs. 0.3%); this targeted screening included yield from contact tracing and screening in slums, markets, and taxi/bus terminals [8]. Another study by Robsky et al. in Kampala showed screening 20% of the population could find 40% of undiagnosed TB cases [7]. Aceng observed a rise in TB case notifications in Uganda, especially after ACF implementation began in 2018 [2]. Given that ACF requires significant resources, it is essential to implement data-driven and evidence-based strategies to enhance systematic and cost-effective screening. Methods like GIS-based hotspot mapping [4,7,9,10] effectively target resources to TB hyperendemic zones or hotspots. Traditional geospatial mapping methodologies predominantly rely on routine notification data, thereby limiting their accuracy to the quality of the data itself. In countries where notification data fails to encompass all instances, it becomes imperative to explore alternative and innovative strategies.
Leveraging the growing adoption of AI and machine learning approaches, we implemented a proprietary solution from EPCON, called the ‘Epi-control platform’ to identify community-level TB hotspots in Uganda. The solution has previously been implemented in Pakistan [11], Nigeria [12], Central African Republic [13], and The Philippines to mention a few, in collaboration with local partner organizations and the National TB control programmes.
The Epi-control platform is a software, accessible via a browser, which uses AI to strengthen public health. The platform uses principles of machine learning to develop an epidemiological digital representation (“twin model”) of geospatial TB positivity across Uganda. This digital twin model was based on data generated from local ACF programme implementation and contextual data, following the principles of the MATCH framework [14,15]. The outputs were visualized on a customized Geoportal with an intuitive interface. The local stakeholders can access the platform for routine planning of community outreach interventions for the wider general population, assessing the distribution of healthcare services and countrywide hotspot predictions down to the community level.
This study aims to assess the ability of the Epi-control platform to effectively predict ‘hotspots’ that could be targeted for improving ACF outcomes in Uganda.
We intend to achieve the following objectives:
- Use bacteriological confirmed TB positivity rate from ACF interventions along with local contextual data to predict TB positivity rate at sub-parish level across the four regions.
- Map the predicted output, the bacteriological confirmed TB positivity rate on a customized geoportal for geospatial visualization and local stakeholder engagement in Uganda.
- Estimate the difference in yield (bacteriological confirmed TB cases/screened) by comparing predicted ‘hotspots’ with ‘non-hotspots.’
2. Materials and Methods
2.1. Study Design and Setting
A retrospective observational study was conducted on the data generated from community-based ACF interventions implemented under the United States Government (USG)-funded Local Partner Health Services for Tuberculosis (LPHS-TB) activity, led by the Infectious Diseases Institute (IDI) in collaboration with other implementing partners. The project data was collected between 30 January 2023 to 7 October 2025. The programme implementation involved national, subnational, and community stakeholders. The National Tuberculosis and Leprosy Control Program (NTLP) provided strategic oversight, while district, regional, and community civil society organizations managed demand creation, mobilization, logistical support for mobile services (van, digital X-rays), and patient linkage to care. Additional partners included USG-supported grants and The Global Fund.
ACF activities implemented multi-pronged interventions in 15 sub-regions (146 districts) across Uganda. These interventions included verbal screening for symptoms, mobile digital chest X-ray (DCXR), and CXR vans equipped with CAD (Computer Aided Diagnostics) for TB screening to identify presumptives, followed by GeneXpert testing for bacteriological confirmation, all in adherence with the national screening algorithm. At community level, the project engaged community-based civil society organizations (CSOs) and village health teams volunteers (VHTs) for contact tracing of index TB cases enrolled for treatment, community outreach, active case-finding, and sensitization meetings in the communities. This diverse coverage up to the community level ensured the model was trained on data from varied epidemiological and socio-economic contexts.
2.2. Inclusion and Exclusion Criteria
High-risk groups such as individuals in prisons, diabetic clinics, or HIV outpatient departments were screened at designated sites. However, for the purposes of our predictive modelling, we excluded data from these high-risk subgroups. This decision was made because their potentially higher yield could skew the results, making it difficult to accurately assess TB transmission patterns within the broader general community. Sub-parishes with a screening count below 25 individuals were excluded from the analysis to mitigate potential bias arising from low statistical power, which could result in unreliable yield estimates. Consequently, a total of 31 sub-parishes were excluded: 1 from the Northern region, 8 from the Western region, 13 from the Central region, and 9 from the Eastern region.
The ACF interventions aimed at the broader general population were conducted through community-based screening events, where all individuals regardless of risk factors or symptoms had the opportunity to be screened. While the intervention included both verbal- and X-ray-based screening to identify presumptive TB followed by bacteriological confirmation, we chose to use only chest X-ray-based screening and bacteriological confirmed cases from therein for modelling TB hotspots. Chest X-rays have higher sensitivity compared with verbal screening and can detect asymptomatic TB [16,17]; the final dataset could provide a better understanding of the actual distribution of undiagnosed TB in the community. This meant that we included 26% of the total data available from the screening intervention. Throughout this paper, Chest X-ray-based ACF data/events refer to individuals in the general community screened with a chest X-ray device followed by bacteriological confirmation with GeneXpert test. This includes all chest X-ray screenings, with and without verbal screening and both computer aided and human readings.
2.3. Input and Outcome Variables
The TB positivity rate was defined as the proportion of bacteriological confirmed TB cases from the total individuals screened by chest X-ray devices (observed yield), serving as the model training variable. Predicted TB positivity rate was the outcome of interest.
2.4. Covariates
Data regarding sociodemographic and human development indicators, recognized as factors linked to TB [18,19], were obtained from open-source platforms. The total population, encompassing females, males, and the elderly, was sourced from Facebook [20]. Population density was calculated as the number of people per square kilometre for each unit. Data on poverty, distance to major roads, were obtained from WorldPop [21]. Data on childhood vaccinations, including the full 8 basic vaccinations, DPT1 and 2, and the measles vaccine were obtained from spatially modelled data from Demographic and Health Surveys (DHS) [22]. Data on male and female literacy [23], childhood nutrition (percentage of underweight children) [24], and mortality under 5 [25] were obtained from Institute for Health Metrics and Evaluation (IHME). Access to water, sanitation availability [26], HIV prevalence [27], night-time lights [28], elevations [21], Gridded Relative Deprivation Index (GRDI) [29], and motorized travel time to a health facility [30] were also included in the assessment. Table 1 lists the variables, and more details are available in Table A1 in the Appendix A.
2.5. Resolution, Data Preparation, and Model Training
Uganda consists of four major regions: namely the Central, Eastern, Northern, and Western regions. These are further divided into 15 sub-regions referred to as health regions, which sub-divide into 146 districts, 312 counties, 2208 sub-counties, and 10,864 parishes. The parishes were further divided into smaller units called ‘sub-parishes’ by using the K-means clustering algorithm such that each sub-parish contained a population of approximately 10,000. The approach has been explained in more detail in another publication [12,14].
All variables listed in Table 1 were aggregated to the sub-parish level. They were then scaled to a rate form, providing each unit with a unique profile based on its local sociodemographic contextual information. Sub-parishes with a screening count lower than 25 were excluded from the analyses and modelling.
Chest X-ray-based ACF events were organized across 10,864 sub-parishes, the geo-coordinates of each event were shared by the implementing partners that enabled precise mapping. The model was trained on the observed sub-parish TB positivity rate to predict a TB positivity rate for all sub-parishes including those with observed data. The predicted output thus allowed for identification of other areas that could be prioritized for ACF activities.
2.6. Modelling Approach
We used a probabilistic Bayesian network regression model to estimate sub-parish TB positivity rates from observed chest X-ray screening outcomes and contextual covariates. The model represents the joint distribution of the target and predictors as a directed acyclic graph and is used here as a predictive model; it does not, on its own, support causal inference.
Candidate predictors were pre-specified from established determinants of TB transmission and access to care and comprised the contextual indicators listed in Table 1. Bayesian network structure was learned with causal-learn python package using the Peter-Clark (PC) algorithm for causal discovery with the Fisher-Z test for conditional independence and an alpha sensitivity setting of 0.9. A maximum parent cutoff of 5 parents to the target node were used, and nodes not directly connected to the target variable were pruned. The pgmpy python package [31] was used to fit linear Gaussian conditional probability distributions (CPDs) for parameter estimation were fitted using Maximum Likelihood Estimation (MLE). No informative Bayesian priors were specified in this analysis; parameters were estimated via MLE. Model inference was performed using propagation of evidence through the network’s linear Gaussian conditional probability distributions using pgmpy.
2.7. Model Evaluation and Comparison
To evaluate predictive performance, a fivefold cross-validation approach was applied across all sub-parishes in the country. The data were first partitioned into five groups (folds) using the GroupKFold method. For each iteration, four folds (80% of the data) were used to train a Bayesian model, while the remaining fold (20%) served as the validation set to test predictive accuracy. This process was repeated five times so that every sub-parish was used once for validation. Model accuracy and calibration were then assessed by comparing predicted TB positivity rates against the observed rates in the held-out folds.
To interpret hotspot performance, predictions were sorted by estimated positivity rate, and the top 30% of sub-parishes were classified as hotspots, and the remainder as non-hotspots, based on prior cross-country calibration. This 30% cut-off was selected a priori as an operational planning parameter, based on prior deployments and previously published work in Nigeria [12], where prioritizing approximately the top 30% of areas provided a pragmatic balance between concentrating screening resources and maintaining sufficient geographic coverage for implementation. We note that the hotspot threshold is a tuneable programme decision (rather than an intrinsic property of the model) and may be adapted to local screening capacity and coverage objectives; alternative thresholds such as 10%, 20%, or 40% could be used in other contexts. Based on the combined outputs across folds, relative yield metrics were computed: hotspot yield vs. non-hotspot yield (positives per screened), risk ratio, relative risk increase (RRI), risk difference, number needed to screen (NNS), and statistical significance via Fisher’s Exact Test.
Additionally, a stratified evaluation was conducted to assess model performance across the four major regions, to evaluate whether the predictive accuracy was consistent across distinct epidemiological contexts. Hotspots were identified based on the top 30% of predicted TB positivity rates, with the remaining 70% classified as non-hotspots.
Because observations are aggregated at the sub-parish level, neighbouring sub-parishes may exhibit spatial autocorrelation in both screening yield and predicted positivity. We did not explicitly adjust for spatial clustering in this internal validation; therefore, performance estimates and inferential comparisons should be interpreted with this dependence in mind.
3. Results
We analyzed chest X-ray screened ACF data aggregated across four regions: Central, Eastern, Northern, and Western. The four regions were subdivided into 146 districts, which were further divided into 10,864 parishes. Key metrics presented for each region are presented in Table 2. Across the country, a total of 33,427 individuals were screened using chest X-ray devices, of which 465 were diagnosed with bacteriological confirmed TB. Screening data was available for 3.63% of sub-parishes in the Central region and 1.21% in the Northern region.
The distribution of the number and proportion of hotspots and non-hotspots across the country by region are illustrated in Table 3. The Central region was subdivided into 1958 sub-parishes, of which 48.7% met the 30% cut-off, thus categorized as hotspots. The Western region had 2915 sub-parishes, of which 42.8% were categorized as hotspots.
We compared the difference in TB case-finding yield in predicted hotspots with non-hotspots, as shown in Table 4. Across the country, chest X-ray screening identified 215 TB positive individuals in hotspot areas (from 11,279 screened) and 250 in non-hotspot areas (from 22,148 screened), corresponding to a risk ratio of 1.69 (95% CI: 1.41–2.02; p < 0.001). At the regional level, risk ratios ranged from 1.52 (95% CI: 1.10–2.10; p = 0.011) in the Eastern region to 2.18 (95% CI: 1.32–3.60; p = 0.004) in the Central region. Statistically significant associations were observed in all four regions.
We mapped the predicted outputs on a customized geoportal for easy access for the stakeholders (Figure 1). The geoportal provides a range of functionalities, including hotspot filtering and integration with Google Maps, enabling local teams to effectively plan community-based interventions. Additionally, the use of a choropleth map facilitates more intuitive interpretation of results for users without technical expertise.
4. Discussion
This study presents an internal validation of a predictive hotspot mapping approach (the Epi-control platform) applied to Uganda. The platform uses a Bayesian network regression model that integrates ACF outcomes with contextual covariates to estimate and rank sub-parish-level TB positivity and is used here for prediction rather than causal inference. We compared the difference in TB case-finding yield in predicted hotspots with non-hotspots.
The model predicted a variable number of hotspots across regions, and hotspot areas showed higher observed ACF yield than non-hotspots in internal validation, indicating that the model concentrates observed yield under similar screening processes.
An analysis of the predicted hotspot distribution reveals that the highest number of hotspots were identified in the Central region (48.7%), followed by the Western regions (42.8%). Conversely, the Northern and Eastern regions exhibited the fewest predicted hotspots.
The Central region demonstrated the highest screening coverage, succeeded by the Eastern, Western, and Northern regions, respectively. According to Uganda’s 2002 census, the Central region accounted for 27% of the country’s population, the Western region 26%, the Eastern region 25%, and the Northern region 22%. Furthermore, the Central region contained 54% of the urban population (predominantly in Kampala), while the Northern, Western, and Eastern regions accounted for 17%, 14%, and 13% of the urban population, respectively [32]. Given the higher population density and urban settlements in the Central and Western regions, the model’s prediction of a greater proportion of hotspots in these areas aligns with the typical distribution of TB transmission, which tends to be higher in populous urban settings [33,34].
Henry et al. developed a spatial model utilizing TB prevalence survey data from 2014 to 2015, TB notification data from 2016 to 2019, and additional contextual covariates such as population estimates, household crowding, night-time light intensity, and travel time to health facilities, among others, to generate district-level TB estimates [4]. The geographic distribution produced by this model indicates that most high-burden districts were situated in the Northern and Central regions of the country, with some also identified in the Western region. Our model demonstrates that most hotspots are concentrated in the Central and Western regions, with several present in the east. Although there are certain similarities between the maps generated from both studies, direct comparison is not feasible due to differences in resolution (district versus sub-parish level), data sources, and modelling methodologies. The difference could also be attributed to the ACF data included in our analysis, we had the most extensive screening coverage in the Central region and the least in the Northern region. With ongoing programme implementation and updates to the dataset, the model’s outputs may undergo further refinement over time. Variations in the definition of hotspots can also lead to relative differences.
Aceng et al. conducted a study mapping district-level TB notifications over a ten-year period (2013–2022) [2]. Their findings reveal that Moroto and Napak districts in the north, as well as Kampala and Kalangala districts in the Central region, consistently reported high notification rates over several years. Our model’s results align with these observations, predicting multiple hotspots in these districts at the sub-parish level. Aceng et al.’s maps consistently show low notifications in Mbale and Soroti districts, this could be due to low reporting, inadequate screening, or genuinely low TB transmission; our model predicts Mbale district as a potential hotspot. Our ACF dataset included high screening coverage in this region together with the highest number of confirmed TB cases in the Eastern region. This highlighted an advantage of utilizing community-based active case-finding (ACF) data over notification data for identifying TB hotspots. By learning from both community-based interventions and local contextual data, the model facilitates a more comprehensive understanding of the population’s local health situations.
A significant burden of TB was predicted in large areas of the Western region (Table 1 and Figure 1). While some studies suggest the burden in this region is below the national average [4], our finding may alternatively indicate a higher prevalence of undetected TB, which is not captured by notification-based studies. Wynne et al. reported that the National TB control programme in the Western Uganda region encounters substantial challenges, with the healthcare system facing financial constraints that adversely affect timely diagnosis and patient outcomes [35]. The Western region shares borders with the Democratic Republic of Congo (DRC), Tanzania, Rwanda, and Burundi, potentially resulting in a high migrant population. This demographic group frequently experiences financial hardship, difficult living conditions, and systemic barriers to accessing and maintaining continuous care [36,37]. It is plausible that the model identified a potentially underserved region with an elevated risk of undiagnosed TB.
Based on Fisher’s Exact Test and relative yield metrics, ACF yield was 68% higher in predicted hotspots than non-hotspots in this internal validation, indicating that the model concentrates observed yield under the same screening dataset. In practical terms, for every 100 TB cases identified through routine screening methods, employing the Epi-control platform could lead to the identification of approximately 168 cases under similar conditions. Although ACF interventions are costly, targeting predicted hotspots may improve operational efficiency by prioritizing areas with higher observed yield per screened; cost-effectiveness and incremental impact require prospective study.
The geoportal developed to visualize predicted hotspots supports operational use of the model outputs by enabling stakeholders to review prioritized areas and associated contextual layers. The platform enhances the applicability of predictive outputs by allowing for targeted interventions in specific communities, which can lead to improved TB case notifications and optimized resource allocation. The portal also visualizes contextual data layers for further analysis and epidemiological insight.
This evaluation constitutes internal validation because both model training and evaluation are based on the ACF screening dataset. Accordingly, the hotspot–yield comparison should be interpreted as a test of whether the model concentrates observed yield under similar screening processes, rather than as evidence of causal effects.
Our approach had certain limitations and potential biases. Primarily, selection bias may have occurred because we relied on ACF screening data. This data includes individuals reached through organized outreach events, possibly underrepresenting remote, underserved, or stigmatized populations. In addition, ACF implementation is not uniform in space or time; therefore, predicted hotspots may partly reflect operational deployment patterns and screening intensity (e.g., where mobile units were deployed more frequently or where ACF activities were already concentrated or yielded higher detection), rather than underlying TB risk alone. While we included several contextual indicators to capture broader determinants of TB risk and access to care, residual selection and implementation bias may remain. In addition, spatial clustering of risk and of ACF operational deployment may induce correlation between nearby sub-parishes; we did not incorporate spatial random effects or spatially blocked resampling in the current analysis. As a result, statistical significance tests comparing hotspots versus non-hotspots may be overconfident, and we emphasize effect sizes (e.g., risk ratios) as descriptive measures within this internal validation framework. Although efforts were made to incorporate the most recent ACF data, obtaining high-resolution contextual data proved challenging. As a result, some datasets utilized in this model are more than five years old. While the use of older data may introduce uncertainties in the results, we are confident that the benefits of producing highly granular estimates outweigh the potential drawbacks associated with these data limitations. A wide range of data sources were integrated; however, certain potentially valuable datasets, such as those concerning actual notifications, prevalence survey, migration patterns, were unavailable at the requisite resolution. We consider these data sources to be highly beneficial for future modelling efforts and for assessing generalisability and incremental impact.
Utilizing ACF data for predictive modelling also offered a significant advantage. It allowed the model to learn the distribution of undiagnosed TB cases within the community, thereby potentially enhancing its ability to predict new ACF sites more effectively than facility-level notification data alone [12]. This approach minimizes the dependence on notification data and facilitates data-driven decision-making in low-resource environments.
This approach, a first for Uganda, involved predicting subnational TB hotspots at a sub-parish level. Therefore, it is hard to validate the predicted geographical distribution of high TB burden areas by comparing with existing evidence. However, studies that highlight the potential challenges or drivers of TB transmission in specific regions helped us understand whether the predicted distribution aligns with the available knowledge. The test of significance comparing yield in the hotspots with non-hotspots is therefore a satisfactory approach for a quantitative comparison. Overall, the platform showed internal validity in concentrating observed ACF yield in predicted hotspots and may support screening prioritization; external validation and prospective implementation studies are needed to assess generalisability and incremental impact.
The reference list from the paper itself. Each links out to its DOI / PubMed record.
- 1WHO WHO Conducts Mid-Term Review of Uganda’s Response to TB|WHO|Regional Office for Africa [Internet]2023 Available online: https://www.afro.who.int/countries/uganda/news/who-conducts-mid-term-review-ugandas-response-tb(accessed on 12 August 2025)
- 2Aceng F.L. Kabwama S.N. Ario A.R. Etwom A. Turyahabwe S. Mugabe F.R. Spatial distribution and temporal trends of tuberculosis case notifications, Uganda: A ten-year retrospective analysis (2013–2022)BMC Infect. Dis.2024244610.1186/s 12879-023-08951-038177991 PMC 10765632 · doi ↗ · pubmed ↗
- 3Ho J. Fox G.J. Marais B.J. Passive case finding for tuberculosis is not enough Int. J. Mycobacteriology 2016537437810.1016/j.ijmyco.2016.09.02327931676 · doi ↗ · pubmed ↗
- 4Henry N.J. Zawedde-Muyanja S. Majwala R.K. Turyahabwe S. Barnabas R.V. Reiner R.C.Jr. Moore C. Ross J. Mapping TB incidence across districts in Uganda to inform health program activities IJTLD Open 2024122322910.5588/ijtldopen.23.062439022779 PMC 11249603 · doi ↗ · pubmed ↗
- 5Ayabina D.V. Gomes M.G.M. Nguyen N.V. Vo L. Shreshta S. Thapa A. Codlin A.J. Mishra G. Caws M. The impact of active case finding on transmission dynamics of tuberculosis: A modelling study P Lo S ONE 202116 e 025724210.1371/journal.pone.025724234797864 PMC 8604297 · doi ↗ · pubmed ↗
- 6Sekandi J.N. List J. Luzze H. Yin X.P. Dobbin K. Corso P.S. Oloya J. Okwera A. Whalen C.C. Yield of undetected tuberculosis and human immunodeficiency virus coinfection from active case finding in urban Uganda Int. J. Tuberc. Lung Dis. Off. J. Int. Union. Tuberc. Lung Dis.201418131910.5588/ijtld.13.012924365547 PMC 5454493 · doi ↗ · pubmed ↗
- 7Robsky K.O. Kitonsa P.J. Mukiibi J. Nakasolya O. Isooba D. Nalutaaya A. Salvatore P.P. Kendall E.A. Katamba A. Dowdy D. Spatial distribution of people diagnosed with tuberculosis through routine and active case finding: A community-based study in Kampala, Uganda Infect. Dis. Poverty 202097310.1186/s 40249-020-00687-232571435 PMC 7310105 · doi ↗ · pubmed ↗
- 8Kazibwe A. Twinomugisha F. Musaazi J. Nakaggwa F. Lukanga D. Aleu P. Kiyemba T. Nkolo A. Kirirabwa N.S. Lopez D.B.F. Comparative yield of different active TB case finding interventions in a large urban TB project in central Uganda: A descriptive study Afr. Health Sci.20212197598410.4314/ahs.v 21i 3.335222557 PMC 8843286 · doi ↗ · pubmed ↗