Correction: DNAJB1-PRKACA fusion protein-regulated LINC00473 promotes tumor growth and alters mitochondrial fitness in fibrolamellar carcinoma
Rosanna K. Ma, Pei-Yin Tsai, Alaa R. Farghli, Alexandria Shumway, Matt Kanke, John D. Gordan, Taranjit S. Gujral, Khashayar Vakili, Manabu Nukaya, Leila Noetzli, Sean Ronnekleiv-Kelly, Wendy Broom, Joeva Barrow, Praveen Sethupathy

Abstract
Genes, proteins, chemicals, diseases, species, mutations and cell lines named across the full text — each resolved to its canonical identifier and authoritative record.
Click any figure to enlarge with its caption.
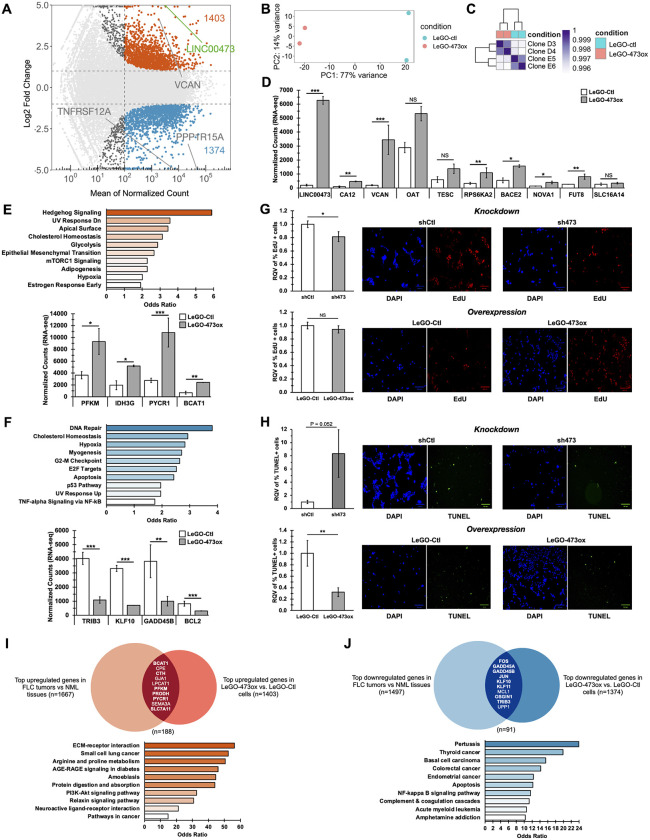 Figure 1
Peer Reviews
No public reviews on file for this paper yet. If you reviewed it on a platform where reviews are public (OpenReview, ICLR, NeurIPS, ICML), you can paste yours below so the community can read it here.
Videos
No videos yet. Explain this paper in a talk, walkthrough, or lecture? Add one.
Taxonomy
TopicsMitochondrial Function and Pathology · Ferroptosis and cancer prognosis · Cell death mechanisms and regulation
Following publication of this article [1], the following errors were noted in Fig 4, S3 Fig, and in the Materials and methods:
With this Correction, the authors provide a revised Fig 4 in which the incorrect panels are replaced with the correct images from the original experiments and the error bar in the Fig 4H (Knockdown) bar chart is also corrected.
The original images underlying Figs 4 and S3C are shared in S1-S3 Files. Individual-level quantitative data from the original experiments are available for Figs 4, 5, 6A-B, and S3D and are included here in S4-S6 Files.
The fifth and sixth sentences of the third paragraph in the 2. PDX tumors section of the Materials and methods are corrected to the following: Mice are monitored daily for signs of distress, such as poor grooming and weight loss until the endpoint, which is established when animals exhibit 20% body weight loss or greater, tumor burden starts to ulcerate, or animal body condition deteriorates with visible signs of pain/distress; animals are unable to sleep, eat or ambulate. Tumor size will be monitored and euthanasia is determined in consultation with CARE veterinarians. Mice are subsequently euthanized using carbon dioxide administration for tumor collection, which is divided for propagating tumor passaging. Individual animals are placed into a clean cage and are administered carbon dioxide at a flow rate of 3.5 L/min. Mice are removed from the cage after respirations cease for a period of one minute.
Supporting information
S1 FileFig 4G underlying images.This file includes the original images underlying Fig 4G; Representative images of DAPI- and EdU-stained FLC cells.(ZIP)
S2 FileFig 4H underlying images.This file includes the original images underlying Fig 4H; Representative images of DAPI- and TUNEL-stained FLC cells.(ZIP)
S3 FileFig S3C underlying images.This file includes the original images underlying Fig S3C; Representative immunoblot of protein expression of DNAJB1- PRKACA (DP) fusion is detected with a protein kinase A catalytic α subunit (PKA) antibody. Lane 1, siDP#1-LNP; Lane 2, siDP#2-LNP; Lane 3, siLuciferase (siLuc-LNP) negative control; Lane 4, mock negative controls following 250nM treatment.(ZIP)
S4 FileFig 4 underlying quantitative data.This file includes the original quantitative data underlying Fig 4; (A) RNA-seq data from FLC cells that stably overexpress LINC00473 (LeGO-473ox) relative to empty vector control (LeGO-Ctl). These data are used to plot Figs 4A-4F, and 4I-4J. (B) Fig 4D-4F: Normalized counts for specific FLC marker genes from RNA-seq from LeGO-473ox and LeGO-Ctl control FLC monoclonal cells. (C) Fig 4E: MSigDB Hallmark pathway enrichment analysis of significantly upregulated genes (n = 1403). (D) Fig 4F: MSigDB Hallmark pathway enrichment analysis of significantly downregulated genes (n = 1374). (E) Fig 4G: Quantification of EdU incorporation in FLC cells with stable LINC00473 knockdown (sh473) or overexpression (LeGO-473ox) relative to their respective controls (shCtl, LeGO-Ctl). (F) Fig 4H: Quantification of TUNEL staining in FLC cells with stable LINC00473 knockdown (sh473) or overexpression (LeGO-473ox) relative to their respective controls (shCtl, LeGO-Ctl). (G) Fig 4I: Gene list overlap analysis using significantly upregulated genes in FLC tumors relative to NML (n = 1667), and in LeGO-473ox cells relative to control (n = 1403). Bolded genes indicate proteins related to metabolism. Includes KEGG pathway enrichment analysis of the intersecting 188 genes. Significance of the overlap (p = 4.81x10^-20^) was calculated by hypergeometric test. (H) Fig 4J: Gene list overlap analysis using significantly downregulated genes in FLC tumors relative to NML (n = 1497), and in LeGO-473ox cells relative to control (n = 1374). Bolded genes indicate proteins related to apoptosis. Includes KEGG pathway enrichment analysis of the intersecting 91 genes. Overlap of n = 91 genes was not significant following a hypergeometric test.(ZIP)
S5 FileFig 5 underlying quantitative data.This file includes the original quantitative data underlying Fig 5; (A) Fig 5A: Representative graph of extracellular acidification rate (ECAR) of FLC cells with stable LINC00473 overexpression (LeGO-473ox) and empty vector control (LeGO-Ctl). (B) Fig 5B: Quantification of glycolysis, glycolytic capacity and glycolytic reserve in LINC00473-overexpression (LeGO-473ox) FLC cells compared to empty-vector control (LeGO-Ctl). (C) Fig 5C: Representative graph of ECAR of FLC cells with stable LINC00473 knockdown (sh473) and non-targeting control (shCtl). (D) Fig 5D: Quantification of glycolysis, glycolytic capacity and glycolytic reserve in LINC00473-knockdown (sh473) FLC cells compared to non-targeting control (shCtl). (E) Fig 5E: Representative graph of oxygen consumption rate (OCR) of FLC cells with overexpression (LeGO-473ox) and control (LeGO-Ctl). (F) Fig 5F: Quantification of basal respiration, maximum respiration capacity, and spare respiratory capacity in LINC00473-overexpression (LeGO-473ox) FLC cells compared to empty-vector control (LeGO-Ctl). (G) Fig 5G: Representative graph of OCR of FLC cells with stable LINC00473 knockdown (sh473) and non-targeting control (shCtl). (H) Fig 5H: Quantification of basal respiration, maximum respiration capacity, and spare respiratory capacity in LINC00473-knockdown (sh473) FLC cells compared to non-targeting control (shCtl).(ZIP)
S6 FileFig 6A-B underlying quantitative data.This file includes the original quantitative data underlying Fig 6A-B. Tumor length and width data are expressed in mm units and tumor volume as mm^3^.(XLSX)
S7 FileFig S3D underlying quantitative data.This file includes the original quantitative data underlying Fig S3D; fold change and densitometry of immunoblot of protein expression of DP fusion and WT PKA via densitometry of the blot in Fig S3C, relative to siLuc negative control (n = 1).(XLSX)
S3 FigSilencing of the DP fusion.(A, C) Representative immunoblot of protein expression of DNAJB1- PRKACA (DP) fusion is detected with a protein kinase A catalytic α subunit (PKA) antibody. WT PKAc, DP fusion major, and DP fusion minor are identified. Lane 1, siDP#1-LNP; Lane 2, siDP#2-LNP; Lane 3, siLuciferase (siLuc-LNP) negative control; Lane 4, mock negative controls following 1.25nM treatment (A) or 2.50nM treatment (C) with siRNA-LNPs or mock condition over 96 hours. Vinculin loading control is shown in the lower panel and run on the same blot**. (B, D)** Fold change of protein levels of the blot in panel A (B) and panel C (D), relative to siLuc negative control (n = 1). (E) Representative immunoblot of protein expression of WT DNAJB1. Lane 1, siDP#1-LNP; Lane 2, siDP#2-LNP; Lane 3, siLuciferase (siLuc-LNP) negative control; Lane 4, mock negative control. siRNA-LNP treatments at 5nM, or mock condition, over 96 hours. Vinculin loading control is shown in the lower panel and run on the same blot (n = 3). (F) Gene expression from RT-qPCR following free uptake of siDP#1-LNP, siDP#2-LNP, and siLuc-LNP at 5nM treatment over 96 hours in FLC cells, as shown in Fig 3F (n = 3). Data are represented as mean ± SD. P values are calculated by 2-tailed Student’s t-test. *p < 0.05, **p < 0.01, ***p < 0.001.(PDF)
The reference list from the paper itself. Each links out to its DOI / PubMed record.
- 1Ma RK, Tsai P-Y, Farghli AR, Shumway A, Kanke M, Gordan JD, et al. DNAJB 1-PRKACA fusion protein-regulated LINC 00473 promotes tumor growth and alters mitochondrial fitness in fibrolamellar carcinoma. P Lo S Genet. 2024;20(3):e 1011216. doi: 10.1371/journal.pgen.1011216 38512964 PMC 11020935 · doi ↗ · pubmed ↗