The Prognostic Value of Dynamic Changes in Prognostic Nutritional Index (PNI) During Treatment in Lung Cancer: Is Improvement a Better Predictor than Baseline?
Eren Mingsar, İlhan Öztop, Sinan Ünal

TL;DR
This study shows that improving nutritional and immune status during lung cancer treatment, as measured by the PNI, is linked to better survival outcomes.
Contribution
The study introduces the dynamic change in PNI during treatment as a novel prognostic indicator in lung cancer.
Findings
Higher baseline and posttreatment PNI scores correlate with longer overall and progression-free survival.
Patients with increased PNI during treatment had significantly better overall survival than those with stable or decreased PNI.
Dynamic PNI improvement is a critical indicator of better clinical outcomes in lung cancer patients.
Abstract
Objective: Although the baseline prognostic nutritional index (PNI) is a well-known prognostic factor in lung cancer, the clinical significance of its fluctuation during treatment remains unclear. This study aimed to evaluate the prognostic value of dynamic changes in the PNI and to determine whether improvements in nutritional and immune status are correlated with survival outcomes. Methods: A total of 478 patients diagnosed with lung cancer were retrospectively analyzed. The PNI was calculated on the basis of serum albumin levels and total lymphocyte counts. The baseline value was termed PNI1, and the posttreatment value was termed PNI2. The dynamic changes in PNIΔ were categorized as increased, stable, or decreased. Relationships between these dynamic parameters and Overall Survival and Progression-Free Survival were assessed using Kaplan–Meier and Cox regression analyses. Results:…
Genes, proteins, chemicals, diseases, species, mutations and cell lines named across the full text — each resolved to its canonical identifier and authoritative record.
Click any figure to enlarge with its caption.
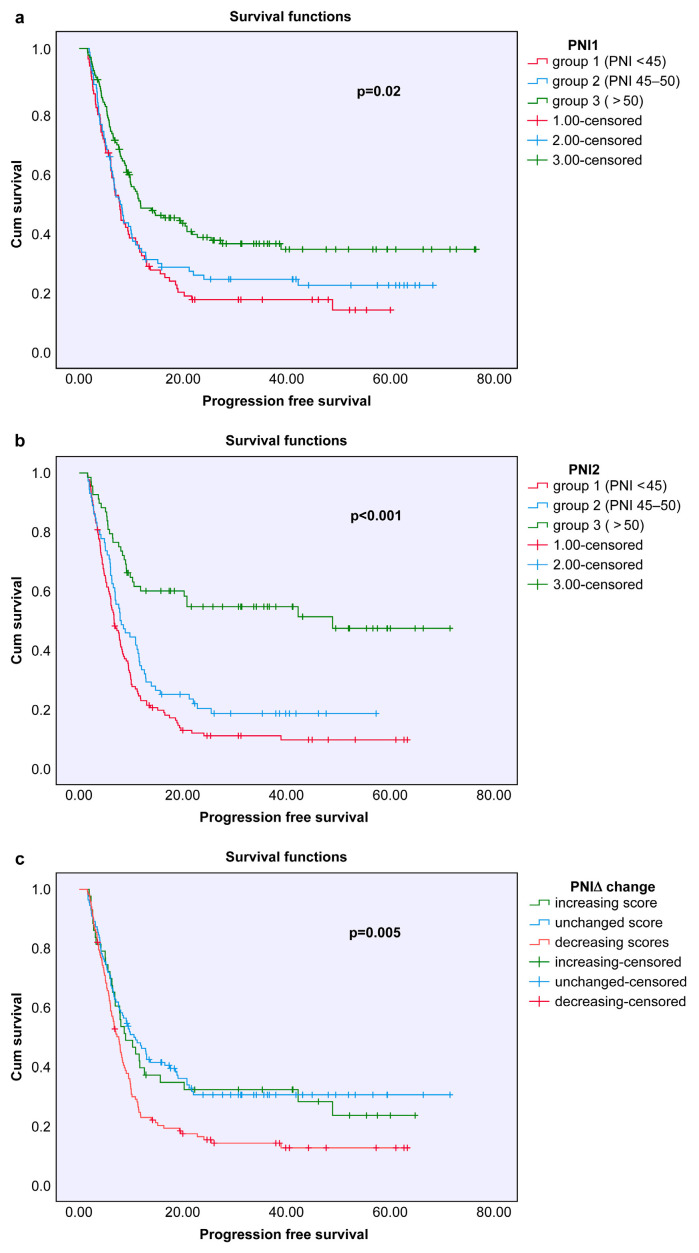 Figure 1
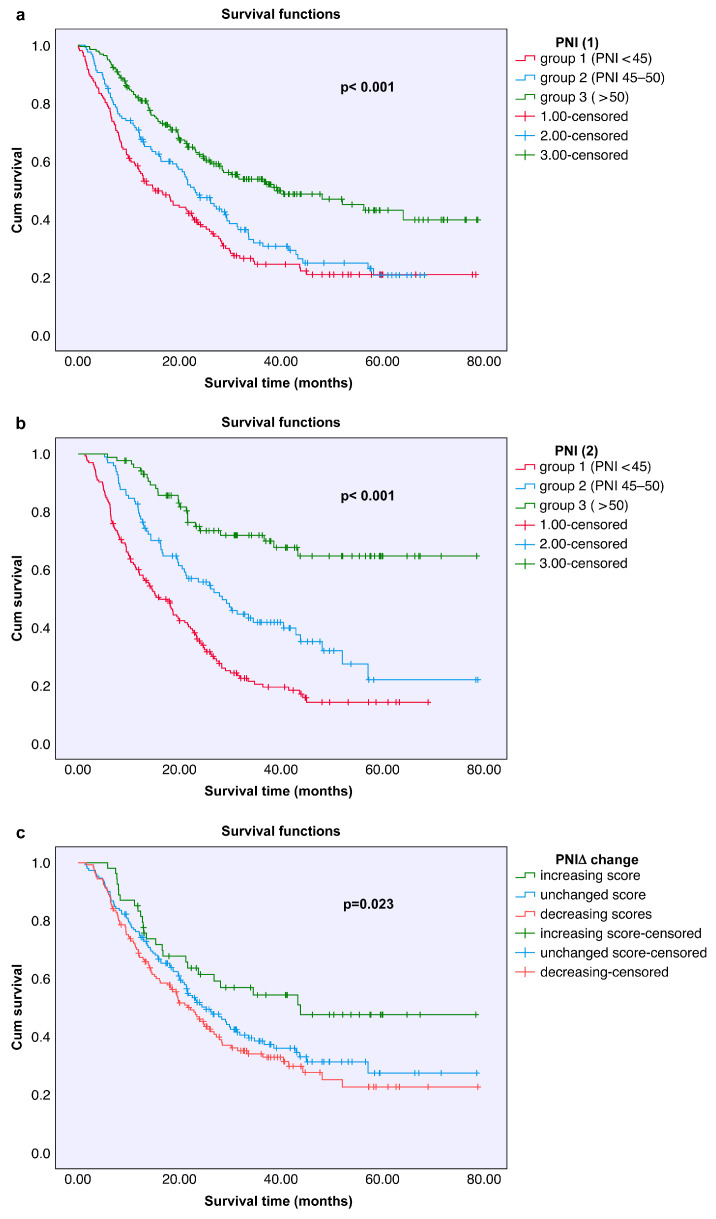 Figure 2
Peer Reviews
No public reviews on file for this paper yet. If you reviewed it on a platform where reviews are public (OpenReview, ICLR, NeurIPS, ICML), you can paste yours below so the community can read it here.
Videos
No videos yet. Explain this paper in a talk, walkthrough, or lecture? Add one.
Taxonomy
TopicsInflammatory Biomarkers in Disease Prognosis · Nutrition and Health in Aging · Ferroptosis and cancer prognosis
1. Introduction
Lung cancer remains among the most commonly diagnosed cancers worldwide and continues to be a leading cause of cancer-related mortality. According to data from 2020, more than 2.2 million new cases of lung cancer were reported globally, with approximately 1.8 million deaths attributed to the disease. The overall prognosis of lung cancer is poor, with five-year survival rates generally ranging between 10% and 20%. Most patients are diagnosed at an advanced stage, which significantly limits treatment success and survival outcomes [1]. In Turkey, lung cancer remains a significant public health burden. Recent national data indicate that it is the leading cause of cancer-related mortality and incidence, particularly among men, highlighting the urgent need for effective prognostic markers in this population [2]. Although recent advances in targeted therapies and immunotherapy have led to improvements in survival, reliably predicting prognosis in lung cancer patients remains a critical need. In the diagnostic and treatment process, in addition to clinicopathological factors such as age, sex, performance status, weight loss, and tumor stage, laboratory-based biomarkers play important roles in predicting prognosis [3,4,5,6].
Common conditions in cancer patients, such as anorexia, weight loss, and cachexia, not only deteriorate quality of life but also negatively affect survival. These findings emphasize the critical role of nutritional status in influencing patient outcomes [7,8].
Although complex systems for evaluating nutritional status that incorporate clinical, laboratory, and anthropometric parameters exist, simpler and more practical scoring systems have been developed [9,10]. One such system is the prognostic nutritional index (PNI), which is calculated by combining serum albumin levels and total lymphocyte count and serves as a practical tool reflecting a patient’s nutritional and immune status. Initially developed to assess surgical risk, the PNI score has since been used as a prognostic indicator in various malignancies. However, data concerning the impact of dynamic changes in the PNI during treatment on prognosis remain limited [11].
This study aimed to investigate the effects of pre- and posttreatment PNI values on treatment response and survival in patients diagnosed with lung cancer and to evaluate the prognostic significance of dynamic PNI monitoring.
2. Materials and Methods
2.1. Study Population and Baseline Data
This retrospective cohort study included patients diagnosed with lung cancer who were followed and treated at the Department of Medical Oncology, Dokuz Eylul University Faculty of Medicine, between January 2012 and December 2017.
The following criteria were applied for patient selection: histopathological confirmation of lung cancer at the time of diagnosis; availability of adequate laboratory data before and after treatment; and the absence of systemic conditions that could affect the treatment process, such as severe infections, hematological malignancies, or uncontrolled autoimmune diseases.
Patient demographic data (age, sex, and smoking status), histological type and stage of the tumor, surgical and systemic treatment details, laboratory parameters (serum albumin concentration and total lymphocyte count), treatment response, progression, and date of death were obtained from hospital records. No specific time cutoff was applied for exclusion on the basis of follow-up duration. The follow-up period continued until the patient’s death or the last recorded clinical visit.
2.2. PNI Analyses
The prognostic nutritional index (PNI) was calculated using the standard formula established by Onodera et al. [12]: PNI = 10 × serum albumin (g/dL) + 0.005 × total lymphocyte count (per mm^3^) [12].
The baseline PNI, termed PNI1, was determined on the basis of laboratory results obtained within one week prior to surgery or before the initiation of first-line systemic therapy. The posttreatment PNI, termed PNI2, was assessed using data obtained after the second postoperative week for surgical patients or two weeks following the completion of first-line chemotherapy for patients receiving systemic treatment. The dynamic change between these time points was termed PNIΔ (PNI2-PNI1).
Receiver operating characteristic (ROC) curve analysis was conducted to evaluate the prognostic discriminatory ability of the PNI. The analysis yielded an area under the curve (AUC) of 0.648 (95% CI: 0.598–0.699; p < 0.001), with an optimal mathematical cutoff value of 49.3 determined by the Youden index (0.247). Although this optimal threshold was higher than the cutoff of 40 originally proposed by Onodera et al., relying on a single dataset-specific value carries a risk of statistical overfitting. Therefore, to ensure consistency with established risk stratification models and to evaluate the graded prognostic impact of nutritional status, patients were stratified into three standard categories on the basis of PNI score: <45, 45–50, and >50.
2.3. Response Evaluation
Treatment responses of all patients were evaluated according to the Response Evaluation Criteria in Solid Tumors (RECIST) 1.1 protocol. Response categories included complete response, partial response, stable disease, and progressive disease. The tumor response was evaluated according to the Response Evaluation Criteria in Solid Tumors (RECIST) version 1.1 criteria using contrast-enhanced computed tomography (CT) or positron emission tomography-computed tomography (PET-CT) scans [13]. Response categories included complete response, partial response, stable disease, and progressive disease.
2.4. Statistical and Survival Analyses
Statistical analyses were performed using SPSS version 26.0 (IBM Corp., Armonk, NY, USA). Continuous variables are expressed as the mean ± standard deviation and median (25th–75th percentiles), and categorical variables are expressed as the frequency and percentage. The distribution of the data was assessed with the Kolmogorov–Smirnov test. The relationships between clinicopathological variables and PNI groups were analyzed using one-way ANOVA.
Survival analyses were conducted using the Kaplan–Meier method, and differences between groups were compared with the log-rank test. Overall survival (OS), disease-free survival (DFS), and progression-free survival (PFS) were defined. To identify independent prognostic factors affecting survival, multivariate analysis was performed using the Cox proportional hazards regression model (forward-conditional method). A p value of <0.05 was considered to indicate statistical significance. The optimal cutoff values for the PNI were determined using receiver operating characteristic (ROC) curve analysis. The Youden index (sensitivity + specificity − 1) was used to identify the threshold with the maximum predictive power for overall survival.
3. Results
3.1. Demographic and Clinical Results
A total of 478 lung cancer patients were included in the study. Among them, 382 (80%) were male and 96 (20%) were female. The mean age was 63.7 ± 10.1 years, and the median age was 64 years. Among the patients, 83.6% were diagnosed with non-small cell lung cancer (NSCLC), while 16.4% had small cell lung cancer (SCLC).
Among the NSCLC patients, the most common histological subtype was adenocarcinoma (42%), followed by squamous cell carcinoma (30%). At diagnosis, 26% of the NSCLC patients had stage I–II disease, 18% had stage III disease, and 56% had stage IV disease. In contrast, 28% of SCLC patients were at the limited stage, and 72% were at the extensive stage. The median follow-up duration for the entire cohort was 19.9 months, and the median overall survival was 24.3 months. The demographic and clinical characteristics of the patients are summarized in Table 1.
3.2. PNI Results
The pretreatment PNI1 values measured across all patients ranged from a minimum of 26.5 to a maximum of 111.0, with a median of 47.7. The median PNI1 value was 48.5 in patients with non-small cell lung cancer (NSCLC) and 47.9 in those with small cell lung cancer (SCLC).
Posttreatment PNI2 values ranged from a minimum of 18.5 to a maximum of 64.6, with a median value of 45.3 for the entire cohort. The median PNI2 values were 45.0 in NSCLC patients and 45.7 in SCLC patients. The difference between PNI1 and PNI2, referred to as PNIΔ, had a median value of 3.9 across all patients. On the basis of PNIΔ, patients were grouped as follows: 16% (n = 54) showed increased PNIΔ, 43% (n = 152) showed stable PNIΔ, and 41% (n = 145) showed decreased PNIΔ. All the PNI values and their distributions are presented in Table 2.
3.3. Response and Survival Outcomes
The treatment response of 297 NSCLC patients and 78 SCLC patients who received systemic therapy was evaluated according to the RECIST 1.1 criteria. Among the NSCLC patients, the overall response rate (ORR) to first-line chemotherapy was 64.6%, with a complete response (CR) rate of 2.5% and a partial response (PR) rate of 62.1%. In SCLC patients, the ORR was 39.8%, with 10.3% achieving CR and 29.5% achieving PR.
For the 103 NSCLC patients who underwent surgery at an early stage, the median disease-free survival (DFS) was 30.6 months, and the median overall survival (OS) was 36.3 months. In patients with locally advanced or metastatic NSCLC, the median progression-free survival (PFS) was 7.0 months, and the median OS was 16.6 months. In SCLC patients, the median PFS was 7.8 months, while the median OS was 14.1 months. Progression-free survival analyses according to age, sex, and cancer subtype subgroup are presented in Figure 1.
3.4. Relationships Between PNI Values and Survival
In survival analyses based on the PNI1, PNI2, and PNIΔ groups, no statistically significant relationship was observed between disease-free survival (DFS) and PNI scores in early-stage NSCLC patients (PNI1: p = 0.53; PNI2: p = 0.54; PNIΔ: p = 0.23). However, in patients with locally advanced or metastatic NSCLC, a significant association was found between PNI1 and PNI2 values and progression-free survival (PFS) (PNI1: p = 0.027; PNI2: p = 0.006), whereas PNIΔ was not significantly related (p = 0.42). Among SCLC patients, no significant association was identified between PNI score and PFS (PNI1: p = 0.27; PNI2: p = 0.54; PNIΔ: p = 0.87).
Overall survival analyses revealed that patients with higher PNI1 and PNI2 scores had significantly longer survival durations (both p < 0.001). Additionally, patients whose PNIΔ increased after treatment had significantly longer survival than those whose PNIΔ was stable or decreased (p = 0.023). Survival analyses according to PNI groups are presented in Table 3 and Table 4, and Kaplan–Meier curves are shown in Figure 2.
Univariate analyses revealed significant associations between overall survival and PNI1, PNI2, PNIΔ, tumor type, patient sex, and patient age. On the basis of these findings, a multivariate analysis covering the entire patient group was conducted using the Cox regression model. According to the results of the multivariate analysis, two independent variables significantly affected survival duration: cancer type and posttreatment PNI2 score. Patients with non-small cell lung cancer (NSCLC) histology had significantly longer survival (p = 0.003). Furthermore, patients with a PNI2 score <45 had notably shorter survival (p = 0.007). These results indicate that both the histopathological type of cancer and nutritional status independently influence prognosis. The detailed results of the multivariate Cox regression analysis are presented in Table 5.
4. Discussion
In this study, we investigated the relationships between the prognostic nutritional index (PNI) values calculated before and after treatment and overall survival and treatment response in patients diagnosed with lung cancer. Our findings revealed that high PNI1 and PNI2 values were positively associated with overall survival. Additionally, patients whose PNIΔ scores increased had significantly longer survival durations. These results support the prognostic significance of nutritional and immune status. The PNI was originally proposed by Onodera et al. for the prediction of postoperative complications in patients undergoing gastrointestinal surgery [12]. With respect to the timing of the posttreatment assessment, PNI2 was measured two weeks after treatment completion. This time point was chosen to evaluate the early nutritional and immunological recovery status of the patients before the initiation of subsequent therapeutic lines or long-term convalescence. However, we acknowledge that acute treatment-induced inflammation might persist at this stage, potentially influencing albumin levels and lymphocyte counts. While a later measurement (e.g., at 3 or 6 months) could reflect a more stabilized baseline, the two-week mark offers clinical utility as an early indicator for identifying high-risk patients who may require immediate nutritional intervention.
Subsequent studies have demonstrated the prognostic value of the PNI in various cancer types, especially gastrointestinal, pancreatic, hepatocellular, and hematologic malignancies [14,15,16]. In a study conducted by K. Migita et al. on patients with gastric cancer, a PNI cutoff value of 48 was identified via receiver operating characteristic (ROC) analysis [17]. Clinical studies have shown that PNI scores can be stratified on the basis of patient population. Similarly, in our study, dynamic calculation of the PNI was potentially effective for evaluating prognosis both at the individual level and in general populations. An examination of the association between pretreatment PNI1 values and overall survival revealed that patients with higher PNI1 scores had significantly longer survival. The log-rank test revealed a statistically significant difference (χ^2^ = 30.7; p = 0.001). Although studies encompassing all lung cancer patients remain limited in the literature, the number of such investigations is gradually increasing. For example, a study by Oku et al. (2023) also revealed that the pretreatment PNI is a strong predictor of survival [18].
High posttreatment PNI2 scores were also associated with long overall survival in our cohort. Moreover, multivariate analysis revealed that PNI2 is an independent prognostic factor. This finding is supported by the study conducted by Nishihara-Kato et al. [19]. Upon comparing the PNI values before and after treatment, 353 patients were categorized into groups on the basis of increasing, decreasing, and stable PNIΔ scores. Kaplan–Meier analysis indicated that patients with increased PNIΔ scores had significantly longer overall survival (p = 0.023). Although dynamic changes in the PNI (PNIΔ) were significantly associated with overall survival according to the univariate analysis, it did not emerge as an independent prognostic factor in the multivariate analysis. Therefore, PNIΔ should be interpreted as a complementary and exploratory biomarker rather than a definitive independent predictor. Similarly, Lei et al. (2024) reported that changes in the PNI were associated with progression-free survival [20].
A study involving NSCLC patients treated with PD-1 inhibitors revealed that the PNI is a predictor of early progression [21]. Similarly, a meta-analysis evaluating NSCLC patients receiving immune checkpoint-based therapy demonstrated a significant association between pretreatment PNI and progression-free survival [22].
Collectively, these findings highlight that while the posttreatment PNI serves as a robust independent prognostic marker, evaluating dynamic changes (PNIΔ) provides valuable additional insight into the patient’s clinical trajectory. Thus, the PNI serves as an independent prognostic marker for predicting overall survival, progression-free survival, and treatment response. Our findings are in accordance with the current literature.
5. Conclusions and Recommendations
In this study, the relationships between prognostic nutritional index (PNI) values, which were calculated before and after treatment, and survival and treatment response in patients with lung cancer were comprehensively assessed. Our findings indicate that high PNI1 and PNI2 values are positively associated with overall survival and progression-free survival. Furthermore, increases in the PNI during the treatment course may indicate a better prognosis, which aligns with findings from the contemporary literature. Nonetheless, the study has several limitations. First, its retrospective and single-center design may affect the generalizability of the results. Second, the exclusion of patients with early mortality introduces potential immortal time bias, as those who died before the second assessment could not be included in the dynamic analysis. Third, the study population was heterogeneous and included both NSCLC and SCLC patients with varying disease stages. Finally, although the PNI is a nutritional marker, we could not perform a detailed adjustment for potential confounders such as body mass index (BMI) and comorbidities such as diabetes mellitus, which are known to influence systemic inflammation and nutritional status. These factors should be considered in future prospective studies.
In conclusion, the PNI may serve as a valuable and dynamic biomarker for predicting prognosis and treatment response in patients with lung cancer, regardless of cancer subtype. The findings from this study suggest that monitoring the PNI at baseline and during treatment may provide meaningful insights for patient management. In particular, pre- and posttreatment changes in the PNI could help estimate treatment response and disease trajectory. Future research should focus on larger, multicenter prospective studies to further explore the role of the PNI in treatment planning and individualized oncology approaches. Furthermore, combining the PNI with other biomarkers may increase its predictive power.
The reference list from the paper itself. Each links out to its DOI / PubMed record.
- 1Sung H. Ferlay J. Siegel R.L. Laversanne M. Soerjomataram I. Jemal A. Bray F. Global Cancer Statistics 2020: GLOBOCAN Estimates of Incidence and Mortality Worldwide for 36 Cancers in 185 Countries CA Cancer J. Clin.20217120924910.3322/caac.2166033538338 · doi ↗ · pubmed ↗
- 2Kanser İstatistikleri Available online: https://hsgm.saglik.gov.tr/depo/birimler/kanser-db/Dokumanlar/Istatistikler/Turkiye_Kanser_Istatistikleri_2020.pdf(accessed on 28 January 2026)
- 3Addario B.J. Lung cancer is a global epidemic and requires a global effort Ann. Transl. Med.201532610.3978/j.issn.2305-5839.2015.01.2025738146 PMC 4322162 · doi ↗ · pubmed ↗
- 4Watine J. Paesmans M. Sculier J.P. Prognostic factors for patients with small cell lung carcinoma Cancer 20029457657710.1002/cncr.1024311900243 · doi ↗ · pubmed ↗
- 5Dharma-Wardene M. Au H.J. Hanson J. Dupere D. Hewitt J. Feeny D. Baseline FACT-G score is a predictor of survival for advanced lung cancer Qual. Life Res.2004131209121610.1023/B:QURE.0000037481.36604.eb 15473499 · doi ↗ · pubmed ↗
- 6Smit E.F. Groen H.J.M. Splinter T.A.W. Ebels T. Postmus P.E. New prognostic factors in resectable non-small cell lung cancer Thorax 19965163810.1136/thx.51.6.6388693450 PMC 1090499 · doi ↗ · pubmed ↗
- 7Arthur S.T. Van Doren B.A. Roy D. Noone J.M. Zacherle E. Blanchette C.M. Cachexia among US cancer patients J. Med. Econ.20161987488010.1080/13696998.2016.118164027100202 · doi ↗ · pubmed ↗
- 8Stanley K.E. Prognostic Factors for Survival in Patients with Inoperable Lung Cancer JNCI J. Natl. Cancer Inst.198065253210.1093/jnci/65.1.256930515 · doi ↗ · pubmed ↗