Hybrid Computational Framework Integrating Ensemble Learning, Molecular Docking, and Dynamics for Predicting Antimalarial Efficacy of Malaria Box Compounds
Martín Moreno, Sebastián A. Cuesta, José R. Mora, Edgar A. Márquez Brazon, José L. Paz, Guillermin Agüero-Chapin, Noel Pérez-Pérez, César R. García-Jacas

TL;DR
This paper introduces a computational framework combining machine learning and molecular simulations to predict and understand the antimalarial activity of compounds.
Contribution
A novel hybrid framework integrating ensemble learning, molecular docking, and dynamics for antimalarial compound prediction and mechanism analysis.
Findings
An ensemble classifier achieved high accuracy (Acc10-fold = 0.738) in categorizing compounds as active or very active.
Molecular docking and dynamics simulations identified strong binding affinities and stable ligand–protein complexes for several compounds.
Compound M31 showed stable binding despite poor docking scores, suggesting a competitive inhibition mechanism.
Abstract
The emergence of drug-resistant strains of Plasmodium falciparum continues to challenge global malaria control efforts, underscoring the urgent need for novel therapeutic strategies. In this study, we present an integrative computational framework that combines ensemble machine learning, molecular docking, and molecular dynamics simulations to predict and characterize the antimalarial activity of compounds from the Malaria Box database. Initially, topographical and quantum mechanical descriptors were used to construct regression models for predicting pEC50 values, but due to the limited predictive performance in the global regression, a classification strategy was adopted, categorizing compounds into “active” and “very active” classes. The best ensemble classifier achieved robust performance (Acc10-fold = 0.738, Accext = 0.675), with good sensitivity and specificity over individual…
Genes, proteins, chemicals, diseases, species, mutations and cell lines named across the full text — each resolved to its canonical identifier and authoritative record.
Click any figure to enlarge with its caption.
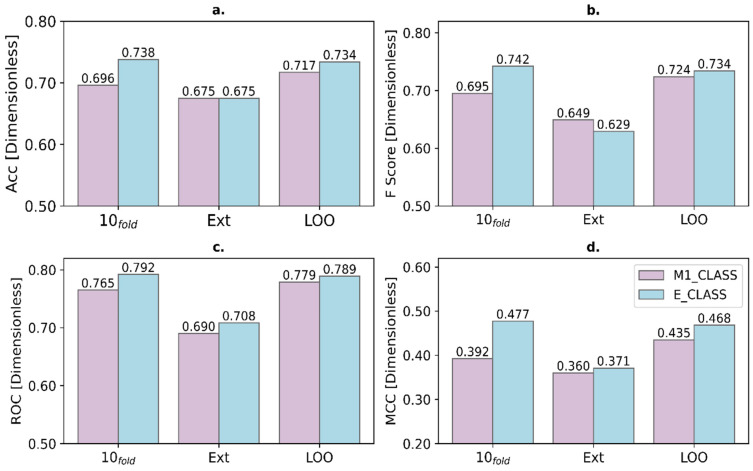 Figure 1
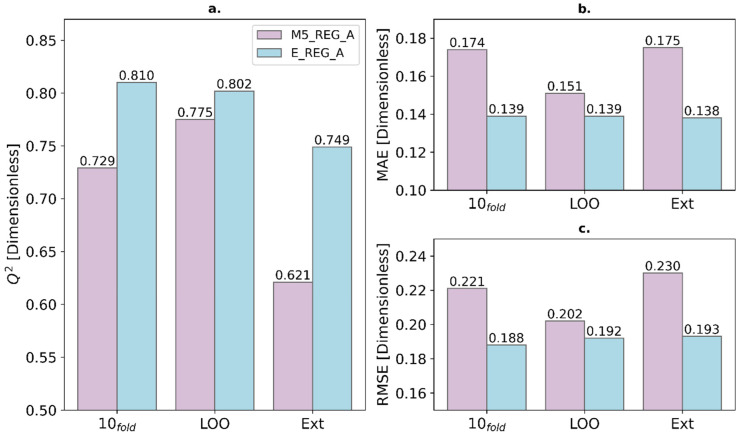 Figure 2
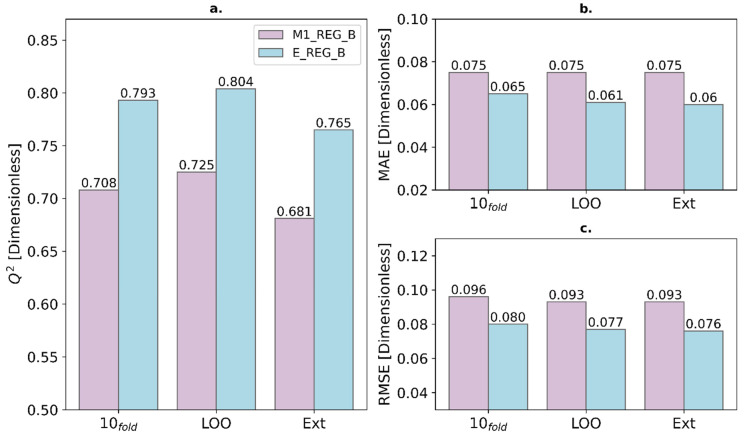 Figure 3
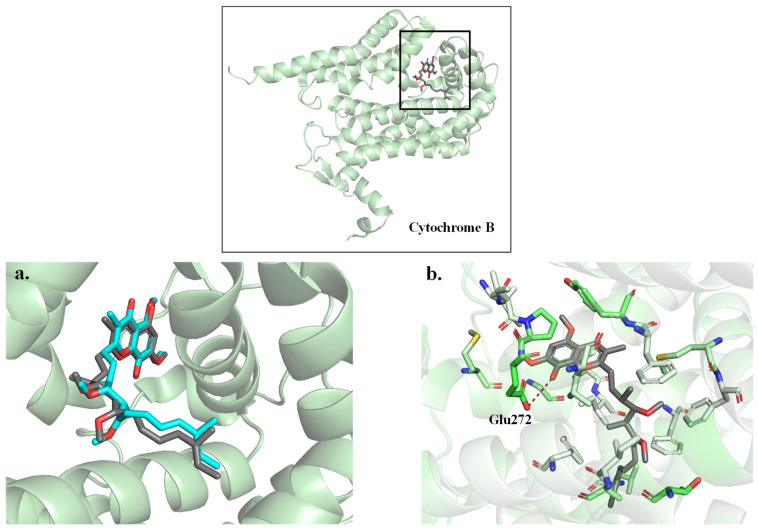 Figure 4
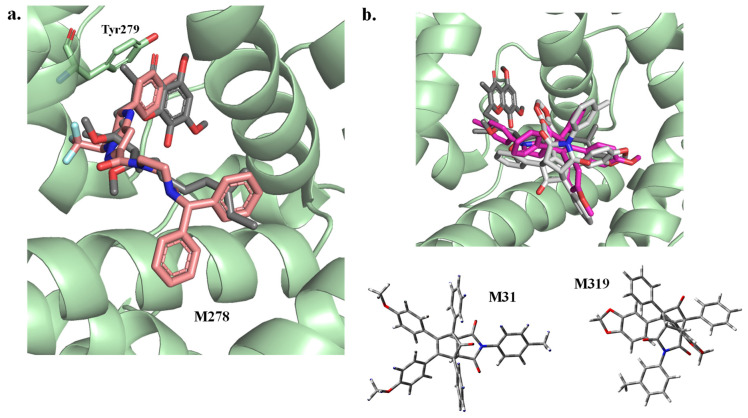 Figure 5
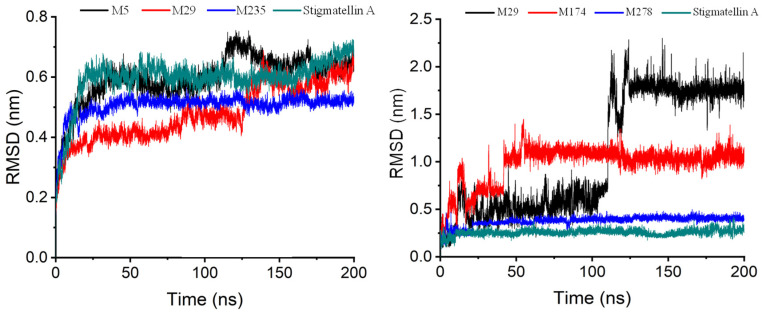 Figure 6
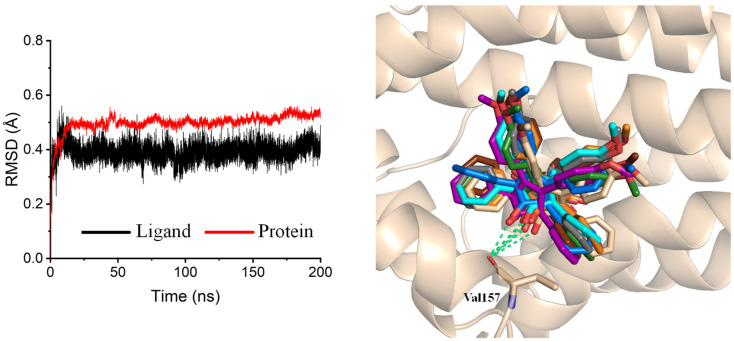 Figure 7
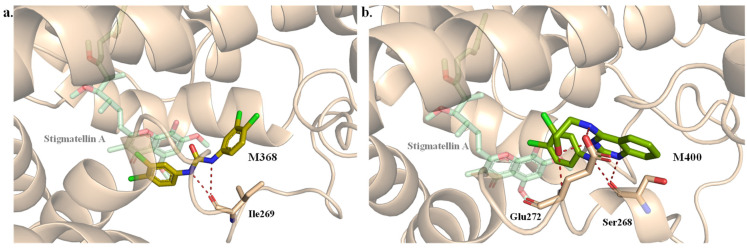 Figure 8
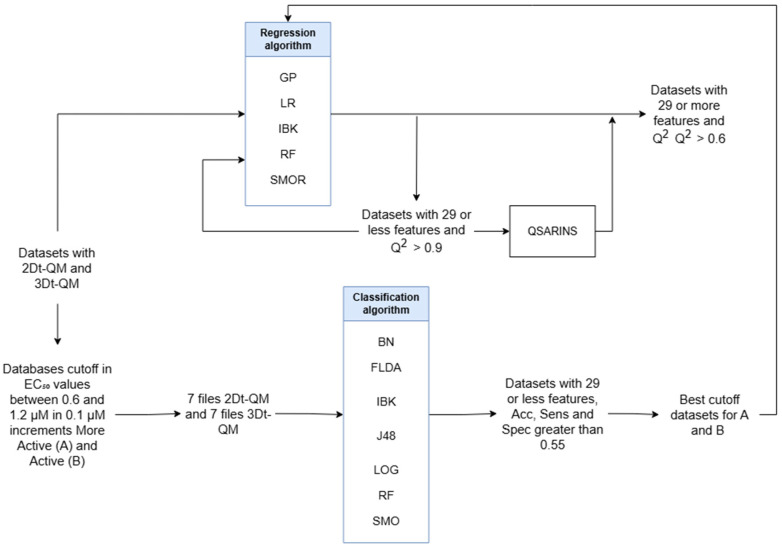 Figure 9
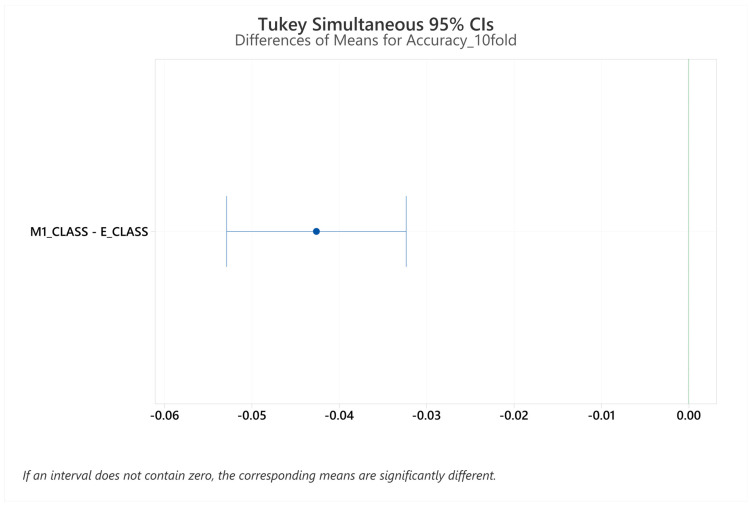 Figure 10
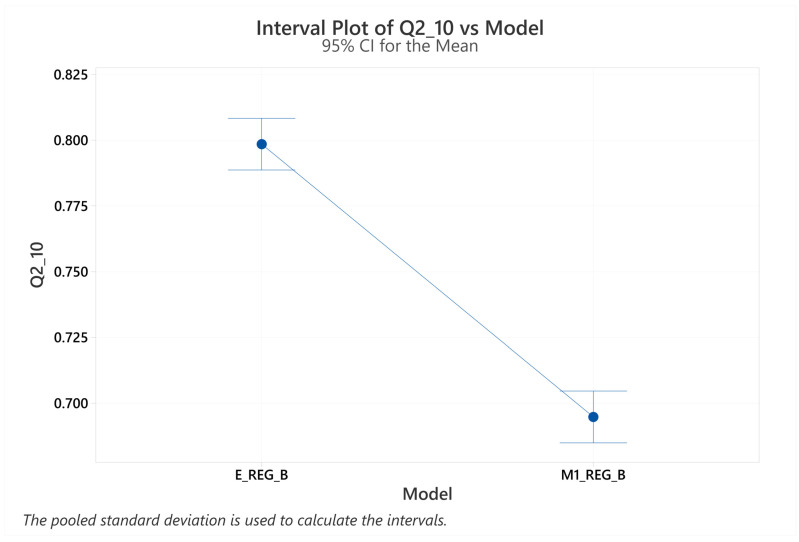 Figure 11
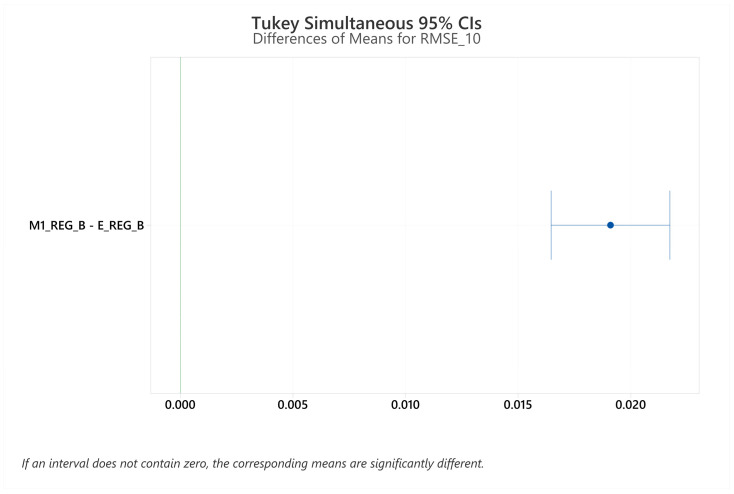 Figure 12
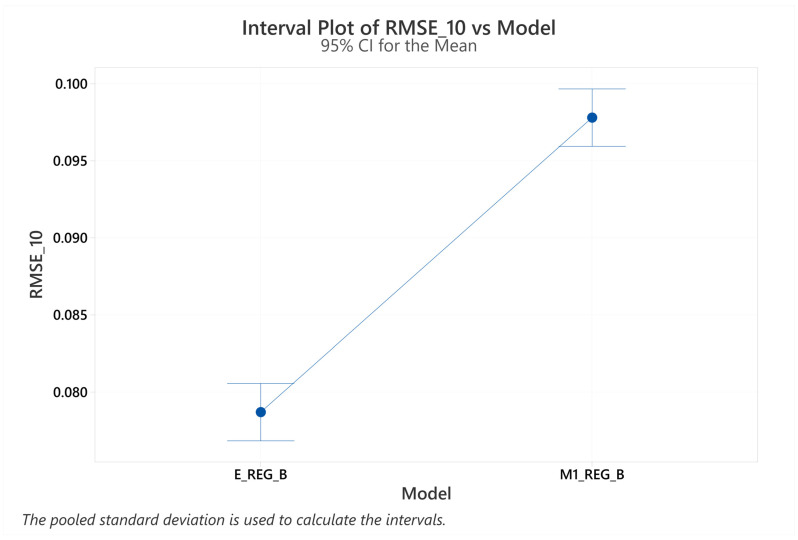 Figure 13
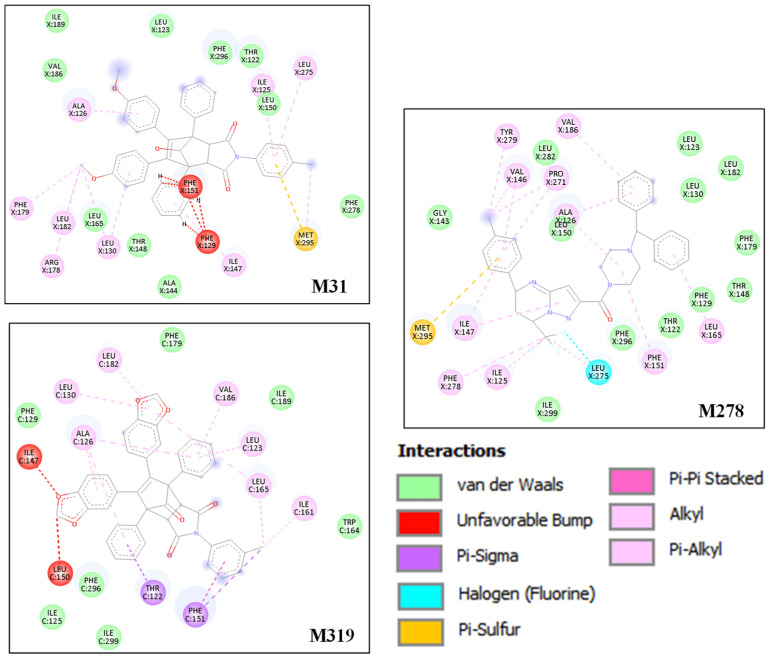 Figure 14
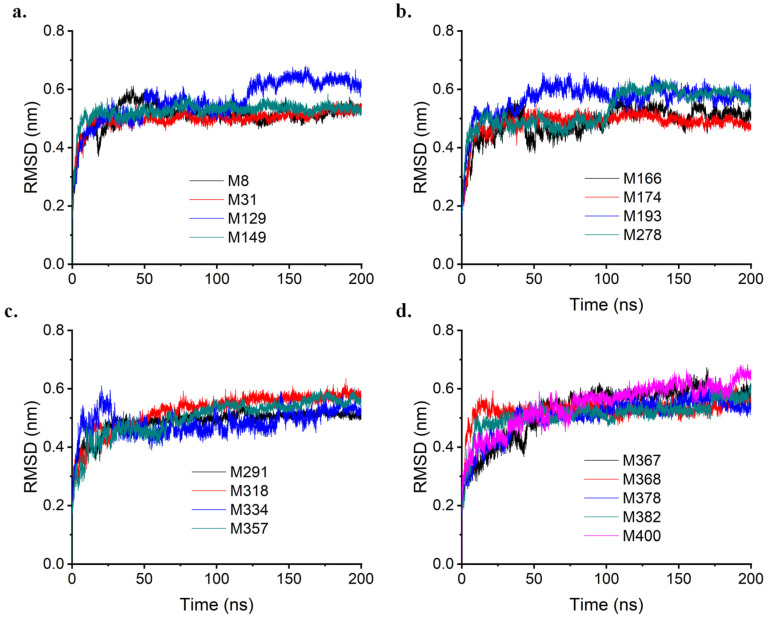 Figure 15
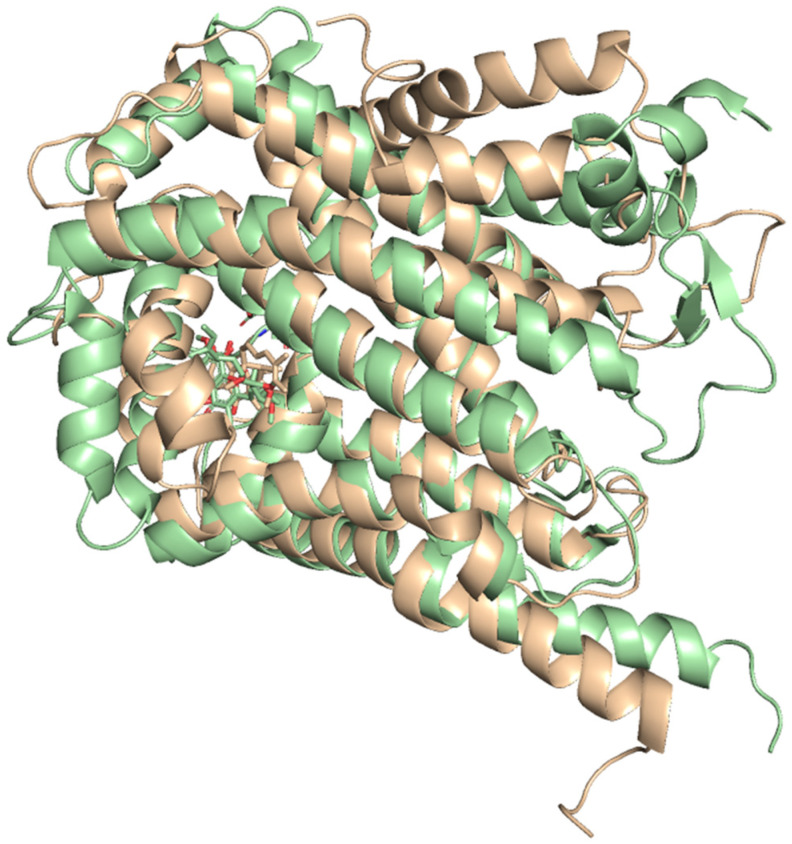 Figure 16
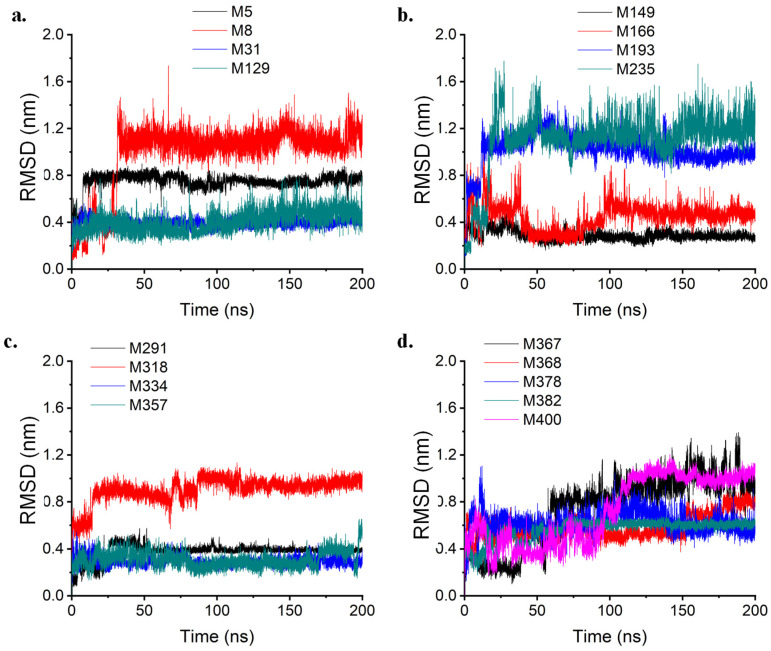 Figure 17
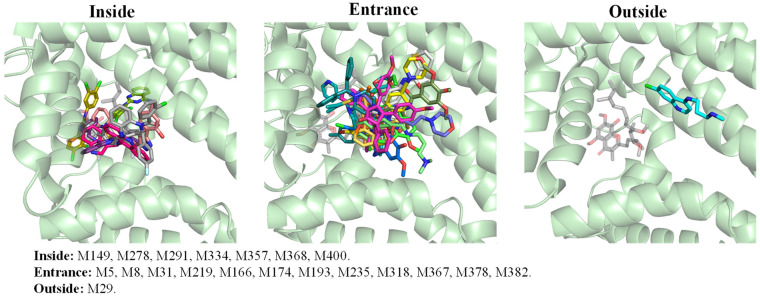 Figure 18
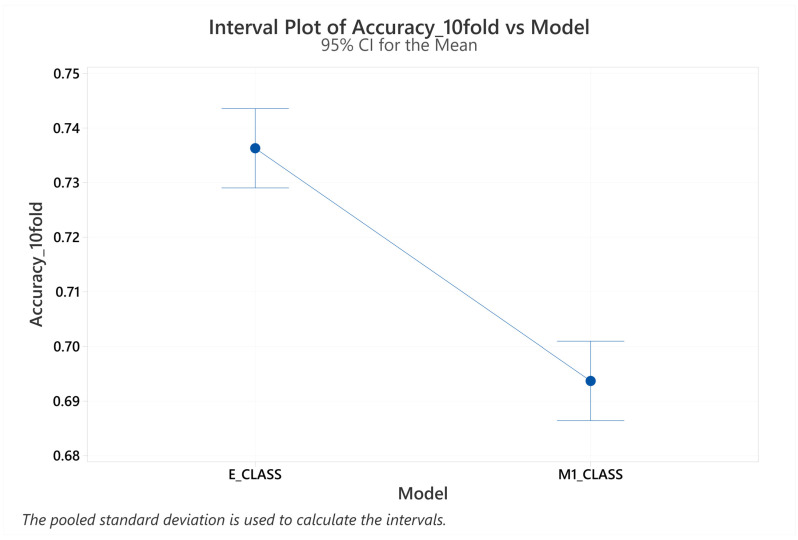 Figure 19
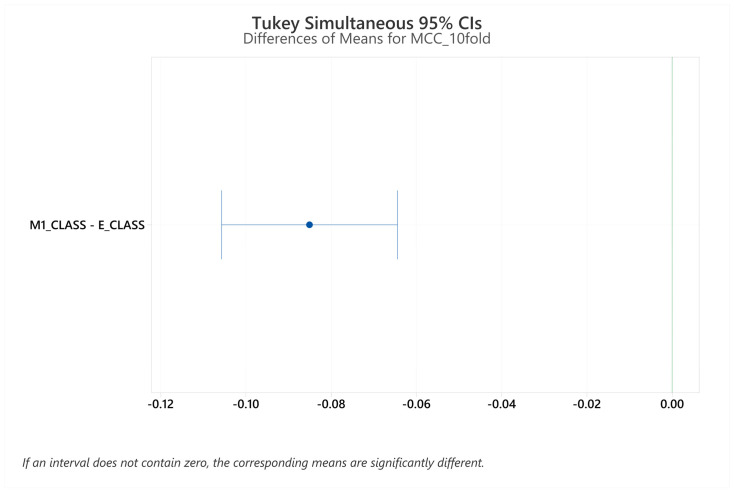 Figure 20
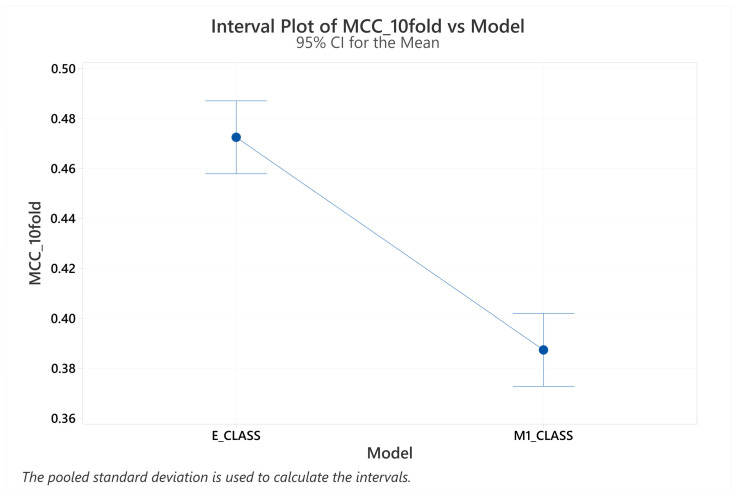 Figure 21
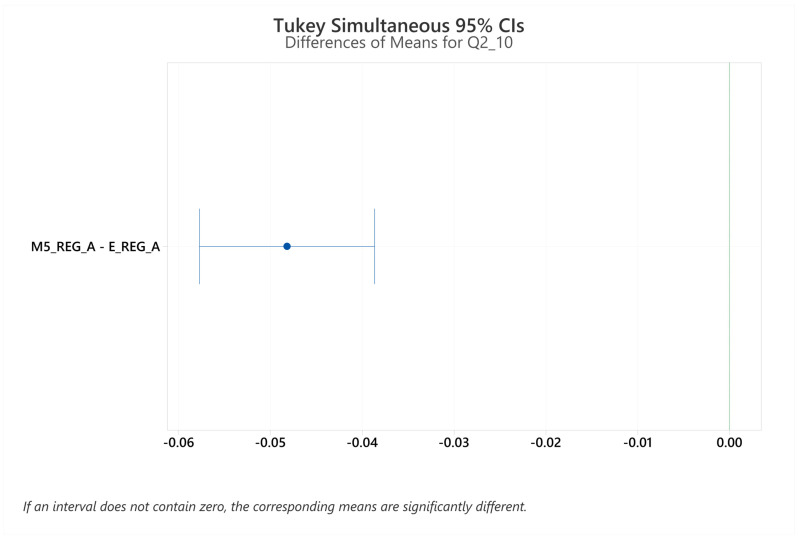 Figure 22
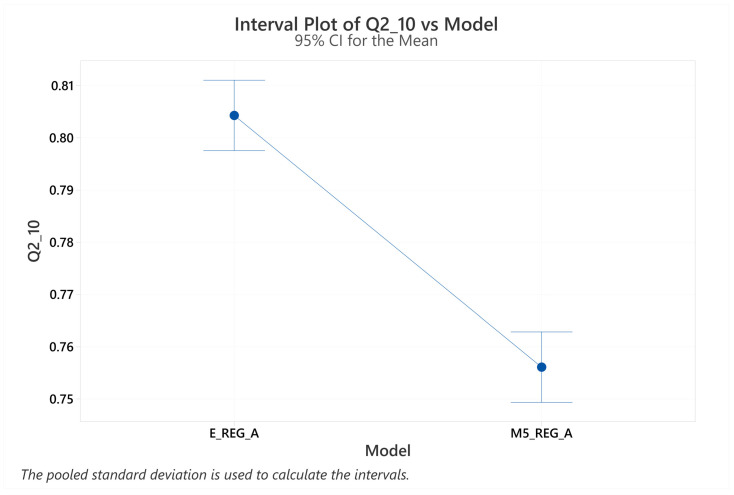 Figure 23
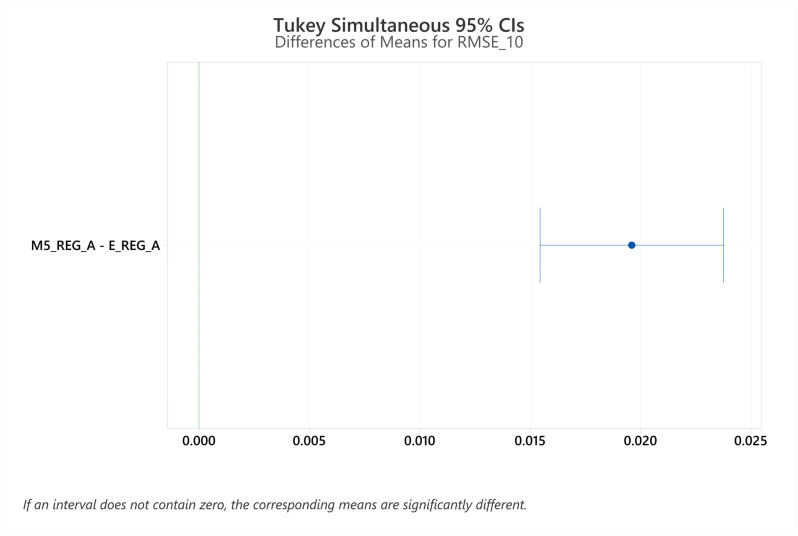 Figure 24
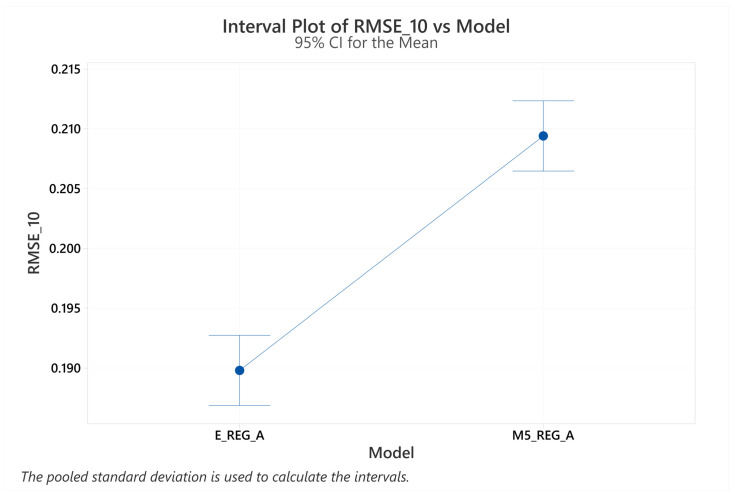 Figure 25
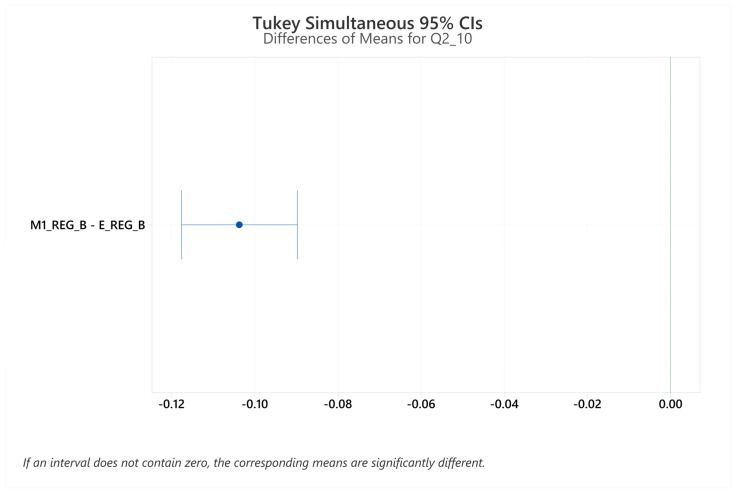 Figure 26
- —USFQ-Collaboration
- —Universidad del Norte, Colombia
Peer Reviews
No public reviews on file for this paper yet. If you reviewed it on a platform where reviews are public (OpenReview, ICLR, NeurIPS, ICML), you can paste yours below so the community can read it here.
Videos
No videos yet. Explain this paper in a talk, walkthrough, or lecture? Add one.
Taxonomy
TopicsMalaria Research and Control · Computational Drug Discovery Methods · vaccines and immunoinformatics approaches
1. Introduction
Approximately 250 million cases of malaria are reported annually, of which about 650,000 result in the death of patients [1,2]. Malaria remains a major public health challenge in endemic regions of Africa and Asia, with profound socio-economic implications [3,4]. Malaria is caused by protozoan parasites of the Plasmodium family found in mosquito species of the Anopheles family [4]. Of all the parasite species, Plasmodium falciparum is the main cause of fatal occurrences. In some cases, the disease can be appropriately controlled; however, in recent years, some obstacles have emerged to treat it effectively [4]. The most important barrier to pharmacotherapy is the resistance that some variants of P. falciparum have developed to antimalarial drugs [5,6]. The gradual emergence of this barrier has caused the drugs to treat the disease to be increasingly limited; consequently, the management of infections is deficient, and the number of deaths increases significantly [4,5].
Consequently, the development of new antimalarial drugs has become an urgent challenge for the pharmaceutical industry. However, this is a complex process that requires a considerable amount of time. One of the most crucial stages in the discovery of new drugs is the selection of compounds for in vitro and in vivo studies. Over the past decades, computational tools have been extremely useful for identifying the most promising candidates. Computer-aided drug design (CADD) encompasses a series of approaches used to discover and analyze chemical compounds exhibiting biological activity [7]. Currently, Quantitative Structure-Activity Relationship (QSAR) is one of the most widely used CADD techniques.
Many QSAR studies for antimalarial drug discovery have been reported in the last decade [3]. The increasing emergence of resistance to existing therapies and the limited availability of effective vaccines have intensified the search for new antimalarial candidates. Currently used drugs include chloroquine, artemisinin derivatives, sulfadoxine, pyrimethamine, mefloquine, primaquine and atovaquone, which were largely discovered through experimental medicinal chemistry and screening approaches (10.1080/17460441.2021.1866535). In recent years, computational methods such as QSAR, molecular docking and virtual screening have become essential tools to guide the design and optimization of new antimalarial compounds by identifying relationships between molecular structure and biological activity
In the literature, the most used approaches for the selection of molecular descriptors are: 2D-QSAR (use of 2D descriptors), 3D-QSAR (use of 3D descriptors) and 2D-3D-QSAR (mixed use of 2D and 3D descriptors) [3,8,9,10]. Most studies use linear regression techniques or non-linear ML techniques [3,11]. For the present study, 2D and 3D molecular descriptors were employed, combining a wide variety of ML techniques. This approach ensured an in-depth level of exploration during the modeling phase.
The use of ensemble models is one of the least frequently used approaches in QSAR studies against malaria. An ensemble model is an ML technique that combines the predictions of multiple individual models to improve statistical performance [12]. In the last six years, only one classification study using ensemble models has been conducted [13]. In this study, 5697 biologically active compounds against malaria were used, and the statistical performance was satisfactory. Additionally, studies belonging to other fields showed that ensemble-type models are quite promising, which is why this approach was chosen for the present work [12,14].
The selection of the database plays an important role in the quality of the results and the extension of the applicability domain [3]. The applicability domain is a theoretical region in space that is delimited by the molecular descriptors that make up the model. If the database used for modeling contains structurally similar molecules, the applicability domain is narrowed considerably as the molecular descriptors span very little domain space. In antimalarial QSAR studies, dataset size is often a limiting factor, as many published models rely on relatively small datasets ranging from tens to about one hundred compounds [13]. Therefore, the use of a dataset comprising approximately 400 compounds in the present work represents a substantially larger and more diverse chemical space, allowing a broader and more reliable applicability domain.
The database that was selected for modeling bears the name of Malaria Box, which consists of 400 chemical compounds that have biological activity against Plasmodium falciparum [2]. Malaria Box reports antimalarial activity using half the maximum effective concentration (EC50) [2]. The EC50 values for the 400 molecules are between 30 nM and 4 μM, which implies that the range of biological activity is wide [2]. The Malaria Box has the advantage of molecular variability, meaning that the molecules comprising it do not exhibit similar structures. This benefits modeling as the objective is to enhance the applicability domain (AD). This study aims to develop robust ensemble-based QSAR models integrating 2D, 3D, and quantum descriptors to predict antimalarial activity of Malaria Box compounds, complemented by molecular docking and dynamics simulations.
2. Results
2.1. Regression Models
As an initial approach to building a predictive model, feature selection for regression was performed using the 317 molecules in the database. The search for the best descriptors was conducted separately for 2Dt-QM and 3Dt-QM. Each subset of descriptors was labelled with its respective regression technique, search method, and the number of molecular descriptors. The first statistical parameter used for the selection of the best models was the Q^2^10-fold, followed by the MAE_10-fold_. According to the theoretical framework, the best models have Q^2^10-fold values close to 1 and MAE_10-fold_ values near 0 [15].
A total of 29 models were built using Weka 3.8, with their statistics provided in Table A1. Table 1 summarizes the five best models for both 2Dt-QM and 3Dt-QM. It is important to note that these subsets were obtained after an initial search. As observed, the models built with 2Dt-QM do not exceed 0.4 for their Q^2^10-fold, while there are two interesting models for 3Dt-QM with a Q^2^10-fold less than 0.8. However, given that the Q^2^10-fold barely reached 0.792 with 144 molecular descriptors, reducing the number of descriptors is not a viable path, as it automatically lowers the Q^2^10-fold below 0.5. In 100% of the cases, a second feature selection with a significant reduction (10 or more descriptors) greatly disturbs the statistical parameters of the model. Therefore, the study was approached from a different perspective due to the poor performance of the global models in terms of their statistical parameters.
2.2. Global Classification Models
The alternative path chosen was global classification modeling. For each cutoff, feature selection was performed separately for 2Dt-QM and 3Dt-QM, resulting in a total of 490 subsets. Models with more than 30 descriptors were discarded, yielding a total of 243 models for analysis. The statistics for these models are provided in Table A2. The main parameter considered for selecting the best models was Acc_10-fold_, followed by Sens_10-fold_ and Spec_10-fold_. According to the literature, the best models have largerAcc_10-fold_ values, and Sens_10-fold_ and Spec_10-fold_ close to 1. These last two parameters indicate the reliability with which the model classifies A and B, respectively.
Table 2 presents a summary of the top-performing models identified for each EC_50_ cutoff, evaluated using both 2Dt–QM and 3Dt–QM descriptor sets. Each model is annotated with its corresponding classification algorithm, search strategy, and number of selected descriptors. Overall, most models achieved acceptable predictive performance, with 10-fold cross-validated accuracy values exceeding 0.70, and models based on cutoffs above 1.0 reaching accuracy above 0.80.
However, accuracy alone was not sufficient to guide threshold selection. A detailed analysis of sensitivity and specificity revealed pronounced imbalances at the extremes of the cutoff range. Models constructed using a cutoff of 0.6 exhibited low sensitivity, indicating a poor ability to correctly identify highly active compounds. Conversely, cutoffs between 0.9 and 1.2 resulted in substantially reduced specificity, reflecting an increased rate of false positive classifications. These effects were directly associated with highly skewed class distributions at those thresholds, leading to biased classifiers with limited generalization capability.
To ensure statistical robustness and balanced predictive behavior, cutoffs producing strongly imbalanced class distributions were excluded from further consideration. The thresholds of 0.7 and 0.8 were therefore retained, as they provided a more equitable distribution of compounds between classes and yielded models with a better balance between sensitivity and specificity. This selection minimizes classification bias while maintaining biological relevance, corresponding to EC_50_ values.
When comparing the best models of both cutoffs, it is observed that both exhibit similar statistics for 2Dt-QM, with negligible differences in their sensitivity and specificity values. However, in general, the 3Dt-QM models for the 0.7 cutoff show better Acc_10-fold_ than the models with the 0.8 cutoff. This trend is more evident in Table A2. Therefore, 0.7 was chosen as the best cutoff for classification modeling, and 3Dt-QM as the best type of descriptors for modeling. In total, nine 3Dt-QM classification models proceeded to the next stage, where the best was RF_BF_12 (M1_CLASS).
The next step was partitioning into training/test sets. Clustering was performed using the k-means technique, resulting in 13 clusters of molecules based on similarity. Within each cluster, 75% of the molecules were randomly selected to form the training set and the remaining 25% to form the test set. Once the files for the nine models were created, an applicability domain analysis was conducted using AMBIT Discovery. The results were satisfactory, as the training sets had 100% coverage for the test sets. Finally, the performance and robustness of the classification models were evaluated using the following tests: 10-fold cross-validation for the training set, test set prediction (Ext), and leave-one-out cross-validation (LOO). Table A3 compiles the statistics for the validation of the nine best global classification models.
To continue with the classification modeling, an ensemble model was built from four models in Table A3 (J48_GS_12, IBK_IWSS_8, RF_IWSS_12, RF_BF_12), and its performance was evaluated with the validation tests described above. Table 3 summarizes the statistical parameters for the best individual classification model and the ensemble model. It is observed that E_CLASS outperforms M1_CLASS in most statistical parameters. This occurs because E_CLASS was built with four individual models, significantly reducing the error in classifying a subset of molecules. Lastly, an ANOVA analysis was conducted for Acc_10-fold_ and MCC_10-fold_ using a 95% significance level. Ten observations of these parameters were calculated for each model using a random seed in the cross-validation, finding that M1_CLASS and E_CLASS are statistically different. ANOVA results are shown in Table A4 and Figure A1, Figure A2, Figure A3 and Figure A4.
Additionally, a detailed comparison was made of four statistical parameters commonly used in the literature to analyze the robustness of binary classification models (accuracy, F-score, area under the ROC curve, and Matthews correlation coefficient). These four parameters together provide a good estimate of model performance, class balance, and prediction reliability [15,16]. A reliable statistical model has values for these parameters close to 1. As shown in Figure 1, E_CLASS outperforms or matches M1_CLASS in performance and reliability across the three validation tests. This demonstrates that the use of ensemble models significantly improves the performance of a predictive classification model.
Finally, the molecular descriptors of the models used to construct E_CLASS were analyzed. Among the four models, including M1_CLASS, at least 60% of the topographic descriptors were calculated based on three chemical properties: polarizability, charge, and the octanol/water partition coefficient. This suggests that the distribution of the electron cloud, electrostatic interactions, and behavior in an aqueous medium significantly influence the distinction between molecules with higher and lower biological activity.
2.3. Construction and Validation for Each Class Regression Models
After constructing the global classification model, the next phase was a separate regression modeling. The procedure was the same for both classes. First, feature selection for regression was performed for the very active class (A) and the active class (B). Only 3Dt-QM descriptors were used due to the poor statistical performance of the 2Dt-QM descriptors. The first statistical parameter used for selecting the best models was Q^2^10-fold, followed by MAE_10-fold_. Initially, a total of 15 models were constructed for each class, and Table 4 summarizes the statistical parameters of the top five.
In Table 4, it is observed that the models reached Q^2^10-fold very close to 1. However, the number of descriptors in these models exceeds 30 for both class A and class B. Therefore, a reduction in the number of descriptors forming the top four models for each class was performed using Weka 3.8 and QSARINS. The risk assumed in this procedure was the perturbation of Q^2^10-fold. performance. The statistical parameters for all models, including those from the first search, are found in Table A5. Five models were chosen for class A, with the best being GP_BF_101_QSARINS_20 (M5_REG_A), and four models for class B, with the best being GP_BF_112_LR_BF_28 (M1_REG_B). These nine models were the optimal candidates for the next phase of modeling.
For the first part of the validation, the training/test partition performed in the global classification modeling was maintained. Once the files were created, the applicability domain (AD) of the models was analyzed using AMBIT Discovery, obtaining 100% coverage of the training set for the test set. Finally, the performance and robustness of the regression models were evaluated using five statistical tests (correlation analysis, 10-fold cross-validation for the training set, leave-one-out cross-validation, test set prediction, and dependent variable randomization). The best models showed R^2^ and Q^2^ values close to 1, indicating good correlation and predictability. Furthermore, the values for mean absolute error (MAE), root mean square error (RMSE), and Q^2^y-Scrambling were close to 0. This implies that the models do not predict pEC50 at random and do so with good accuracy. The statistical parameters for the individual models of class A are found in Table A6, and for class B in Table A7.
The next step was the construction of an ensemble model for each class using the models in Table A6 and Table A7. For class A, the ensemble (E_REG_A) was built using the predictions of the models: GP_BF_101_QSARINS_20, LR_GS_71_QSARINS_20, and LR_BF_70_SMOR_BF_22. For class B, the ensemble (E_REG_B) was constructed using the predictions of: LR_BF_44_QSARINS_20, GP_BF_112_QSARINS_20, and GP_BF_112_LR_BF_28. Both ensembles were evaluated with the previously described validation tests, and their performance was compared to the best individual model for each class. The statistical parameters for validation are compiled in Table 5, showing that the ensemble models outperform the individual models in all their statistics. An ANOVA analysis was performed for Q^2^10-fold and RMSE_10-fold_ using a 95% significance level. Ten observations of these parameters were calculated for each model using a random seed in cross-validation, and it was found that the ensemble models (E_REG_A and E_REG_B) are statistically different from their individual models (M5_REG_A and M1_REG_B). The ANOVA results for each class A correspond to Table A8 and Figure A5, Figure A6, Figure A7 and Figure A8. The ANOVA results for class B correspond to Table A9 and Figure A9, Figure A10, Figure A11 and Figure A12.
Additionally, a detailed comparison of Q^2^, MAE, and RMSE was performed for three validation tests. In Figure 2 and Figure 3, the ensemble models significantly outperform the best individual models in their performance. The most significant differences are found in the 10-fold cross-validation and the prediction of the test set. This means that the predictions obtained with the ensemble model are much more reliable. For this reason, one of the projects with the greatest long-term impact is the implementation of the models in this study for screening external databases to find new candidates against malaria.
A more detailed analysis of the molecular descriptors that participated in the ensemble models was carried out. For both class A and class B, it was observed that at least 60% of the descriptors were calculated based on four chemical properties: polar surface area, electronegativity, octanol/water partition coefficient, and van der Waals volume. These properties are not only statistically relevant for distinguishing compounds with higher antiplasmodial activity, but they also play a mechanistic role in ligand–target interactions, particularly with Cytochrome BC1. For example, Polarizability, which reflects the ability of a molecule’s electron cloud to deform in response to external fields, has been shown to significantly influence binding affinity in biological systems. It affects how well a ligand can adapt to the electrostatic environment of a protein’s active site, enhancing van der Waals and dispersion interactions [17]. In the context of Cytochrome BC1, which contains a hydrophobic binding pocket and charged residues such as Glu272, polarizable ligands are better suited to form stable, non-covalent interactions.
Electrostatic charge is equally critical, as it governs the formation of hydrogen bonds and ionic interactions with charged amino acid residues in the binding site. For Cytochrome BC1, electrostatic complementarity between the ligand and residues like Glu272 and Tyr279 can stabilize the complex and improve inhibitory potency [18].
LogP, a measure of lipophilicity, influences the ligand’s ability to partition into the hydrophobic environment of the mitochondrial membrane and the binding pocket of Cytochrome BC1. Compounds with optimal logP values are more likely to reach and remain within the target site, enhancing bioavailability and binding efficiency [19].
Together, these descriptors provide not only predictive power in QSAR modeling but also mechanistic insight into how molecular properties translate into effective inhibition of Cytochrome BC1. Therefore, these are factors to be considered in the search and development of new drugs against P. falciparum.
2.4. Molecular Docking and Molecular Dynamics
The first step in the computational pipeline involved establishing and validating a robust docking protocol. To achieve this, a methodology validation was conducted using the co-crystallised ligand Stigmatellin A, which binds to the Cytochrome B subunit and redocks it to the protein. The resulting docking pose with the lowest energy showed a nearly identical pose compared to the electron density of the ligand in the solved structure (Figure 4a). This strong overlap confirmed the robustness and suitability of applying the selected docking protocol in this system. Cytochrome B-Stigmatellin A complex, the ligand occupies a predominantly hydrophobic cavity within the receptor, with Glu272 being the only polar residue present in the binding site. This observation suggests that hydrophobic interactions are likely to play a dominant role in stabilising ligand binding. However, the hydroxyl group in Stigmatellin A, which is located within its hydroxychromone moiety, forms a hydrogen bond with Glu272. This interaction could be essential for enhancing its inhibitory activity (Figure 4b). Therefore, to design or select future ligands to serve as lead compounds or inhibitors, the ability to form a hydrogen bond (HB) with Glu272 may serve as a useful criterion to improve potency.
Upon successful validation of the docking protocol, all 317 compounds from the Malaria Box database were subjected to molecular docking simulations against the Cytochrome B subunit of the Cytochrome bc1 complex. The results revealed that 308 of these compounds exhibited favorable binding affinities, with docking scores ranging from −11.8 to −6.1 kcal/mol (Table A10), indicative of strong interactions with the target site.
A smaller subset of eight molecules (M54, M307, M319, M342, M346, M370, M371, and M37) showed moderately negative scores between −5.9 and −3.1 kcal/mol, suggesting weaker binding or partial incompatibility with the active site geometry. Notably, two compounds (M27 and M31) yielded positive docking scores, implying unfavorable interactions and poor fit within the binding pocket. These findings suggest that such molecules may exert their antiplasmodial effects through alternative mechanisms unrelated to Cytochrome BC1 inhibition.
To gain deeper insight into binding behavior, three representative compounds were selected for detailed structural analysis (Figure A13): M278 (strong binder, −11.8 kcal/mol), M319 (moderate binder, −3.1 kcal/mol), and M31 (poor binder, +3.6 kcal/mol). The docking pose of M278 revealed an elongated conformation that closely mimicked the binding orientation of Stigmatellin A, a known Cytochrome BC1 inhibitor. Remarkably, the phenyl ring of M278 overlapped spatially with the hydroxychromone moiety of Stigmatellin A, suggesting a potential π–π stacking interaction with Tyr279 (Figure 5a), a feature known to enhance molecular recognition and binding stability. In contrast, M319 and M31 displayed bulky, three-dimensional scaffolds that were poorly accommodated within the narrow binding cavity of Cytochrome B. This steric hindrance likely contributed to their suboptimal docking scores and limited interaction with key residues (Figure 5b). These observations support the hypothesis that such compounds are unlikely to act as direct inhibitors of Cytochrome BC1 and may instead target other biochemical pathways within the parasite.
To complement the docking study and assess the temporal stability of these interactions, molecular dynamics (MD) simulations were conducted on a selected subset of 20 ligands. These included 10 compounds randomly selected from the active group and 10 from the most active subset. M31 was specifically chosen to act as a negative control due to its poor docking score, while Stigmatellin A served as a positive control given its established activity against Cytochrome B.
For each ligand, the pose with the lowest docking score was used as the starting conformation for the MD simulation. The reliability of each simulation was assessed by monitoring system properties such as density, box size, volume, pressure, and energy fluctuations. The dynamics of the protein–ligand complexes were evaluated using root-mean-square deviation RMSD plots, analyzing hydrogen bond formation, and visualizing the structural changes throughout the simulation. The binding free energy was also estimated to complement the structural analyses.
Over the 200-nanosecond simulations (Figure 6), Cytochrome B displayed stable behavior across all studied systems, with maximum RMSD values ranging between 0.548 nm and 0.755 nm (Table A11). In most of the systems, the equilibrium is reached within the first 20 ns. However, while the complexes with Stigmatellin A and M235 maintained consistent structural integrity throughout the simulation, the systems involving M5 and M29 exhibited noticeable deviations after the 100-ns mark. Specifically, the M5-bound complex showed increased fluctuations, with RMSD values rising to approximately 0.6 nm, suggesting a possible conformational rearrangement or transient destabilization. In contrast, the M29 system remained relatively stable but displayed subtle shifts that may reflect localized structural adjustments within the binding site (Figure 6 and Figure A14). This underscores the importance of extended simulation times to capture conformational changes and ligand adjustments.
Previous studies have documented similar behavior, where ligand-induced strain or suboptimal binding geometries lead to dynamic responses in peripheral helices and loop regions [20,21]. These observations suggest that the structural perturbations seen in the M5 and M29 systems may represent an adaptive mechanism of the protein to accommodate less favorable ligands, or alternatively, an early indication of reduced binding stability.
When comparing the crystal structure of Stigmatellin A–Cytochrome B complex to its conformation at the end of the simulation (reference system), an overall RMSD of 0.241 nm was observed. Key secondary structures near the active site remained well-aligned, while deviations were more pronounced in peripheral α-helices and loop regions. For the loops, this reflects their high flexibility, while for the peripheral α-helices, this phenomenon may be due to the absence of the other subunits within the full BC1 complex that may help stabilize them (Figure A15).
Ligand dynamics were also evaluated via RMSD analysis (Figure 6 and Figure A16). As expected, ligand RMSD values were generally higher than those of the protein. Most ligands stabilized rapidly, often taking less than 5 ns and remained stable throughout the simulation. A few ligands required 50 to 80 ns to reach equilibrium, and others exhibited persistent fluctuations. Maximum RMSD values varied from 0.42 nm (Stigmatellin A) to 2.30 nm (M29). Notably, higher RMSD values did not always indicate instability. For instance, M174 maintained a high but consistent RMSD, indicating that the docking conformation found was not stable over time. Among the most stable ligands, Stigmatellin A had the lowest fluctuation (0.023 nm), followed by M31 and M334. The most unstable ligands included M29, M8, and M367 (Table A12).
During the 200-nanosecond simulation, the RMSD (Root Mean Square Deviation) profiles of the ligand–Cytochrome B complexes showed clear differences in how stable each structure was (Figure 6). As expected, the reference compound, Stigmatellin A, remained very stable throughout, with RMSD values consistently below 0.5 nm—indicating that it stayed firmly bound in its position. M278 behaved similarly, showing low and steady RMSD values, which suggests it fit well into the binding site and did not cause much structural disturbance.
On the other hand, M174 showed a slow and steady increase in RMSD during the first half of the simulation (about 100 ns), eventually leveling off around 1.25 nm. This likely means the molecule was gradually adjusting its shape before settling into a more comfortable position. M29 was the most unstable of the group. Its RMSD spiked quickly within the first 50 ns and kept fluctuating between 1.5 and 2.0 nm, which points to a poor fit in the binding site and ongoing structural shifts or temporary detachment.
Interestingly, the behaviour of M31 contradicted expectations. Despite its poor initial docking score and unideal binding pose at the active site entrance, the ligand maintained a highly stable conformation throughout the entire 200 ns simulation. Snapshot analyses every 25 ns (Figure 7) confirmed that M31 remained consistently anchored near the entrance of the pocket. This unexpected stability suggests that M31 might exert a competitive inhibitory effect by blocking substrate access. Hydrogen bond analysis revealed a single bond formed between M31 and the backbone carbonyl of Val157, reinforcing the notion that hydrophobic interactions are the dominant binding force.
A broader hydrogen bond (HB) analysis showed that most systems maintained an average of 0 HBs during the simulation, with only M368 and M400 averaging 0.5 and 1.5 HBs, respectively (Table A13). Maximum HB formed ranged between 1 and 2 for most systems, while M368 and M400 formed 3 and 4 HBs, respectively. In M368, two nitrogen atoms and one oxygen enabled HB formation with the main chain carbonyl of Ile269 (Figure 8a). M400, on the other hand, shifted into a nearby sub-pocket during the simulation and formed stable HBs with the main chain of Ser268 and both the main and side chains of Glu272 (Figure 8b). Notably, this last interaction shows the potential relevance of the HB with Glu272 as observed previously in Stigmatellin A.
After completing the simulations, the conformational behavior of each ligand within the active site was analyzed. The results showed that seven compounds remained stably positioned inside the active site, indicating strong and consistent interactions. Twelve ligands, however, shifted toward the entrance of the active site, suggesting a less optimal fit or weaker binding affinity. Notably, one compound exited the active site entirely during the simulation, which points to a significantly weaker interaction. Interestingly, even after leaving the active site, this molecule maintained contact with a nearby α-helix, implying that some residual interaction persisted despite its displacement (Figure A17). This behavior suggests the presence of residual interactions that may not contribute to canonical binding but could still influence the protein’s conformational landscape. Such peripheral contacts are increasingly recognized as non-canonical interaction sites that can modulate protein dynamics and function [22]. Interestingly, the peripheral interactions have been previously reported in cytochrome systems, particularly in cytochrome P450 enzymes, where ligands interact transiently with residues lining access channels or flexible structural elements like helices and loops. These interactions can serve as transitional anchoring points or even contribute to allosteric modulation, subtly altering the protein’s conformational landscape and potentially affecting its functional state [23,24].
Lastly [25], the MM/PBSA binding free energy calculations confirmed that all ligand–Cytochrome bc1 complexes exhibited favorable interactions, as evidenced by consistently negative total ΔG values (Table 6). These results reinforce the findings from molecular docking and dynamics simulations, providing a thermodynamic perspective on ligand stability and affinity.
Stigmatellin A, used as the reference compound, showed the most favorable binding energy (ΔTOTAL = −54.99 kcal/mol), driven by strong van der Waals (ΔVDWAALS = −60.81 kcal/mol) and electrostatic (ΔEEL = −16.02 kcal/mol) contributions. Although the solvation energy (ΔGSOLV = +21.85 kcal/mol) partially offset these interactions, the overall binding remained highly favorable. This energetic profile aligns with its known potency as a Cytochrome B inhibitor and its stable behavior throughout the 200-ns simulation. The strong gas-phase interactions (ΔGGAS = −76.83 kcal/mol) suggest a tight and specific fit within the hydrophobic binding pocket, supported by hydrogen bonding with Glu272.
In contrast, M29 exhibited one of the least favorable binding energies (ΔTOTAL = −26.82 kcal/mol). While its van der Waals (−32.59 kcal/mol) and electrostatic (−1.26 kcal/mol) contributions were present, they were significantly weaker than those of Stigmatellin A. Moreover, the solvation energy (ΔGSOLV = +7.03 kcal/mol) further reduced the overall binding affinity. This thermodynamic profile is consistent with the ligand’s poor stability observed during MD simulations, where it showed high RMSD fluctuations and transient disengagement from the active site. The relatively low ΔGGAS (−33.85 kcal/mol) suggests suboptimal interactions within the binding pocket, likely due to poor shape complementarity or lack of key stabilizing contacts.
Interestingly, M278, which also demonstrated high structural stability during MD simulations, showed a highly favorable binding energy (ΔTOTAL = −51.42 kcal/mol). Its strong van der Waals (−60.78 kcal/mol) and electrostatic (−6.65 kcal/mol) interactions were partially offset by solvation effects (+16.01 kcal/mol), but the overall profile supports its potential as a competitive inhibitor. The similarity in binding orientation to Stigmatellin A, including π–π stacking with Tyr279, likely contributes to its strong gas-phase interactions (ΔGGAS = −67.43 kcal/mol).
Another notable case is M31, which, despite a poor docking score, exhibited a surprisingly favorable binding energy (ΔTOTAL = −40.84 kcal/mol). This was primarily due to a strong van der Waals contribution (−50.33 kcal/mol) and a relatively low solvation penalty (+9.81 kcal/mol). The ligand maintained stable contact with the entrance of the binding pocket throughout the simulation, suggesting a possible mechanism of competitive inhibition by blocking substrate access rather than deep binding.
Generally, the binding energy decomposition reveals that van der Waals interactions are the dominant stabilizing force across most systems, especially for ligands that fit well into the hydrophobic pocket of Cytochrome B. Electrostatic interactions, while variable, contribute meaningfully when hydrogen bonding or ionic contacts are present. Solvation energies tend to oppose binding but are outweighed in strong binders by favorable gas-phase interactions.
These findings underscore the importance of balancing hydrophobic complementarity, electrostatic interactions, and solvation effects in ligand design. Compounds like Stigmatellin A and M278 exemplify optimal profiles, while M29 highlights the limitations of poor fit and weak interactions. The MM/PBSA results thus provide a valuable thermodynamic validation of the structural and dynamic observations, guiding future optimization of antimalarial candidates targeting Cytochrome B.
3. Materials and Methods
3.1. Database Construction
The modeling dataset was derived from the Malaria Box collection, originally comprising 400 compounds with reported antimalarial activity. To ensure consistency and relevance, only those molecules with EC_50_ values determined against Plasmodium falciparum 3D7 strain and curated in the ChEMBL database were retained, resulting in a final set of 317 compounds. The structural diversity within this subset supports the development of predictive models with a broad applicability domain, enhancing their potential for generalization across chemically heterogeneous datasets.
Initially, canonical SMILES representations for the 317 selected compounds were retrieved. These were used to generate both two-dimensional and three-dimensional molecular structures via Open Babel. The 3D geometries were subsequently optimized using RDKit, applying molecular mechanics with the Universal Force Field (UFF) to ensure energetically favorable conformations. From these structures, three categories of molecular descriptors were computed: two-dimensional topological (2Dt), three-dimensional topological (3Dt), and quantum mechanical (QM), providing a comprehensive characterization of each molecule’s physicochemical and spatial properties.
2Dt descriptors were calculated with ToMoCoMD QuBiLs-MAS software v2.0, while 3Dt descriptors were calculated with ToMoCoMD QuBiLs-MIDAS [26]. The structures were optimized again at a semi-empirical level with the PM6 method, using Gaussian 16, to calculate the QM descriptors. From the Gaussian output files, the following descriptors were extracted: internal energy (U), enthalpy (H), Gibbs free energy (G), energy of highest occupied molecular orbital (E_HOMO), energy of molecular orbital lowest unoccupied (E_LUMO), polarizability, dipole moment (E_dipole_m), Log10 (Q), thermal energy (E), heat capacity (CV) and entropy (S). Additionally, the molecular weight, the number of hydrogen donors and the partition coefficient (AlogP) were added, whose values were reported in the Malaria Box. Finally, collinear descriptors were eliminated using a Spearman correlation coefficient and a Shannon entropy of 0.7, obtaining a total of 317 2Dt-QM descriptors and 499 3Dt-QM descriptors.
3.2. Construction of Regression Models
As an initial modeling strategy, regression analyses were conducted using two descriptor sets: 2Dt–QM and 3Dt–QM. Feature selection was performed using the wrapper method implemented in Weka 3.8, which, despite its computational intensity, is known to yield descriptor subsets with superior statistical performance compared to alternative techniques [14]. The regression models were built using a diverse set of algorithms, including Gaussian Processes (GP), instance-based learning with parameter k (IBK), multiple linear regression (LR), support vector regression (SMOR), and Random Forests (RF). Each algorithm was paired with one of three search strategies—Best First (BF), Greedy Stepwise (GS), and Genetic Algorithm (GEN)—to optimize descriptor selection and model performance. A schematic overview of this procedure is presented in Figure 9.
Finally, the 10-fold cross-validation coefficient (Q^2^10-fold) was analyzed as the main metric for the performance of the models. Those subsets with descriptors greater than 29 and a Q^2^10-fold value close to 1 underwent a second search. This ensures that the ratio between the number of instances and the number of features is approximately 11:1, as suggested by the theoretical framework [14]. For modeling, the expression defined in Equation (1) is used as the dependent variable.
3.3. Construction of Global Classification Models
Given the limited predictive performance observed in the initial regression models, a global classification strategy was adopted. The dataset was stratified into two categories, “very active” (A) and “active” (B), based on the EC_50_ values of each compound against Plasmodium falciparum. All compounds exhibited measurable biological activity; therefore, the classification was based on relative potency. Molecules with EC_50_ values equal to or below a defined threshold were assigned to class A, while those exceeding the threshold were placed in class B. To identify the optimal cutoff, a range of EC_50_ values between 0.6 and 1.2 µM was systematically evaluated in 0.1 µM increments. This process generated seven datasets for each descriptor type (2D-QM and 3D-QM), which were subsequently used to determine the most statistically robust partitioning and descriptor subsets for model development.
Subsequently, supervised feature selection was applied to each of the 14 datasets using the wrapper method, which is known for its ability to identify descriptor subsets with strong predictive relevance. To maintain model simplicity and avoid overfitting, descriptor sets containing more than 29 variables were excluded. A diverse array of classification algorithms was employed, including Bayes Network Learning (BN) [27], Fisher Linear Discriminant Analysis (FLDA) [28], Instance-Based Learning with parameter k (IBK) [29], Decision Trees based on information theory (J48) [30], Multinomial Logistic Regression with ridge regularization (LOG) [31], Random Forest (RF) [32] and Support Vector Classification using Sequential Minimal Optimization (SMO). For descriptor search optimization, Particle Swarm Optimization (PSO) and Incremental Wrapper Subset Selection (IWSS) were also incorporated, alongside the search strategies previously used in the global regression phase. A schematic overview of this procedure is presented in Figure 9.
To assess the performance of the classification models, a 10-fold cross-validation was conducted on all descriptor subsets that met the selection criteria. Models were developed using Weka 3.8, and their predictive capabilities were evaluated based on accuracy (Acc_10_-fold), sensitivity (Sens_10_-fold), and specificity (Spec_10_-fold). The most promising cutoff values and corresponding models were selected for further refinement. This entire process was automated through a Python 3 script utilizing the python-weka-wrapper3 library, ensuring reproducibility and efficiency. For external validation, the dataset was partitioned into training and test sets using the k-means clustering algorithm—a well-established method in predictive modeling literature. Clustering was performed in Minitab 20.3 17, using Euclidean distance as the similarity metric. Within each cluster, 75% of the compounds were randomly assigned to the training set, while the remaining 25% formed the test set, preserving structural diversity across both subsets.
To ensure the reliability of predictions, an applicability domain (AD) analysis was carried out using AMBIT Discovery. Four complementary methods were employed: nearest neighbor distance, Euclidean distance, range analysis, and probability density estimation. A compound was considered outside the model’s AD if more than two of these methods flagged it as such. Finally, model robustness was further evaluated using three validation strategies: 10-fold cross-validation on the training set, prediction on the external test set (Ext), and leave-one-out cross-validation (LOO). For each, key performance metrics were calculated, including accuracy, sensitivity, specificity, F-score, area under the ROC curve (AUC), and Matthews correlation coefficient (MCC).
Ensemble modeling was then initiated by calculating the prediction probabilities (P) for each compound across individual models. Based on these probabilities, ΔP values were computed—using Equation (2) for class A predictions and Equation (3) for class B. These ΔP values served as input features for selecting the most informative models to construct the ensemble. The ensemble’s performance was subsequently benchmarked against the best individual model using the same validation protocols.
3.4. Construction and Validation for Each Class Regression Model
After constructing the classification model, the dataset was split into two distinct groups, class A (very active) and class B (active), to enable targeted regression modeling for each class. Although the molecular instances differed between the two groups, the modeling workflow remained consistent. To begin, descriptor redundancy was addressed by removing collinear variables using a Spearman’s correlation threshold of 0.6 and a Shannon entropy cutoff of 0.7. This refinement yielded a total of 1185 3Dt–QM descriptors. The 2Dt–QM descriptors were excluded from this phase due to their previously observed poor performance in both regression and classification tasks.
Feature selection was then carried out using Weka 3.8.0, employing the same regression algorithms and search strategies used in the global modeling phase (see Figure 9). The quality of each model was assessed using the Q^2^10-fold metric, and the dataset was partitioned into training and test sets based on the classification-derived subsets to maintain consistency.
Model validation began with an applicability domain (AD) analysis, following the same protocol used in the classification stage. A compound was considered outside the AD if more than two of the four applied methods—nearest neighbor, Euclidean distance, range analysis, and probability density—flagged it as such.
To evaluate predictive performance and robustness, five statistical tests were conducted: correlation analysis, 10-fold cross-validation on the training set, external test set prediction (Ext), leave-one-out cross-validation (LOO), and y-randomization (y-scrambling). Key metrics such as the coefficient of determination (R^2^), Q^2^ values, mean absolute error (MAE), and root mean square error (RMSE) were calculated for each model.
Ensemble models were then constructed using the predictions obtained from the 10-fold cross-validation of individual models. A final round of feature selection was performed to identify the most informative models for ensemble integration. The resulting ensemble models were validated using the same statistical tests and benchmarked against the best-performing individual models to assess improvements in predictive accuracy and generalizability.
3.5. Molecular Docking
Molecular docking studies were conducted to explore the potential mechanisms of action of the selected antimalarial compounds. All 317 molecules from the Malaria Box database were used as ligands in the docking simulations. Additionally, Stigmatellin A, a well-characterized inhibitor of mitochondrial electron transport, was included as a reference compound to validate the docking protocol and provide comparative insights [25]. In this line, cytochrome BC1, a key component of the mitochondrial electron transport chain in Plasmodium falciparum, was selected as the target. This complex plays a central role in maintaining mitochondrial membrane potential and ATP synthesis, processes that are essential for parasite survival and proliferation [18,33]. In addition, cytochrome BC1 has been extensively validated as a drug target, particularly through the clinical success of atovaquone, a hydroxynaphthoquinone that inhibits the ubiquinol oxidation (Qo) site of the complex. On the other hand, cytochrome BC1 complex exhibits sufficient structural divergence between the parasite and human homologs, allowing for selective inhibition [34]. In this regard, differences in the active site, specifically at residues V259, P266, and F267 (K269, F276, and F277 in the human homologue), allow inhibitors to interact more tightly with the parasite variant than with the human one. This selectivity is crucial for providing a therapeutic window by minimizing host toxicity while maintaining potent antiparasitic activity. Recent research has also highlighted the Qi site of Cytochrome BC1 as a promising alternative target for next-generation quinolone-based antimalarials, which are being developed to overcome resistance mutations in the Qo site [21].
The X-ray diffraction crystal structure of Saccharomyces cerevisiae Cytochrome BC1 complex (PDB: 1KB9) was used as the receptor model [35]. Although direct crystallographic data for the parasite’s Cytochrome BC1 is limited, the yeast complex shares significant structural and functional conservation, particularly in the catalytic core subunits such as cytochrome b, cytochrome c1, and the Rieske iron–sulfur protein. In this context, the active site of P. falciparum, formed by F123, Y126, M133, W136, G137, A138, V140, I141, L144, I258, V259, P260, E261, F264, L265, P266, F267, Y268, and L271, is fully conserved in the S. cerevisiae homologue. This homology enables the use of yeast-derived models to study inhibitor binding and resistance mechanisms relevant to P. falciparum [34].
Receptor preparation was performed by deleting complex chains that were far and not in contact with the chain where inhibition happens, water molecules and other co-crystalized small molecules not involved in the inhibition mechanism were also deleted. Ligands and the receptor were prepared using AutodockTools v1.5.7, where polar hydrogens were added, and pdbqt format structures obtained [36]. For the calculations, AutoDock Vina was used, setting a 1 Å spacing, full ligand flexibility, and an exhaustiveness of 24 [37]. The grid box was reduced to the active site where Stigmatellin A binds (x = −12.801, y = 37.964, and z = −16.758) with a size of 20 Å for x, and 16 Å for y and z, respectively. Docking results were analysed, focusing on the docking score, pose, and hydrogen bonds formed.
3.6. Molecular Dynamics
Molecular dynamics (MD) simulations were used to evaluate the stability of the ligand-enzyme complex over time. As MD is a computationally expensive process, 20 ligands were randomly chosen (10 from the active ones and 10 from the most active ones). Stigmatellin A was also run as a reference. The output of the docking calculations was taken as the starting point for the MD. For the calculation, Gromacs 2019.6 was used. The topology of the Cytochrome was built using AMBER99SB-ILDN forcefield [38,39]. On the other hand, ligand topology was obtained using the Generalised Amber Force Field (GAFF) implemented in the ACPYPE server [40]. For the system solvation, a cube-shaped water box was used, combined with a three-point water model (TIP3) and neutralized using sodium or chlorine atoms as needed. Then, the system was relaxed and then equilibrated (100 ps at 300 K) using a NVT (constant number of particles, volume, and temperature) and NPT (constant number of particles, pressure, and temperature) protocols [41]. All simulations were run for a period of 200 ns, setting the pressure at 1 Barr and the temperature at 300 K. The MD run was first assessed by analyzing the volume, box size, temperature, density, pressure, and potential energy throughout the 200 ns, ensuring no erroneous behaviors occurred. Then, parameters such as the fluctuation, root-mean-square deviation, hydrogen bonds, and the stability of the ligand interaction with the receptor were studied.
G_complex_ refers to the energy of the lead compounds-protein complex, while G_protein_ and G_ligand_ are denoted for the protein and ligand energy in water surrounded environment, respectively.
3.7. Binding Free Energy
The software gmx_MMPBSA was employed to calculate the binding free energies of protein−ligand complexes obtained for the molecular dynamics trajectory data, by applying the molecular mechanics/Poisson−Boltzmann (GeneralizedBorn) surface area (MM/PB(GB)SA) method [42,43]. The MD simulation trajectories from 0 to 200 ns were utilized to calculate the binding free energy of the complexes, considering a total of 200 frames. The representation of the binding free energy (ΔG_binding_) of the lead compounds in complex with protein was calculated using the following equation.
4. Conclusions
Ensemble models were constructed based on 2D and 3D topographic and quantum-mechanical (QM) molecular descriptors calculated at the semi-empirical level using the PM6 method. Initially, regression modeling was proposed to predict pEC_50_ values using 317 molecules from the Malaria Box database. However, the models built using both 2Dt-QM and 3Dt-QM descriptors showed Q^2^10-fold values below 0.7 and required a few descriptors beyond commonly accepted limits.
As a result, classification modeling was pursued by categorizing molecules into two classes, very active (A) and active (B), based on various EC_50_ cutoffs. Statistical evaluation using 10-fold cross-validation revealed that a cutoff of 0.7 provided the best classification performance. K-means clustering was employed to partition data for model validation, and applicability domain (AD) analysis using AMBIT Discovery confirmed 100% coverage for the training set—indicating broad predictive applicability across chemically diverse datasets.
An ensemble model (E_CLASS) was constructed using the best-performing classifiers, which outperformed the best individual model (M1_CLASS) in nearly all validation metrics. E_CLASS achieved an accuracy of 0.738, F-score of 0.742, AUC of 0.792, and a Matthews correlation coefficient of 0.477, confirming its superior predictive reliability.
Subsequently, regression modeling was separately applied to classes A and B, using attribute-selected 3Dt-QM descriptors and maintaining the same training/test partition. Ensemble models for both classes (E_REG_A and E_REG_B) significantly outperformed the best individual models. E_REG_A reached a Q^2^10-fold of 0.810 and Q^2^ext = 0.749, while E_REG_B achieved a Q^2^10-fold of 0.793 and Q^2^ext = 0.765. These results reinforce the advantages of ensemble strategies for predictive accuracy and generalizability. Descriptor analysis highlighted the importance of properties related to electronic distribution, molecular volume, and hydrophobicity, key parameters for both classification and regression modeling. These should be prioritized in future drug discovery studies targeting P. falciparum.
To further explore the potential mechanism of action, molecular docking and molecular dynamics simulations were performed using P. falciparum Cytochrome B, a validated antimalarial drug target. A reliable docking protocol was validated using Stigmatellin A, confirming that hydrophobic interactions and hydrogen bonding with Glu272 are critical for ligand binding. Of the 317 Malaria Box compounds, most displayed strong binding affinities, with docking scores ranging from −11.8 to −6.1 kcal/mol. Compounds with high docking scores or unstable poses were shown, via MD simulations, to be unlikely inhibitors of Cytochrome B. In contrast, compounds like M278 adopted conformations mimicking Stigmatellin A, forming stable interactions such as π–π stacking with Tyr279.
Interestingly, despite M31 showing an initially poor docking score, it showed an excellent conformational stability throughout a 200-ns simulation, hinting at a possible competitive inhibition mechanism by blocking the active site entrance. MD simulations of 20 representative compounds revealed that most ligands maintained stable binding over time, with hydrogen bond analysis highlighting Glu272, Ser268, and Ile269 as important interaction sites. Free binding energy calculations further validated the docking and MD findings, showing negative values for all ligands and confirming favorable binding profiles for many compounds.
Together, the integration of machine learning, docking, and molecular dynamics presents a comprehensive strategy for identifying, predicting, and characterizing novel antimalarial compounds.
The reference list from the paper itself. Each links out to its DOI / PubMed record.
- 1Centers for Disease Control and Prevention Malaria—Malaria Worldwide—Impact of Malaria Available online: https://www.cdc.gov/malaria/php/impact/?CDC_A Aref_Val=https://www.cdc.gov/malaria/malaria_worldwide/impact.html(accessed on 1 September 2022)
- 2Spangenberg T. Burrows J.N. Kowalczyk P. Mc Donald S. Wells T.N.C. Willis P. The Open Access Malaria Box: A Drug Discovery Catalyst for Neglected Diseases P Lo S ONE 20138 e 6290610.1371/journal.pone.006290623798988 PMC 3684613 · doi ↗ · pubmed ↗
- 3Ojha P.K. Kumar V. Roy J. Roy K. Recent Advances in Quantitative Structure–Activity Relationship Models of Antimalarial Drugs Expert Opin. Drug Discov.20211665969510.1080/17460441.2021.186653533356651 · doi ↗ · pubmed ↗
- 4Tibon N.S. Ng C.H. Cheong S.L. Current Progress in Antimalarial Pharmacotherapy and Multi-Target Drug Discovery Eur. J. Med. Chem.202018811198310.1016/j.ejmech.2019.11198331911292 · doi ↗ · pubmed ↗
- 5Hanboonkunupakarn B. White N.J. Advances and Roadblocks in the Treatment of Malaria Br. J. Clin. Pharmacol.20228837438210.1111/bcp.1447432656850 PMC 9437935 · doi ↗ · pubmed ↗
- 6Flores M.C. Márquez E.A. Mora J.R. Molecular Modeling Studies of Bromopyrrole Alkaloids as Potential Antimalarial Compounds: A DFT Approach Med. Chem. Res.20182784485610.1007/s 00044-017-2107-3 · doi ↗
- 7Sabe V.T. Ntombela T. Jhamba L.A. Maguire G.E.M. Govender T. Naicker T. Kruger H.G. Current Trends in Computer Aided Drug Design and a Highlight of Drugs Discovered via Computational Techniques: A Review Eur. J. Med. Chem.202122411370510.1016/j.ejmech.2021.11370534303871 · doi ↗ · pubmed ↗
- 8Sharma K. Srivastava A. Tiwari P. Sharma S. Shaquiquzzaman M. Alam M.M. Akhter M. 3D QSAR Based Virtual Screening of Pyrido [1,2-a] Benzimidazoles as Potent Antimalarial Agents Lett. Drug Des. Discov.20191630131210.2174/1570180815666180502115147 · doi ↗