Expression of NOTCH1 Is Correlated with Expression of Cancer Stem Cell Markers and miR-150 in Oral Epithelial Dysplasia
Emanuela Boštjančič, Gašper Grubelnik, Nina Zidar, Katarina Dimnik

TL;DR
This study shows that NOTCH1 expression is linked to cancer stem cell markers and miR-150 in early oral cancer development.
Contribution
The study reveals a novel correlation between NOTCH1 and stem cell markers in oral epithelial dysplasia, a pre-cancerous condition.
Findings
NOTCH1 mRNA levels were significantly higher in OAD compared to normal mucosa.
NOTCH1 positively correlated with stem cell markers and miR-150 in OAD.
NOTCH1 expression patterns varied in OAD and normal mucosa by immunohistochemistry.
Abstract
NOTCH1 is associated with various tumors, including oral squamous cell carcinoma (OSCC), with a complex role depending on cellular contexts. Our aim was to analyze the expression of NOTCH1, several stem cell markers, and selected microRNAs in preneoplastic lesion of the oral cavity, oral epithelial dysplasia (OAD). Our study included formalin-fixed paraffin-embedded biopsy samples of 36 cases of OAD and 15 cases of normal oral mucosa. Expression of NOTCH1, stem cell markers (AGR2, KLF4, NANOG, OCT4, SOX2), and miR-27a, miR-34a, miR-128, miR-145, miR-150, and miR-335 was analyzed by quantitative PCR (qPCR). Expression of NOTCH1 protein was analyzed by immunohistochemistry. In OAD compared to normal mucosa, we found a significant increase in mRNA levels of NOTCH1, stem cell markers AGR2, NANOG, OCT4, and SOX2, and miR-150 and miR-128. NOTCH1 mRNA positively correlated with all five stem…
Genes, proteins, chemicals, diseases, species, mutations and cell lines named across the full text — each resolved to its canonical identifier and authoritative record.
Click any figure to enlarge with its caption.
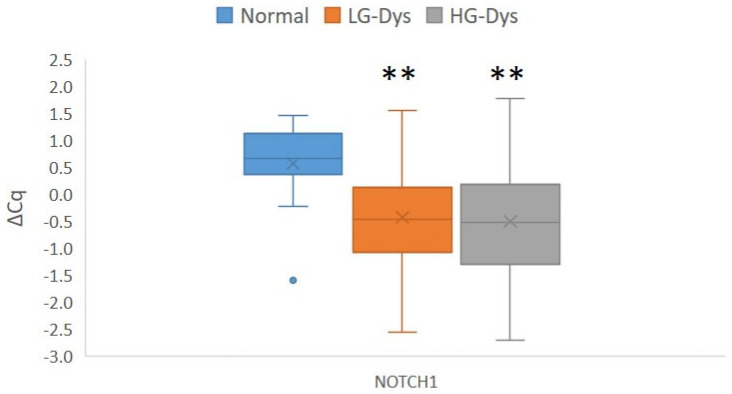 Figure 1
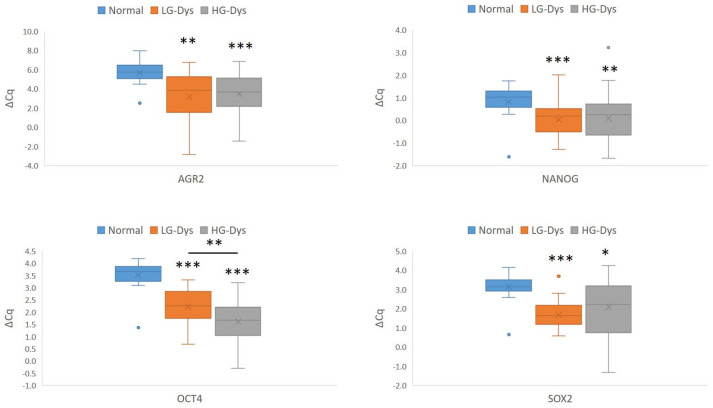 Figure 2
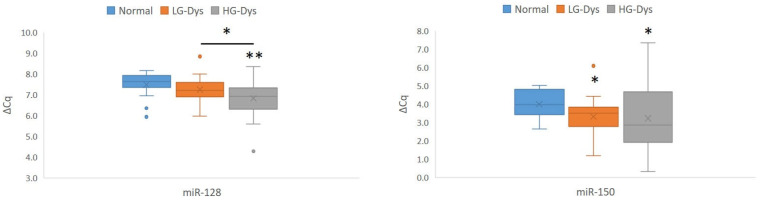 Figure 3
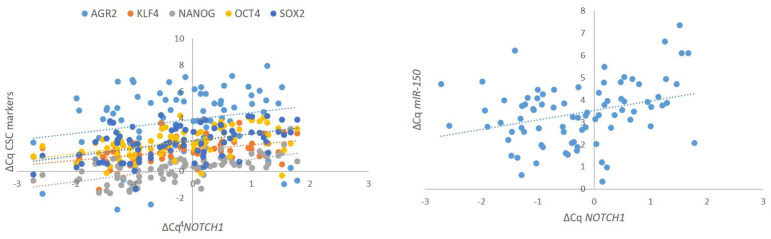 Figure 4
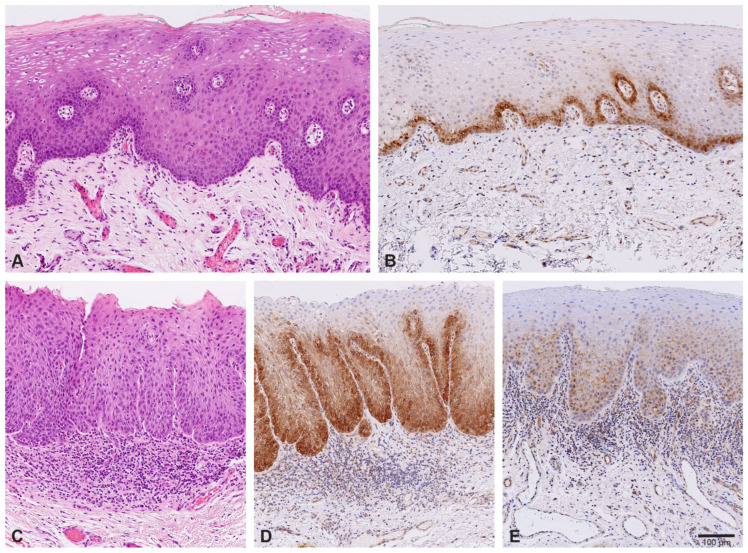 Figure 5
- —Slovenian Research and Innovation Agency
Peer Reviews
No public reviews on file for this paper yet. If you reviewed it on a platform where reviews are public (OpenReview, ICLR, NeurIPS, ICML), you can paste yours below so the community can read it here.
Videos
No videos yet. Explain this paper in a talk, walkthrough, or lecture? Add one.
Taxonomy
TopicsMicroRNA in disease regulation · Hedgehog Signaling Pathway Studies · TGF-β signaling in diseases
1. Introduction
NOTCH1 is a transmembrane receptor protein involved in the Notch signaling pathway, determining cell fate, survival, and proliferation during physiological processes and in various diseases, including tumors [1]. Changes in Notch signaling have been associated with the initiation and progression of various malignancies. The Notch pathway plays a complex role depending on the cellular context, and it has been demonstrated to be involved in various aspects of tumor biology such as angiogenesis, metabolic programming, tumor microenvironment, epithelial–mesenchymal transition (EMT), abnormal activation patterns, and expression of stem cell markers [2].
NOTCH1 mutations in squamous cell carcinoma (SCC) of the head and neck are believed to result mostly in loss of function of NOTCH1, giving NOTCH1 a tumor suppressor role in this type of cancer [3]. On the other hand, up-regulation of NOTCH1, proposing an oncogenic role, has also been described in oral SCC (OSCC) [4,5,6]. Better understanding of NOTCH1 signaling in OSCCs is crucial for clinically targeting this pathway. The presence of NOTCH1 mutations may predict response to treatment with immune checkpoint inhibitors or phosphatidylinositol 3-kinase inhibitors [7]. It is believed that NOTCH1 also contributes to stemness and is involved in EMT, which is considered to be one of the processes involved in the formation of cancer stem cells (CSCs) [8]. CSCs are a small fraction of tumor cells involved in tumor development and propagation due to their ability for self-renewal, differentiation into different cell types, and mobility. They are mostly found as a subpopulation at the invasive tumor front. CSCs are well described as contributors to development and invasiveness of OSCC [9].
The pathogenesis of invasive OSCC is a complex process involving various molecular and morphologic events. OSCC often develops from preexisting dysplasia. Oral epithelial dysplasia is defined as a spectrum of epithelial architectural and cytological changes that result from the accumulation of molecular alterations, with an increased risk of transformation into invasive SCC [10,11,12]. Despite advances in understanding the development and progression of OSCC, 5-year survival rates remain in the range of 50–60% [13]. Thorough investigation of molecular background of OSCC—especially in its precursor lesion (oral epithelial dysplasia)—is therefore still of high interest for the identification of potential markers not only for treatment, but also for prevention and early detection [11,12].
Results of our previous studies are in accordance with the complexity of NOTCH1 in invasive OSCC and with the potential role of NOTCH1 in cancer stemness in OSCC. Namely, we observed that expression of NOTCH1 was correlated with CSC markers, for example, KLF4, NANOG, and OCT4, and with the expression of microRNAs (miRNAs) miR-27a, miR-34a, miR-150, miR-145, and miR-335 in OSCC [14]. These results suggest that NOTCH1 signaling is dependent on many regulatory factors, including CSCs and miRNAs. Interestingly, there are limited data in the literature indicating that these miRNAs might regulate or be regulated by NOTCH1, but the majority of them have been reported to play a role in various cancers, including OSCC [15].
Although NOTCH1 is relatively well investigated in OSCC, its expression, correlation with its potential regulators and its regulatory function in CSCs are poorly understood in early stages of OSCC development, i.e., dysplasia. We therefore analyzed the expression of NOTCH1 in correlation with the expression of stem cell markers, (AGR2, KLF4, NANOG, OCT4, SOX2) and previously identified miRNAs (miR-27a, miR-34a, miR-128, miR-150, miR-145, miR-335) in oral epithelial dysplasia.
2. Results
2.1. Expression of NOTCH1 mRNA in Oral Epithelial Dysplasia and Normal Oral Mucosa
We found up-regulation of NOTCH1 mRNA in low-grade dysplasia (LG dysplasia) and high-grade dysplasia (HG dysplasia) (p = 0.001 for both) in comparison with normal oral mucosa. There were no differences in the expression of NOTCH1 mRNA between LG and HG dysplasia. Results are summarized in Figure 1.
2.2. Expression of Stem Cell Markers AGR2, KLF4, NANOG, OCT4, SOX2 in Oral Epithelial Dysplasia and Normal Oral Mucosa
In LG dysplasia, in comparison with normal mucosa, up-regulation of all CSC markers except KLF4 was found: AGR2 (p = 0.001), NANOG (p < 0.001), OCT4 (p < 0.001), and SOX2 (p < 0.001). In HG dysplasia, in comparison with normal mucosa, up-regulation of all CSC markers except KLF4 was observed: AGR2 (p < 0.001), NANOG (p = 0.002), OCT4 (p < 0.001), SOX2 (p = 0.011). Comparison of CSC marker expression between LG and HG dysplasia revealed up-regulation of OCT4 in HG dysplasia compared with LG dysplasia, showing a gradual increase in expression from normal mucosa to HG dysplasia. Results of statistically differentially expressed CSC markers are summarized in Figure 2.
2.3. Expression of miRNAs miR-27a, miR-34a, miR-128, miR-145, miR-150, miR-335 in Oral Epithelial Dysplasia and Normal Oral Mucosa
Comparison of miRNA expression between LG dysplasia and normal oral mucosa revealed up-regulation of miR-150 (p = 0.021). Comparison of miRNA expression between HG dysplasia and normal mucosa revealed up-regulation of miR-128 and miR-150 (p = 0.003 and p = 0.028, respectively). Results of significantly differentially expressed miRNAs are summarized in Figure 3. There were no differences in miR-27a expression between the three groups. Whereas miR-150 did not distinguish between LG and HG dysplasia, miR-128 showed up-regulation in HG dysplasia when compared with LG dysplasia. Results of our analyses of expression of miR-34a and miR-145 in oral epithelial dysplasia in comparison with normal mucosa were presented elsewhere [16].
2.4. Correlation Between Expression of NOTCH1, AGR2, KLF4, NANOG, OCT4, SOX2 mRNAs and miRNAs miR-27a, miR-34a, miR-128, miR-145, miR-150, miR-335 in Oral Epithelial Dysplasia and Normal Oral Mucosa
We found a strong positive correlation between NOTCH1 and all five analyzed CSC markers, namely AGR2 (r_s_ = 0.249, p = 0.025), KLF4 (r_s_ = 0.479, p < 0.001), NANOG (r_s_ = 0.646, p < 0.001), OCT4 (r_s_ = 0.554, p < 0.001), and SOX2 (r_s_ = 0.436, p < 0.001). We also observed a strong positive correlation between the expression of NOTCH1 and miR-150 (r_s_ = 0.318, p = 0.004). Results are summarized in Figure 4. All correlations are included in Supplementary Table S1, with corresponding statistical power and estimation of required sample size in Supplementary Table S2.
2.5. Immunohistochemical Expression of NOTCH1 Protein in Oral Epithelial Dysplasia
Immunohistochemical analysis of NOTCH1 protein expression was performed on 28 cases of oral epithelial dysplasia and normal oral mucosa (Figure 5).
Reaction against NOTCH1 was cytoplasmic, membranous, and sometimes nuclear, often in combination. In addition to epithelial cells, staining of endothelial cells and some inflammatory cells was also observed (Figure 5B).
In oral epithelium with no signs of dysplasia, NOTCH1 was present in the basal/parabasal cells, often with quite intense staining (Figure 5B). However, the reaction was sometimes patchy, with areas of weak or negative staining, of uncertain significance.
In nine (39%) cases of oral dysplasia, the NOTCH1 expression score was higher than in normal mucosa, mostly due to an increased extent of the reaction in higher epithelial layers (Figure 5D). In 11 cases of dysplasia (48%), NOTCH1 expression score was similar (eight cases, 35%) or lower (three cases, 13%) than in normal mucosa; even though the extent of reaction was often increased, the intensity was lower (Figure 5E). In three (13%) cases of dysplasia, staining was completely negative or present only in rare cells, with staining of endothelial cells serving as a positive control.
Finally, we did not observe any association between mRNA expression of NOTCH1, other stem cell markers, or miRNAs and immunohistochemical expression of the NOTCH1 protein.
3. Discussion
We analyzed the expression of NOTCH1, stem cell marker mRNAs AGR2, KLF4, NANOG, OCT4 and SOX2, and miRNAs miR-27a, miR-34a, miR-128, miR-145, miR-150, and miR-335 in oral epithelial dysplasia and normal oral mucosa. We found a consistent increase in mRNA levels of NOTCH1 in LG and HG dysplasia in comparison with normal mucosa. Similar to NOTCH1, mRNA levels of all analyzed CSC markers—AGR2, NANOG, OCT4 and SOX2—except KLF4 were also consistently elevated in dysplasia, as were miR-150 and miR-128, with miR-128 up-regulation observed only in HG dysplasia. We found a positive correlation between expression of NOTCH1 mRNA with expression of mRNAs of all analyzed CSC markers, as well as with expression of miR-150. Immunohistochemical expression of NOTCH1 in oral epithelial dysplasia was variable, showing up-regulation, down-regulation, or expression scores similar to normal mucosa.
To the best of our knowledge, there are no data in the literature on the expression of NOTCH1 mRNA in oral epithelial dysplasia. Therefore, the potential biological and clinical significance of NOTCH1 mRNA levels in oral epithelial dysplasia is not known. In contrast to oral dysplasia, increased expression of NOTCH1 mRNA has previously been demonstrated in a subset of OSCC [17]. That study compared levels of NOTCH1 mRNA in OSCC and oral lichen planus; normal mucosa was not included. Although oral lichen planus is currently accepted as a potential precancerous lesion, it cannot be directly compared with oral epithelial dysplasia. On the other hand, others have indicated down-regulation of NOTCH1 mRNA in OSCC [18]. Little is known about the clinical significance of NOTCH1 mRNA levels in OSCC. Some studies, including our own, have indicated prognostic benefits of higher NOTCH1 mRNA levels in OSCC [14,19], while others found no association [17].
In contrast to mRNA, expression of NOTCH1 protein in oral epithelial dysplasia, OSCC, and normal oral mucosa has been more extensively studied. In the present study, we found immunohistochemical expression of NOTCH1 in the basal/parabasal cells of normal epithelium, in accordance with other authors [3,4,5,18]. Immunohistochemical expression of NOTCH1 in oral epithelial dysplasia in our study was variable, showing either up-regulation or down-regulation, or expression scores similar to normal mucosa. Previous results on immunohistochemical expression of NOTCH1 in oral epithelial dysplasia in comparison with normal mucosa are also variable. Some authors reported a fairly consistent up-regulation [5] or down-regulation [18] of NOTCH1 in dysplasia, while others reported variable expression, with either a general increase [4] or decrease [3] of NOTCH1.
Clinical significance of NOTCH1 immunohistochemical expression in oral epithelial dysplasia is controversial: various studies have reported increased risk of malignant progression associated with either high [4] or low [3] levels of NOTCH1. In our study, no correlation between expression of NOTCH1 mRNA and NOTCH1 protein was observed, which might be the result of methodology, but may also reflect complex post-transcriptional regulation of NOTCH1 expression during oral cancerogenesis. The expression patterns of NOTCH1 in oral epithelial dysplasia found in the present study are in accordance with the complex role of NOTCH in head and neck carcinogenesis, with both oncogenic and tumor-suppressive roles, regulating or being regulated by other factors [2].
It is therefore not surprising that we observed positive correlation between NOTCH1 mRNA levels and mRNA levels of CSC markers, ARG2, KLF4, NANOG, OCT4, and SOX2, as well as with miR-150 in oral epithelial dysplasia. To the best of our knowledge, correlation between NOTCH1 and CSC markers ARG, KLF4, NANOG, OCT4, and SOX2 in oral epithelial dysplasia has not yet been described. However, we have previously shown that expression of NOTCH1 was correlated with KLF4, NANOG, and OCT4 in OSCC [14]. Our observations are supported by other studies. Lee et al. [8] created cells ectopically expressing the Notch intracellular domain and examined self-renewal capacity and CSC marker expression. Constitutive activation of the Notch intracellular domain promoted self-renewal capacity of HNSCC cells and increased expression of CSC markers OCT4, SOX2, and CD44, suggesting that NOTCH1 may be a critical regulator of stemness in HNSCC [8]. Clinical and functional significance of NOTCH1 alterations were analyzed by Pawan et al. in 68 cases of early-stage SCC of the tongue. They showed that NOTCH1 harbors a low frequency of inactivating mutations and can be amplified and/or overexpressed. HNSCC cell lines overexpressing NOTCH1, when plated in the absence of attachment, were enriched in stem cell markers [20].
CSC markers have previously been shown in various studies, including ours, to be important contributors to development of SCC [14,16]. Immunohistochemical analyses of CSC markers have shown elevated expression in oral epithelial dysplasia [21], with limited data about their mRNA expression. In OSCC, we and others have shown that both, ARG2 and KLF4 are up-regulated [14,22], and it has been further shown that KLF4 may act both as a tumor suppressor and as an oncogene [22]. Two other studies investigated combined expression of OCT4 and SOX2 in oral epithelial dysplasia and OSCC. In the first study, using qPCR, there was a significant difference in SOX2 and OCT4 expression between OSCC and oral epithelial dysplasia, with increased expression of SOX2 and OCT4 in OSCC, showing correlation with higher tumor grade and with each other [23]. The second study, using immunohistochemistry, investigated association between expression of SOX2, OCT4, and WNT5A in oral epithelial dysplasia, oral SCC, and normal oral mucosa. SOX2 expression was higher in OSCC than in oral epithelial dysplasia and very low in normal oral mucosa. OCT4 was very low in OSCC and oral epithelial dysplasia when compared with SOX2, while negative in normal tissues [24]. Expression of NANOG in oral epithelial dysplasia and OSCC has been more extensively studied. de Vicente et al. immunohistochemically evaluated NANOG expression in oral epithelial dysplasia and OSCC. Their results suggested clinical relevance of NANOG in early stages of OSCC development, and its expression emerged as an early predictor of cancer risk in patients with oral epithelial dysplasia [25]. Similarly, we observed a consistent strong staining for NANOG protein in HG dysplasia and OSCC, with no staining of normal mucosa and very weak staining in LG dysplasia. NANOG protein detection has diagnostic potential for oral HG dysplasia, distinguishing it from LG dysplasia and reactive lesions [16]. In the present study, we also aimed to determine whether NOTCH1 immunohistochemistry could be useful in oral pathology similarly to NANOG, as a diagnostic marker for identifying patients at risk. Even though alterations of NOTCH1 protein in oral epithelial dysplasia and OSCC exist, they are variable and complex, thus making NOTCH1 unreliable as a simple diagnostic marker. Future developments in understanding NOTCH1 regulation may bring new insights into the clinical relevance of NOTCH1 expression patterns in oral epithelial dysplasia and OSCC.
Finally, our study showed up-regulation of miR-150 and miR-128 in oral epithelial dysplasia in comparison with normal mucosa, with miR-128 up-regulation observed only in HG dysplasia. We also observed a strong positive correlation between NOTCH1 and miR-150. No correlation between expression of miR-150 or miR-128 and NOTCH1 protein was found. The meaning of these results is currently unclear. Expression of miR-128 and miR-150 in invasive OSCC has been previously studied. In some cancers, miR-150 acts as an oncogene and has been positively correlated with metastasis and tumor recurrence, while in other studies it has been shown to act as a tumor suppressor [26]. For miR-128, data are limited, but cell line-based experiments suggest a tumor-suppressive role of miR-128 in HNSCC [15,27,28]. Similar data based on cell line experiments are found in the literature for miR-150 [29,30,31,32]. To the best of our knowledge, expression of miR-150 and miR-128 in oral epithelial dysplasia has not yet been described in the literature.
4. Materials and Methods
4.1. Patients and Tissue Samples
Our study included formalin-fixed paraffin-embedded tissue samples from 36 cases of oral epithelial dysplasia and 15 cases of normal oral mucosa. Among the 36 patients with dysplasia, 22 were male and 14 female, aged 43–85 years (64.47 ± 9.78). Samples of normal oral mucosa were obtained from patients surgically treated for non-neoplastic lesions; four patients were males and 11 females, aged 35–86 years (60.67 ± 14.89).
After the surgical procedure, samples were fixed in formalin for 24 h, embedded in paraffin (FFPE), cut at 3–4 µm, stained with hematoxylin and eosin (HE), and analyzed according to standard histopathological procedures. For the purpose of our study, representative samples were selected from the archive of the Institute of Pathology. Representative areas of microscopically normal mucosa and dysplasia on HE slides were chosen and marked for subsequent punching for RNA isolation. We obtained 87 tissue samples in total: 72 samples of dysplasia (2 samples from each patient, one with LG dysplasia and one with HG dysplasia) and 15 samples of normal oral mucosa.
4.2. Isolation of RNA
Using a 0.6 mm needle (Manual Tissue Arrayer MTA, Beecher, Estigen, Tartu, Estonia), representative areas were punched from FFPE tissue blocks. After punching, an additional slide was cut, stained with HE, and evaluated by a pathologist. Punching was followed by manual isolation of total RNA using the MagMAX FFPE DNA/RNA Ultra kit (Applied Biosystems; Thermo Fisher Scientific, Foster City, CA, USA). The isolation was performed according to the manufacturer’s instructions with one modification. Briefly, after deparaffinization and xylene removal, protease digestion was performed overnight (300 rpm for 15 s every 4 min). The concentrations of isolated RNAs were assessed fluorometrically on Qubit 3.0 (Applied Biosystems; Thermo Fisher Scientific, Foster City, CA, USA), and purity was analyzed using ND-One.
4.3. Reverse Transcription
Total RNA was reverse transcribed (RT) using miScript II RT (Qiagen, Hilden, Germany) according to the manufacturer’s instructions and used to analyze the expression of both mRNAs and miRNAs. The RT reaction volume was 14 µL RT, including 7.94 uL (12 ng/uL) of total RNA, 2.8 µL HiFlex buffer, 1.4 µL 10× Nucleic mix, 1.4 µL of miScript RT enzyme, and 0.46 µL of RNaze inhibitor (Qiagen, Hilden, Germany). The reaction was performed at 37 °C for 60 min and at 95 °C for 5 min (SimpliAmp Thermal Cycler, Applied Biosystems; Thermo Fisher Scientific, Foster City, CA, USA).
4.4. Quantitative Real-Time PCR
All quantitative real-time PCR (qPCR) reactions for mRNAs and miRNAs were performed using the ViiA 7 Real-Time PCR System (Applied Biosystems; Thermo Fisher Scientific, Foster City, CA, USA).
Efficiencies of qPCR reactions were calculated using pools of isolated RNAs for each group of samples (normal mucosa, LG dysplasia, HG dysplasia). Reactions were performed in triplicate. For mRNAs, pre-amplified cDNA (see Section 4.4.1) was diluted 5-, 25-, 125-, and 625-fold for each mRNA analysis. For miRNAs, cDNA was diluted 10-, 25-, 100-, 125-, 625-, 1000-, and 3125-fold and used in qPCR reactions, as described below.
4.4.1. Pre-Amplification of mRNAs
Prior to qPCR, pre-amplification of mRNAs was performed using TaqMan PreAmp Master Mix, according to the manufacturer’s instructions (Applied Biosystems; Thermo Fisher Scientific, Foster City, CA, USA). The pre-amplification reaction, with a total volume of 20 µL, included 6.25 µL of cDNA, 6.25 µL of pooled 0.2× TaqMan Gene Expression Assays diluted in Tris-EDTA buffer solution, pH 8.0 (Sigma-Aldrich; Merck KGaA, Darmstadt, Germany), and 12.5 µL 2× TaqMan PreAmp Mastermix (Applied Biosystems; Thermo Fisher Scientific, Foster City, CA, USA). The program of 10 min at 95 °C and 10 cycles of 15 s at 95 °C and 4 min at 60 °C using a SimpliAmp Thermal Cycler (Applied Biosystems; Thermo Fisher Scientific, Foster City, CA, USA).
4.4.2. qPCR for TaqMan Assays
TaqMan assays were used for analyzing the expression of AGR2, KLF4, NANOG, NOTCH1, OCT4 and SOX2, which were normalized to GAPDH, IPO8 and HPRT1 (Table 1). Each qPCR reaction contained 5 µL of 2× TaqMan Gene Expression Master Mix, 4.5 µL of pre-amplified cDNA (fivefold dilution) and 0.5 µL 20× TaqMan Gene Expression Assay (Applied Biosystems; Thermo Fisher Scientific, Foster City, CA, USA). qPCR reactions were performed in duplicate as follows: 50 °C for 2 min, 95 °C for 10 min, and 45 cycles at 95 °C for 15 s and 60 °C for 1 min.
4.4.3. qPCR for miRNAs
For miRNA expression analysis, the miScript SYBR Green PCR Kit (Qiagen, Hilden, Germany) was used. Investigated miRNAs (miR-27a, miR34a, miR-128, miR-145, miR-150, and miR-335) were normalized to SNORD61 and SNORD95 (Table 1). qPCR reactions, each with a total volume of 10 µL, contained 5 µL of 2× miScript SYBR Green PCR Mix, 2 µL of cDNA (100-fold dilution), 1 µL 10× miScript Universal Primer, 1 µL 10× miScript Primer, 0.05 µL of ROX dye, and 0.95 µL ddH_2_O. qPCR reactions were performed in duplicate as follows: 95 °C for 15 min and 45 cycles at 94 °C for 15 s, 55 °C for 30 s, and 70 °C for 30 s. At the end of each reaction, melting curves were acquired on the SYBR channel using a ramping rate of 0.7 °C/60 s from 60 to 95 °C.
4.5. Immunohistochemical Detection of NOTCH1
For immunohistochemistry, commercially available anti-NOTCH1 antibody (Cell Signaling, cat no. 3608, clone D1E11, dilution 1:200) (Merck, Kenilworth, NJ, USA) was used on unstained 3–4 µm thick slides cut from FFPE tissue blocks. Automated immunostaining was performed using BenchMark ULTRA (Ventana, Tuscon, AZ, USA). For visualization, peroxidase and 3,3′-diaminobenzidine incubation (UltraVIEW DAB Detection Kit, Roche, Basel, Switzerland) was used, followed by counterstaining with hematoxylin.
Reactions were assessed semi-quantitatively. We separately evaluated the extent of staining (less than 5% of cells—score 0, 5–20%—score 1, 21–50% of cells—score 2, 51–80% of cells—score 3, above 80% of cells—score 4) and the intensity of staining (negative—score 0, very weak but higher than background, if present—score 0.5, weak—score 1, moderate—score 1.5, strong—score 2). The final expression score was calculated by multiplying the extent and intensity scores. Cellular localization of staining (cytoplasmic, membranous, nuclear) was also noted.
4.6. Statistical Analysis
Data were analyzed according to Latham [33], for both mRNA and miRNA. For each sample, ∆Cq was calculated. The geometric mean of Cqs of reference genes (IPO8, GAPDH, HPRT1 for mRNAs; SNORD61, SNORD95 for miRNAs) was first calculated and then subtracted from mRNAs or miRNAs, respectively. The obtained ∆Cq was used for all statistical analyses. For comparison of relative mRNA and miRNA expression between independent groups, the Mann–Whitney U test was used, including correction for multiple comparisons using the Bonferroni method. For correlation analysis between different mRNAs (NOTCH1 and stem cell markers), as well as between NOTCH1 and miRNAs, Spearman’s rank correlation coefficient test was used, including calculation of statistical power and estimation of the needed sample size. Statistical analysis of data was performed using IBM SPSS Statistics 27 software (SPSS Inc., Chicago, IL, USA). Differences were considered significant at the cut-off p < 0.05 (two-tailed).
5. Conclusions
In conclusion, our study showed that, even though NOTCH1 expression is immunohistochemically variable, its RNA expression suggests that it might contribute to the development of CSC-like properties in oral epithelial dysplasia. Moreover, it might influence the expression of miRNAs, e.g., miR-150, which could further regulate a plethora of different genes in oral epithelial dysplasia.
The reference list from the paper itself. Each links out to its DOI / PubMed record.
- 1Zhou B. Lin W. Long Y. Yang Y. Zhang H. Wu K. Chu Q. Notch signaling pathway: Architecture, disease, and therapeutics Signal Transduct. Target. Ther.202279510.1038/s 41392-022-00934-y 35332121 PMC 8948217 · doi ↗ · pubmed ↗
- 2Shi Q. Jiang S. Zeng Y. Yuan X. Zhang Y. Chu Q. Xue C. Li L. A Notch signaling pathway-related gene signature: Characterizing the immune microenvironment and predicting prognosis in hepatocellular carcinoma J. Transl. Intern. Med.20241255356810.1515/jtim-2024-002040708676 PMC 12288947 · doi ↗ · pubmed ↗
- 3Ahmed H. Paterson I. Aziz S.A. Cremona O. Robinson M. Carrozzo M. Valentine R.A. Expression of Epsin 3 and its interaction with Notch signalling in oral epithelial dysplasia and oral squamous cell carcinoma J. Oral Pathol. Med.20235271071710.1111/jop.1346037339783 · doi ↗ · pubmed ↗
- 4Ding X. Zheng Y. Wang Z. Zhang W. Dong Y. Chen W. Li J. Chu W. Zhang W. Zhong Y. Expression and oncogenic properties of membranous Notch 1 in oral leukoplakia and oral squamous cell carcinoma Oncol. Rep.2018392584259410.3892/or.2018.633529620248 PMC 5983926 · doi ↗ · pubmed ↗
- 5Yoshida R. Nagata M. Nakayama H. Niimori-Kita K. Hassan W. Tanaka T. Shinohara M. Ito T. The pathological significance of Notch 1 in oral squamous cell carcinoma Lab. Investig.2013931068108110.1038/labinvest.2013.9523938602 · doi ↗ · pubmed ↗
- 6De Vicente J.C. Lequerica-Fernandez P. Rivas H.T. Blanco-Lorenzo V. Lopez-Fernandez A. Escalante-Narvaez S.A. Herrera I.N.S. Rodrigo J.P. Alvarez-Teijeiro S. Garcia-Pedrero J.M. Immunohistochemical Evaluation of NOTCH 1 Signaling Pathway in Oral Squamous Cell Carcinoma: Clinical and Prognostic Significance Int. J. Mol. Sci.202526916710.3390/ijms 2618916741009728 PMC 12470844 · doi ↗ · pubmed ↗
- 7Shah P.A. Huang C. Li Q. Kazi S.A. Byers L.A. Wang J. Johnson F.M. Frederick M.J. NOTCH 1 Signaling in Head and Neck Squamous Cell Carcinoma Cells 20209267710.3390/cells 912267733322834 PMC 7764697 · doi ↗ · pubmed ↗
- 8Lee S.H. Do S.I. Lee H.J. Kang H.J. Koo B.S. Lim Y.C. Notch 1 signaling contributes to stemness in head and neck squamous cell carcinoma Lab. Investig.20169650851610.1038/labinvest.2015.16326927514 · doi ↗ · pubmed ↗