Integrated Immune and Molecular Profiling Identifies Prognostic Subgroups and Therapeutic Targets in Chondrosarcoma
Agnieszka E. Zając, Piotr Rutkowski, Anna Szumera-Ciećkiewicz, Jakub Piątkowski, Paweł Teterycz, Emanuela Palmerini, Aurélie Dutour, Justyna Tuziak-Klym, Michał Wągrodzki, Andrzej Pieńkowski, Andrzej Tysarowski, Marco Gambarotti, Giorgio Frega, Michela Pierini, Alberto Righi

TL;DR
This study identifies immune and genetic subgroups in chondrosarcoma, revealing potential targets for immunotherapy and new prognostic markers.
Contribution
The paper introduces an immune–mutational classification system for chondrosarcoma with potential therapeutic implications.
Findings
Three immune subtypes (cold, hot, intermediate) were identified in chondrosarcoma patients.
IDH1 mutations and immune subtype IMP2 are linked to worse survival outcomes.
An immune–mutational classification could guide future immunotherapy and IDH inhibitor treatments.
Abstract
Chondrosarcoma (ChS) is a rare bone malignancy with heterogeneous behavior, the molecular and immunological background of which remains unknown. No effective systemic treatment for advanced ChS patients is available. The aim of this study was to develop an immune–mutational classification of ChS and to search for novel prognostic factors and molecular targets. We performed an immunological–molecular profiling of 99 patients diagnosed with primary ChS G1–G3 and dedifferentiated ChS. An expression of 20 immune response markers was assessed by IHC and targeted the next-generation sequencing of 409 genes was performed. Immunological and mutational profiles were correlated with overall survival using a multivariate LASSO-penalized Cox model. Three immunophenotypes were described—“cold” (IMP1), “hot” (IMP2), and “intermediate” (IMP3). IMP1 was the most prevalent in G1 cases, while IMP2 was…
Genes, proteins, chemicals, diseases, species, mutations and cell lines named across the full text — each resolved to its canonical identifier and authoritative record.
Click any figure to enlarge with its caption.
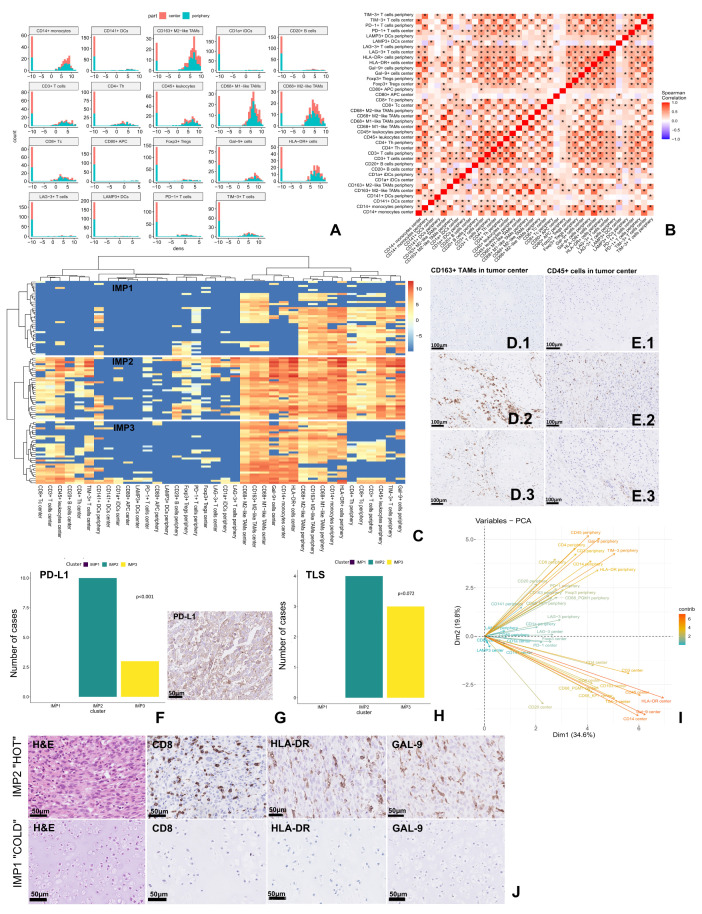 Figure 1
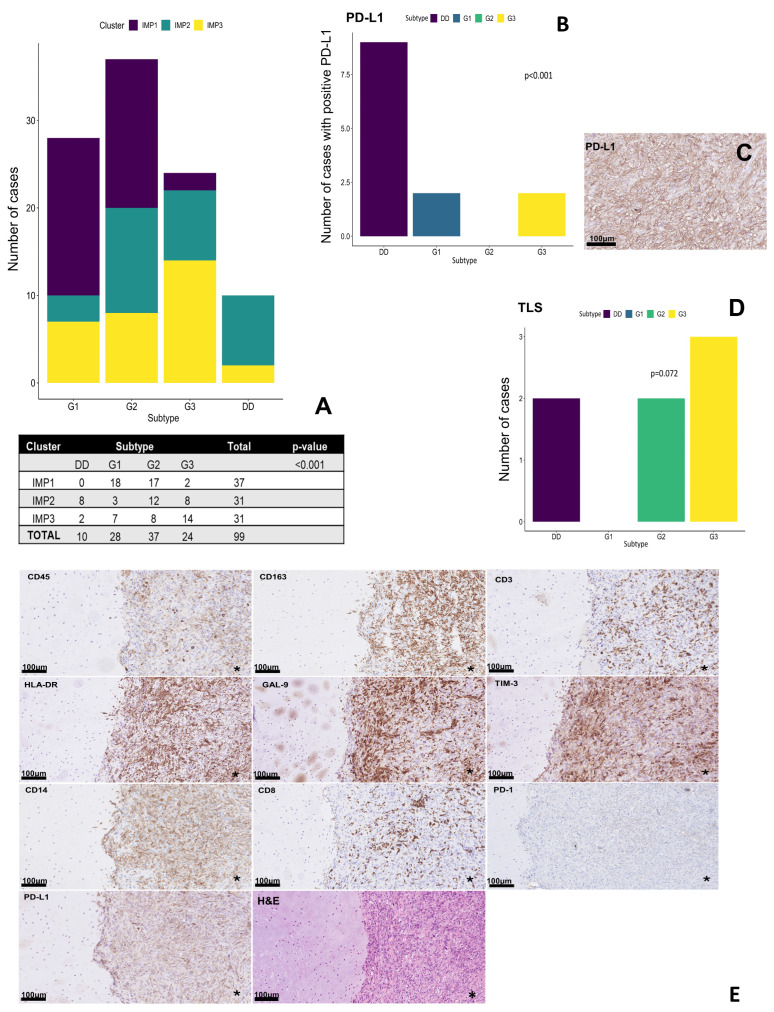 Figure 2
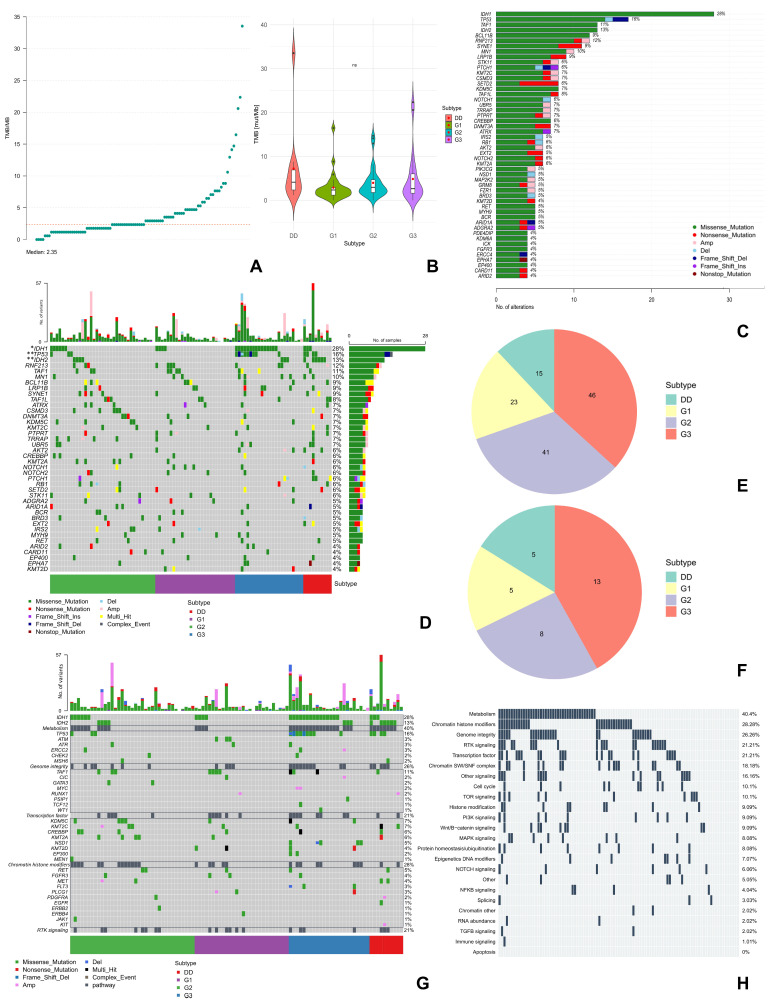 Figure 3
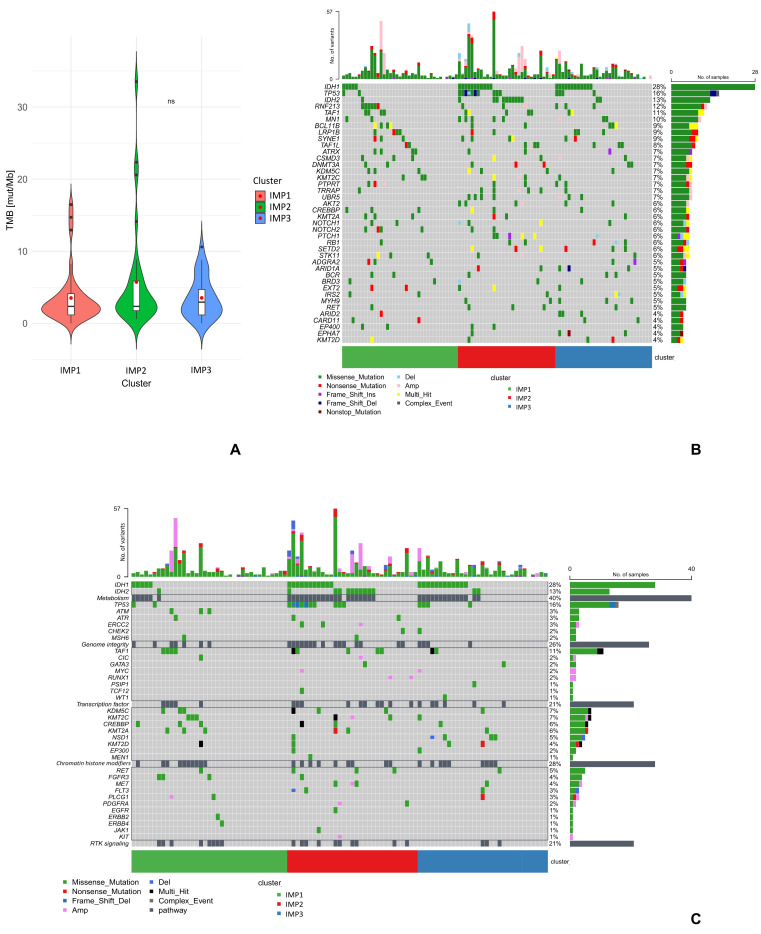 Figure 4
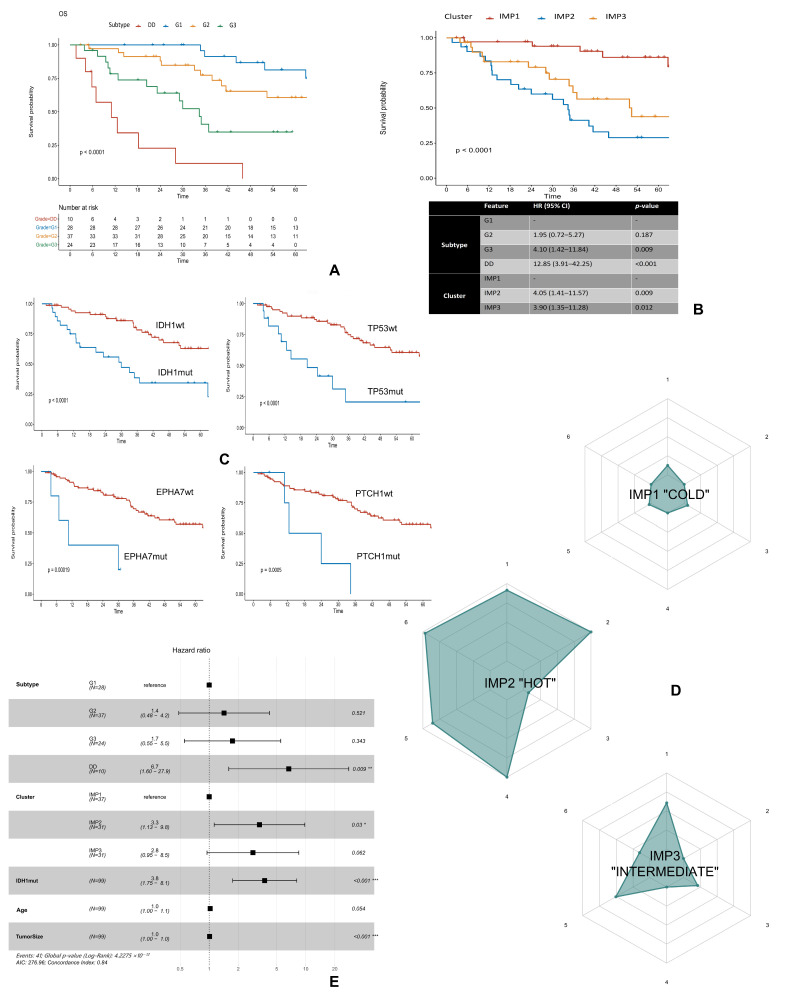 Figure 5
- —National Science Centre
- —Regional Center for Digital Medicine (RCMC)
Peer Reviews
No public reviews on file for this paper yet. If you reviewed it on a platform where reviews are public (OpenReview, ICLR, NeurIPS, ICML), you can paste yours below so the community can read it here.
Videos
No videos yet. Explain this paper in a talk, walkthrough, or lecture? Add one.
Taxonomy
TopicsBone Tumor Diagnosis and Treatments · Sarcoma Diagnosis and Treatment · Musculoskeletal synovial abnormalities and treatments
1. Introduction
Chondrosarcoma (ChS) is a rare primary malignant bone tumor, representing 20–30% of all bone sarcomas and ranking second in prevalence after osteosarcoma [1,2,3]. Despite representing only 1% of all malignancies, ChS exemplifies one of oncology’s most pressing therapeutic challenges. ChS encompasses a heterogeneous group of histological subtypes, each with distinct morphological features and prognostic outcomes [2]. The prognostic heterogeneity—from 99% 5-year survival in ChS grade 1 (G1) to less than 24% in dedifferentiated ChS (DDCS)—underscores the critical need for biomarker-driven patient stratification to guide therapeutic decisions and clinical trial enrollment [2,4].
The primary approach to managing ChS remains surgical excision with clear (R0) margins, as these tumors are highly resistant to standard chemotherapy and radiotherapy [5,6,7,8,9]. Currently, there is no specific treatment for locally advanced or unresectable ChS, since chemotherapy and targeted therapies typically have limited success [10,11,12]. Recent reports of responses to immune checkpoint inhibitors (ICIs) such as nivolumab and pembrolizumab in advanced ChS and DDCS—with objective response rates of 20–25% for DDCS—are promising but require validation in larger, more stratified cohorts [11,13,14,15].
Genomic profiling has revealed recurrent mutations in IDH1/2, enzymes central to the Krebs cycle, as well as alterations in PI3K-AKT, p53, and Hedgehog signaling pathways [2,16,17,18,19,20,21,22,23,24]. These insights offer potential targets for precision therapies. Despite low tumor mutation burden (TMB) and rare microsatellite instability (MSI), which typically predict poor immunotherapy response, the integration of multi-omic data may help identify actionable vulnerabilities. Personalized combination strategies targeting multiple oncogenic pathways are emerging as a viable approach [25].
The convergence of recent immunotherapy responses in selected ChS patients and advances in tumor immune profiling presents an opportunity to develop precision medicine approaches for this rare malignancy. However, the lack of validated biomarkers for patient selection remains a critical barrier to therapeutic progress. To overcome these challenges, this multicentric study aims to develop a classification system for ChS patients based on immunological and molecular profiles, enabling the identification of individuals who may benefit from immunotherapy, and discover new potential prognostic factors and molecular targets for future therapeutic strategies.
2. Results
2.1. Hierarchical Clustering of Immune Markers Identifies Three Prognostic Immunophenotypes in Chondrosarcoma
A high density of HLA-DR+ antigen-presenting cells (APCs), CD14+ monocytes, CD68+ M1-like tumor-associated macrophages (TAMs), and CD163+ M2-like TAMs, as well as galectin 9 (Gal-9)+ cells was observed, with no differences between peripheral and central parts. CD68+ M2-like TAMs and TIM-3+ T cells were the second most frequently observed immune infiltrates, followed by helper and cytotoxic T cells (presented in Figure 1A, technical details of selected antibodies are presented in Table S1). The density of CD45+ leukocytes was significantly higher in the peripheral region of the tumor compared to the central region, which was also observed for programmed death receptor 1 (PD-1)+, CD3+, and CD4+ T cells, as well as CD141+ dendritic cells (DCs). The analysis of comparisons of densities of individual markers in the central and peripheral regions of the tumor is presented in the Table S2.
The strongest positive and significant correlation (rho > 0.9) was identified between the presence of M1 and M2-like TAMs (CD68+ and CD163+ cells) in the central part of the tumor. A strong positive correlation (rho > 0.7) was also observed for the expression of HLA-DR and CD45, CD14, Gal-9, TIM-3, or CD163 markers in the central and peripheral regions (Figure 1B). Furthermore, in the peripheral region of the tumor, both HLA-DR+ and TIM-3+ cells were correlated with the presence of PD-1+ cells. On the other hand, the presence of the CD14 marker strongly correlated with the infiltration of CD163+ M2-like TAMs and “exhausted” T cells (Gal-9+ or TIM-3+) in the central and peripheral regions of the tumor (Figure 1B).
Based on the clustering of immune data from both tumor regions, we identified three different immunophenotypes (IMPs): IMP1—a “cold” phenotype with the lowest density of total immune cells and most of the cells located in the peripheral tumor region (Figure 1C—IMP1,D.1,E.1,J-IMP1); IMP2—a “hot” phenotype with the highest number of immune cells in both the central and peripheral regions of the tumor, and the highest expression of HLA-DR+, CD163+, Gal-9+ and PD-1+, and CD8+ cells in the intratumoral region (Figure 1C—IMP2,D.2,E.2,J-IMP2); and IMP3—the “intermediate” phenotype with a lower number of immune cells compared to IMP2, but with the presence of various immune cells also intratumorally (Figure 1C—IMP3,D.3,E.3). IMP2 was also characterized by the highest expression of programmed death ligand 1 (PD-L1) (Figure 1F,G) and a more frequent presence of tertiary lymphoid structures (TLS) (Figure 1H), compared to IMP3. In the IMP1 cluster, neither PD-L1 expression nor TLS presence was observed. In addition, high expression of PD-L1 was detected mainly in the IMP2 group (5 of 6 cases). Of the greatest importance in the occurrence of individual IMPs was the presence of cells with HLA-DR, Gal-9, CD14, and CD45 expression in the central region of the tumor and Gal-9, CD45, and TIM-3 expression in the peripheral region (PCA in Figure 1I).
2.2. Grade-Dependent Immune Distribution Pattern
The presence of individual IMPs was different within the histological subtypes of ChS (Figure 2A). G1 ChS were characterized by a significant predominance of “cold” IMP1, while a similar proportion of the presence of IMP1 and “hot” IMP2 was observed in G2 ChS cases. In G3 cases, the proportion of IMP1 was lower compared to G1 and G2. DDCS was characterized by a higher number of immune cell infiltrates overall, especially in the differentiated component (Figure 2E), without the presence of IMP1. In addition, high expression of PD-L1 was observed only in DDCS, and its expression was significantly higher compared to other subtypes of ChS (Figure 2B,C). Interestingly, no PD-L1 expression was detected in G2 ChS (Figure 2B). On the other hand, TLS were observed only in high-grade ChS (G2/G3 and DDCS) (Figure 2D).
2.3. Molecular Profiling of Chondrosarcoma Revealed Significant Genetic Alteration Correlated with Aggressive Behavior
All samples were microsatellite stable. The mean TMB in the study group was 4.21 mut/Mb (0 to 33.5 mut/Mb) with a median of 2.35 mut/Mb (Figure 3A). TMB was higher in high-grade ChS, although the differences were not statistically significant (Figure 3B). The median TMB for each subtype was 2.35; 2.95; 2.65, and 4.12 mut/Mb for ChS G1, G2, G3, and DDCS, respectively (Figure 3B).
We identified 709 potentially pathogenic and somatic single-nucleotide variants (SNVs) of genes in NGS. The summary of variants is presented in Figure S1A. In addition, we detected a total of 156 copy number variants (CNVs), which were detected in 26.3% of patients. Both amplifications and large-scale deletions were most frequently observed in the G3 ChS cases (Figure 3E,F).
In the study population, the most frequently mutated genes (present in at least 10% of the samples) were IDH1/2 (41% of cases), TP53 (16%), RNF213 (12%), TAF1 (11%), and MN1 (10%) (Figure 3C and Figure S1A). However, only IDH1 (FDR < 0.05), IDH2 (FDR < 0.01), and TP53 gene mutations (FDR < 0.01) were significantly different between histological subtypes of ChS (Figure 3D, Table S3—testing the differences in gene mutations across tumor subtypes). IDH1 mutations were observed more frequently in ChS G2 and G3, whereas TP53 mutations (including CNV deletions) were prevalent in G3 ChS. On the other hand, IDH2 mutations were the most frequent in DDCS. None of the IDH2 or TP53 mutations was detected in G1 ChS (Figure 3D). Among the IDH1 mutations we detected common for ChS variants [22,27,28]—R132/L/C/S/F/G/Q, but also atypical V71A variant (Figure S1C); while the IDH2 mutations included R172/G/S/M variants, which has also been often reported [22,28,29] (Figure S1D). The IDH1 mutations significantly co-occurred with TP53 (p < 0.01) and UBR5 (p < 0.01) gene mutations, whereas IDH2 co-occurred with PTCH1 mutations (p < 0.01) (Figure S1B).
Receptor tyrosine kinases (RTKs)-signaling and p53-related pathways, as well as metabolism and chromatin remodeling processes, were the most frequently (>20% of cases) deregulated processes in the study group (Figure 3G,H and Figure S1E,F). However, high-grade ChSs were more often associated with large-scale genetic changes (CNVs) in genes related to RTKs. For example, FLT3 deletions and amplifications of BRAF, MET, MAP2K2, or FGFR1 were not observed in G1 ChS, unlike in other subtypes (Figure 3G and Figure S1E), whereas MYC or KIT amplifications were observed only in G3 ChS or DDCS, respectively (Figure 3G). In addition, deregulations in pathways involved in cellular metabolism and genome integrity were predominant in high-grade ChS (especially G3 and DDCS) (Figure 3G).
2.4. Molecular Correlates Supporting the IMP Pattern
The integration of molecular and immunological data revealed that IDH mutations are preferentially associated with the immunosuppressive “hot” IMP2, providing a potential mechanistic link between metabolic reprogramming and immune dysfunction (Figure 4B). There were no significant differences in any of the mutated genes, nor TMB values, between the different IMPs (Table S3—testing the differences in gene mutations across immune clusters). However, the highest TMB values were observed in the IMP2 group with an average TMB of 5.73 mut/Mb, while for the other IMPs, the average TMB was around 3.5 mut/Mb (Figure 4A).
We noticed that the genetic profile varied among the different IMPs (Figure 4B). IMP2 showed the highest number of CNVs (e.g., AKT2, STK11 amplifications, and NOTCH1 deletions), as well as IDH1/2 and TP53 mutations. Thus, the IMP2 was associated with deregulation in both metabolic and p53-related pathways, as well as with the RTK-signaling pathway (e.g., amplifications in MET, PDGFRA, and KIT genes) (Figure 4C). IMP3 was characterized by MN1 and UBR5 amplifications, PTCH1 and RB1 CNV deletions, but also frequent IDH1 mutations and a deregulated metabolic pathway. Mutations in the PTCH1, RB1, AKT2, or UBR5 genes were not observed in the IMP1. In addition, IDH mutations were less frequent in this group (Figure 4B).
2.5. Clinical Implications and Immunological–Molecular System of Chondrosarcoma Profiling
In the study population, the median overall survival (OS) was 64.6 (95% CI: 44.2—NR) months, while the median disease-free survival (DFS) was 32.1 (95% CI: 22–52.9) months. The 3-year OS rate was 91.3%, 77.3, 40.7%, and 11.4% for patients with diagnosed G1, G2, G3 ChS, and DDCS, respectively (Figure 5A).
In multivariate analysis, histological subtype and tumor size had a negative impact on patients’ OS and DFS. In addition, older age correlated with poor OS, while lower limb tumor location correlated with poor DFS (Table S4).
We identified three distinct IMPs with significant prognostic implications. Patients with the “hot” IMP2 were paradoxically associated with the shortest OS. The 5-year OS in this group of patients was only 29%, while for the IMP3 and IMP1 it was 44% and 86% (p < 0.05), respectively (Figure 5B).
Univariate Cox regression revealed four gene mutations that could negatively impact the OS of ChS patients, including IDH1, TP53, EPHA7, and PTCH1 genes with FDR < 0.05 (Table S5). The 5-year OS of patients with TP53 mutations was only 21%, while for patients without these mutations, the OS was 61%. For patients with and without IDH1 mutations, the 5-year OS was 34% and 63%, respectively. Patients with EPHA7 or PTCH1 gene mutations did not achieve the 3-year OS, while the 5-year survival rates for patients without these alterations were 57% (Figure 5C).
Constructed immunograms revealed that patients with IMP2 and the poorest prognosis had more immune cells in general (Figure S2), including immune suppressive cells, e.g., CD163+ TAMs (Figure 5D-IMP2, axis 1). In addition, these patients strongly expressed different ICPs, e.g., PD-L1, Gal-9 (Figure 5D-IMP2, axis 6) and more frequently displayed IDH1 mutations, unlike patients with IMP1 (Figure 5D-IMP1, axis 2). Patients with IMP3 as well as poor prognostics had some immune cell infiltrates but with frequent IDH1 mutations (Figure 5D-IMP3).
Final multiparametric analysis showed that in addition to tumor size and histologic subtype of ChS, the presence of an IMP2 (HR: 3.3, CI: 1.13–9.8, p < 0.05) and IDH1 mutations (HR: 3.8, CI: 1.75–8.1, p < 0.001) were independent negative prognostic factors (Figure 5E). Among all analyzed immune markers, only the occurrence of specific IMP were significant in the final analysis, opposite to individual markers.
3. Discussion
This study presents the first comprehensive immuno–molecular classification of chondrosarcoma and explores the relationships among immune microenvironmental profiles, molecular alterations, and clinical outcomes. We also indicate new directions for further ChS research.
We identified three different IMPs: IMP1 (“cold”), IMP2 (“hot”), and IMP3 (“intermediate”). Interestingly, IMP2 and IDH1 mutations were independent poor prognostic factors in ChS, and we believe that patients displaying those features can potentially benefit from immunotherapy and targeted therapies. The poorer prognosis seen in IMP2 (“hot”) tumors may be linked to an immune-exhausted phenotype. Although IMP2 showed the highest density of immune infiltrates, these were mainly tumor-associated macrophages expressing CD14, HLA-DR, and CD163, as well as Gal-9-positive cells. While M2 polarization was not predominant, TAMs overall could contribute to tumor progression and immunosuppression [30]. Therefore, this IMP can be classified as an “immune-infiltrated but functionally suppressed” IMP, which may explain the poorest prognosis in this group of patients. The significant co-expression of TIM-3 and PD-1 at the tumor periphery suggests the presence of TIM-3+PD-1+ T cells, consistent with “exhausted” CD8+ T cells previously reported in ChS [31]. Additionally, PD-L1 expression was correlated with IMP2/IMP3 and poor survival, confirming earlier findings that identify PD-L1 as a negative prognostic factor in ChS [32,33]. However, since PD-L1 expression was mainly observed in DDCS and it was observed in a low number of patients in total, these results should be interpreted with caution and regarded as exploratory results rather than conclusive. Meanwhile, Galectin-9 expression, although not previously reported in ChS, is a known immunosuppressive mediator in osteosarcoma. TIM-3/Gal-9 interactions can suppress Th1 cell activity and promote regulatory T cell expansion [34]. Gal-9 may also induce apoptosis of CD8+ T cells or influence macrophage polarization toward M2-like phenotypes [35,36]. Our findings suggest that Gal-9 contributes to a dysfunctional immune environment in ChS, potentially explaining the discrepancy between HLA-DR expression and ineffective antigen presentation. The presence of antigen-presenting cells without a corresponding cytotoxic response indicates defective immune activation in ChS, resulting in poor survival. Therefore, Gal-9 could serve as a promising prognostic biomarker and therapeutic target in ChS.
The presence of an immunosuppressive environment in ChS has also been suggested in some other studies. In the analysis of 21 cases of conventional ChS (G1–G3), three immune clusters were described: “granulocytic-myeloid-derived suppressor cell (G-MDSC)-dominant”, “immune-exhausted”, and “immune-desert” phenotypes [31]. In addition, Richert et al. [37] observed the presence of several markers suggestive of an immunosuppressive TME, such as the expression of PD-L1 in DDCS, and the presence of TAMs (CD68+ or CD163+) and TILs in DDCS and conventional ChS [37]. Additionally, a study involving over 500 soft tissue sarcomas identified immune phenotypes (“hot,” “moderate,” “cold”) like our findings, with the immunosuppressive ‘hot’ subtype showing the shortest progression-free survival (PFS) [38].
The presented work in this study, that increased immune cell infiltration of DDCS compared to conventional ChS, has been observed in several other studies [37,39], as well as higher immunogenicity in high-grade ChS (G2/G3) compared to G1 ChS [31,40]. The increased immunogenicity in high-grade ChS may be related to the morphological changes, that is, a reduction in the cartilaginous matrix (in G2/G3 ChS) or the dedifferentiation of chondrocytes in DDCS [2,41,42], which may lead to facilitated infiltration of immune cells in these ChS subtypes.
In our study, the processes related to epigenetic processes, e.g., histone chromatin modifiers, were deregulated in approximately one-third of patients. Histone modifications, including methylation, can be associated with IDH mutations and overproduction of the oncometabolite 2-hydroxyglutarate (2-HG), which can further lead to the silencing of gene expression [43,44,45]. As previously reported, aberrant epigenetic regulation, mediated by IDH mutations, appears to be integral to ChS pathogenesis [46,47]. Molecular profiling revealed frequent IDH1/2 mutations in high-grade tumors (G3 and DDCS), supporting their role as early driver events promoting progression, which can be responsible for the progression from low-grade to high-grade, particularly toward DDCS [29,48]. On the other hand, epigenetic studies showed that conventional ChS and DDCS have different methylation profiles, which can depend on the presence of IDH1/2 mutations. This may cause the de novo development of a more malignant form of ChS [27,48,49].
In multivariate analysis, IDH1 mutations were confirmed as having independent prognostic significance. Although previous studies yielded inconsistent survival data [28,29,44,50,51], our results and a recent analysis of 488 ChS patients (HR = 1.90; 95% CI: 1.06–3.42; p = 0.03) confirm the adverse prognostic role of IDH1/2 mutations in ChS [52]. IDH1/2 mutations and 2-HG overproduction are related to many cellular processes that could potentially affect the survival of ChS patients. Mechanistically, IDH mutations and 2-HG accumulation disrupt NADP^+^/NADPH balance, elevate reactive oxygen species (ROS), and enhance DNA damage. They may also activate mTOR signaling independently of PI3K/PTEN, or lead to global hypermethylation [27,44,45,53]. On the other hand, IDH1 mutations could also influence the TME of ChS. Mutations in this gene predominantly affected patients with IMP2 and IMP3. The positive correlation between the IDH1 mutation and infiltration of T cells, DCs, and G-MDSC has already been found in ChS patients [31]. The 2-HG-mediated alteration of the extracellular matrix (ECM) and immune cell phenotype may impair immune surveillance and facilitate tumor escape [44,54]. Analogous mechanisms in gliomas demonstrate that IDH1 mutations can suppress NK and T cell function, promoting immunosuppression [55]. The 2-HG, particularly the D-enantiomer produced by mutated IDH1/2 enzymes, acts as an oncometabolite that drives tumor progression by reprogramming the TME, leading to T cell exhaustion and suppression of NK cells. Moreover, the hypermethylated state caused by 2-HG overproduction inhibits cellular differentiation, trapping tumor cells in an undifferentiated, stem-like state [56]. Therefore, IDH mutation can finally promote a pro-tumorigenic, immunosuppressive environment. These findings imply a dual oncogenic role for IDH1 mutations and 2-HG-mediated metabolic and epigenetic pathways—driving tumor progression and modulating immune evasion in ChS.
Moreover, TP53 and RB1 mutations, found in high-grade tumors, especially in G3 ChS, confirm earlier reports designating p53 pathway alterations as late events in ChS progression [22,57,58,59]. In addition, the presence of large-scale mutations in genes encoding kinases and growth factor receptors in G2/G3 ChS and DDCS suggests an important role of RTK-signaling pathways, including RTK-Ras-extracellular signal-regulated kinase (ERK) and/or PI3K-Akt [60,61], in the progression of these tumors.
The evaluation of EPHA7 and PTCH1 mutations as prognostic factors in the OS of ChS seems to be unique for the present study. The EPHA7, a member of the ephrin RTK family, participates in PI3K–AKT-dependent tumorigenic pathways [62,63]; whereas PTCH1 encodes a key component of the Hedgehog pathway [24]. Their association with poor prognosis, particularly in high-grade ChS, highlights their potential as novel molecular markers with potential clinical implications. These findings also suggest that Hedgehog signaling may influence both tumorigenesis and subsequent tumor progression [19].
Our multiparametric study integrated immunophenotypic and genomic data from nearly 100 ChS patients (G1–G3, DDCS) and demonstrated that ChS classification based on immune–molecular profiles is feasible and clinically relevant. Both the histological grade and molecular profile shape the ChS immunological landscape, with the “hot” IMP2 phenotype and IDH1 mutations independently predicting poor survival. Our study confirms the potential for precision immuno-oncology approaches in ChS. Patients harboring both biomarkers may benefit from dual-targeted strategies combining immune checkpoint blockade (e.g., TIM-3/Gal-9 inhibition) with IDH-mutant-targeted therapy. Although early clinical trials of PD-1/PD-L1 inhibitors in ChS yielded limited benefit [10,11,12]; our results indicate that alternative checkpoints (Gal-9, TIM-3) warrant exploration as therapeutic targets.
In conclusion, our study provides a novel immune–molecular taxonomy of ChS, integrating immune phenotypes with mutational signatures. The identification of a poor-prognosis subgroup characterized by “hot” IMP2 and IDH1 mutations may support the rationale for combined immunotherapy and metabolic-targeted interventions. It may also support the use of personalized therapeutic approaches in patients with ChS. The combination of ICP inhibitors and targeted therapies against TME modulating factors is currently being tested in numerous clinical trials and appears promising in the treatment of solid tumors [64]. The results presented in this paper suggest that Gal-9/TIM-3 and IDH1 inhibitors may be a promising direction for developing a future therapy for these tumors. However, further investigation into the molecular crosstalk between IDH1 mutations, epigenetic dysregulation, and immune suppression will be essential for developing effective personalized treatment strategies in ChS. Importantly, the proposed immune classification is exploratory and requires validation in independent cohorts. Further mechanistic studies, including the development of appropriate in vitro models, will be necessary to assess the biological relevance of these associations and to evaluate potential therapeutic strategies.
4. Materials and Methods
4.1. Patient Recruitment and Study Design
We retrospectively enrolled 147 patients with histologically confirmed primary ChS, who were treated at three high-volume centers in Maria Sklodowska-Curie National Research Institute of Oncology (Warsaw, Poland), IRCCS Istituto Ortopedico Rizzoli (Bologna, Italy), and Centre Léon Bérard (Lyon, France). Histological diagnosis was performed by expert sarcoma pathologists. Patients included in the study were diagnosed between 2010 and 2022 and were radically treated with surgical resection. The patients were qualified based on the presence of complete clinical data with at least one year of follow-up and the presence of good-quality resection material. The exclusion criteria were previous neoadjuvant chemotherapy or radiotherapy, subtotal resection, or a lack of a sample from the primary tumor site.
A total of 181 patients were screened, and 99 patients diagnosed with different subtypes of ChS (28 G1, 37 G2, 24 G3 ChS, and 10 DDCS), with complete immunological and molecular data included in the final multiparametric analysis (Figure S3A,B). The characteristics of 99 patients are presented in the Table S6. Samples were collected from formalin-fixed paraffin-embedded (FFPE) tissue, which were then used for targeted next-generation sequencing (NGS) of 409 genes, immunohistochemistry (IHC) of 20 markers (from central and peripheral tumor region) for both the immune and tumor cells, and MSI analyses.
4.2. Clinical Data Evaluation
We analyzed gender, tumor size, age, pathological fracture, tumor site, surgical margin, and histological subtype using univariate and multivariate Cox regression to evaluate their impact on patient survival (OS, DFS). Kaplan–Meier curves were generated, and statistical differences between groups were assessed with the log-rank test. OS was defined from diagnosis to death or last follow-up; DFS spanned from radical resection to recurrence, metastasis, death, or follow-up.
4.3. Tissue Microarrays Preparation and Immunohistochemistry
The tissues were fixed in buffered 10% formalin (fixation time was no longer than 48 h). The tumor content in the tissue samples was at least 80%, as assessed by a pathologist. The material did not contain bone marrow components. Our selection criteria ensured minimal interference from non-tumor cells. The material was selected as much as possible without treatment with a decalcifying agent. TMAs were constructed from FFPE tissue blocks, including two representative 2.0 mm cores from the central and peripheral regions of the tumor. In each TMA block, the liver, tonsil, kidney, and testis were used as control tissues. In this way, 8 TMAs were prepared for further IHC staining.
IHC staining was performed on four-μm-thick tissue sections using an automated stainers Autostainer Link 48 automated device (Agilent Technologies, Inc., Santa Clara, CA, USA) or Ventana Benchmark Ultra (Ventana Medical System Inc., Oro Valley, AZ, USA). We selected 20 markers for IHC evaluation, including leukocytes (CD45), T cells (CD3, CD4, and CD8), Tregs (Foxp3), B cells (CD20), M1-like TAMs (CD68 clone [PG-M1]), M2-like TAMs (CD163 and CD68 clone [KP1]), monocytes (CD14), APCs (CD80 and HLA-DR), iDCs (CD1a), DCs (CD141 and LAMP3), and ICPs (PD-1, TIM-3, LAG-3, Gal-9, and PD-L1). Details and dilutions for each antibody used are presented in Table S1. The finished slides were scanned, and the image analysis was performed using QuPath software version 0.4.3 [65] and manually verified. PD-L1 expression was evaluated according to the literature knowledge as the percentage of positive cells on a scale: 0, no expression: <1% of positive cells; 1, low expression: 1–30% of positive cells; and 2, high expression: ≥30% of positive cells) [66]. For other markers, the number of positive cells per area (mm^2^) was assessed [67,68]. The presence of TLS was evaluated based on the positive expression of CD3 (T cells), CD20 (B-cells), and LAMP3 (DCs) [69] markers and confirmed by the presence of the organized aggregates of immune cells in H&E staining.
4.4. Determination of Immunophenotypes (IMPs)
Hierarchical clustering based on Euclidean distance and Ward’s D2 method was used to determine IMPs. The optimal number of clusters (three) was determined using between 30 indexes as implemented in NbClust R package [70]. To assess the internal validity and stability of the IMPs, bootstrap resampling of the immunohistochemical dataset (n = 99) was performed. In each of 1000 bootstrap iterations, cases were sampled with replacement. Cluster assignments from each bootstrap iteration were compared with the original clustering solution using the adjusted Rand index (ARI) (Table S7, Figure S4).
The contribution of individual immune markers across individual IMPs was assessed using principal components analysis (PCA).
4.5. DNA Isolation
DNA was extracted from FFPE tissue (10 µm thick tissue slides) using Biosystems™ MagMAX™ FFPE DNA/RNA Ultra kit (Thermo Fisher Scientific Inc., Waltham, MA, USA), following the manufacturer’s protocol (with the overnight incubation variant at 57 °C). Samples were stored at −20 °C. DNA concentrations were measured fluorescently with the Qubit dsDNA HS Assay Kit (Thermo Fisher Scientific Inc.) using a Qubit 2.0 fluorometer (Thermo Fisher Scientific Inc.) and following the manufacturer’s instructions. To assess the purity of the nucleic acids, we used a NanoDrop™ 2000 spectrophotometer (Thermo Fisher Scientific Inc.) and followed the manufacturer’s recommendations.
4.6. DNA Library Preparation and Sequencing with Targeted Gene Panel
DNA libraries were prepared using the Ion AmpliSeq™ Library Kit Plus (Thermo Fisher Scientific Inc.) and the Oncomine™ Tumor Mutation Load Assay genetic panel of 409 genes and 1.65 Mb of genomic space (Thermo Fisher Scientific Inc.). To avoid deamination related to FFPE tissue processing [71], we preventively used digestion with the non-heat-stable enzyme UDG (Thermo Fisher Scientific Inc.) for all samples as the first step in library preparation, according to the manufacturer’s recommendation, and followed the instructions in the protocol in further library preparation steps. We used the Ion P1 Adapter and Ion Xpress™ Barcode Adapters 33–48 Kit (Thermo Fisher Scientific Inc.) for the ligation step. The prepared libraries were purified using magnetic beads (Agencourt AMPure XP, Beckman Coulter Inc., Brea, CA, USA) following the manufacturer’s protocol, eluted with low TE buffer (Thermo Fisher Scientific Inc.), and stored at −20 °C. The concentrations of DNA libraries were measured using Qubit 2.0 and the molarity of each library was determined with the Agilent High Sensitivity DNA Kit (Agilent Technologies, Inc.) using the Bioanalyzer 2100 (Agilent Technologies, Inc.). The final libraries were pooled (in up to four per chip) in equimolar concentrations and used for automatic template preparation on the Ion Chef™ instrument (Thermo Fisher Scientific Inc.) using the Ion PI™ Hi-Q™ Chef Kit (Thermo Fisher Scientific Inc.) and the Ion 540™ Chips (Thermo Fisher Scientific Inc.). We used the Ion Proton™ sequencer (Thermo Fisher Scientific Inc.) for sequencing, and followed the manufacturer’s instructions to perform the sequencing reaction, using dedicated reagent kits and consumables: Ion PI™ Hi-Q™ Sequencing 200 Kit, Ion PI™, Ion PI™ Sequencing Nucleotides, and Ion Proton™ Sequencing Supplies (Thermo Fisher Scientific Inc.).
4.7. Bioinformatics Analysis of Data from Sequencing
Bioinformatics analysis of the sequencing data was performed using three different approaches:
- Raw sequencing data were pre-processed on the sequencer using dedicated software—Torrent Suite^TM^ (TS) software version 5.14.0 (Thermo Fisher Scientific Inc.)—which included adapter sequences trimming, removing poor signal reads, and assigning the reads to a given sample based on the barcode. The processed reads were mapped to the reference genome hg19 (Homo sapiens) and adjusted to the specific amplicon target regions, based on the BED file provided by the manufacturer. Next, we performed coverage analysis (v5.12.0.0) and variant calling (v5.12.0.2) using plug-ins from TS and under the default low-stringency settings to call somatic variants (v5.12.0.2 (552)). The following criteria were used for qualitative evaluation: loading of the chip ≥ 80%, polyclonality ≤ 30%, uniformity ≥ 80%, at least 10 million mapped reads, and an average depth of coverage ≥ 1000. In some cases, with slightly fewer reads or coverage, reads from two independent sequencing runs for 1 sample were merged to get a higher number of mapped reads. Finally, we downloaded FASTQ, BAM, and VCF files from TS.
- Next, the FASTQ files from the TS server were mapped to the hg19 reference genome using the Burrows–Wheeler Alignment (BWA-MEM) algorithm and analyzed with the Genome Analysis Toolkit (GATK, v4.2.2.0) [72] with the Base Quality Score Recalibration step. The mutect2 tool [73] in GATK was used to identify somatic variants. Population data from the Genome Aggregation Database (gnomAD) and the Panel of Normals (PoN) from GATK were used to filter out germline variants. The VCF files were then normalized, left-aligned and filtered based on the following parameters: for single-nucleotide polymorphism (SNP) or multiple nucleotide polymorphism (MNP): read depth (DP) ≥ 15, allele frequency (AF) ≥ 0.015, tumor log-odd score (TLOD) ≥ 14; for INDELs: DP ≥ 70, AF range: 0.35–0.55 [74,75].
- Finally, we used BAM files from TS to perform variant calling and obtain VCF files using the commercial software Ion Reporter^TM^ (IR) (v5.20) with Oncomine Tumor Mutation Load—w3.4—DNA—single-sample plug-in. Samples with a deamination score < 10 were qualified for further analysis. For a deamination score in the range of 10–25 and/or TMB (calculated based on IR software v.5.20) in the range of 11–50 mut/Mb, we applied stricter conditions for filtering out variants for 6 samples by increasing the minimum AF from the default value of 0.05 to 0.1, according to the manufacturer’s recommendation [76]. For those samples, the AF value was also changed during analysis with GATK from 0.015 to 0.75 for SNP and MNP variants (to obtain the same ratio of the number of filtered variants before and after changing the AF parameter). We used “Oncomine Extended (5.14)” filtration for all samples, except the ones with a higher deamination score, for which we applied the default filtering “Oncomine Variants (5.10)”.
We then merged all three VCF files to obtain the most comprehensive identification of variants. For this purpose, we used the intersection function of bcftools [77] to merge VCF from GATK and TS, which allowed for an optimal ratio of SNP variants to INDELs, and then manually added variants from IR to the VCF file. The merged VCF files were annotated using the FUNCtional annOTATOR (Funcotator) from GATK version 4.2.2.0.
To validate the methodology and detect potential artifacts due to the lack of paired samples from the patients, a control group was established from a “healthy” population. For this purpose, nine available tissues (5 derived from FFPE tissues: skin, lymph nodes, or lungs, and 4 isolated from the blood of “healthy” individuals) were subjected to the same procedure of DNA library preparation, sequencing, and subsequent data analysis as described above. A VCF file containing a pool of variants from all “healthy” tissue samples was used to filter out the common variants from both files, which were potential germline variants, non-pathogenic variants, or artifacts. Finally, we performed post-variant filtration based on the following parameters: AF ≥ 0.05 and DP ≥ 50 [74,78,79]. Recurring putative artifact variants were additionally tested with Sanger sequencing.
Annotation of variants was also performed using the Ensembl Variant Effect Predictor (VEP) version 110.1 [80], while the pathogenicity of variants was predicted using Sorting Intolerant From Tolerant (SIFT) [81], Polymorphism Phenotyping v2 (PolyPhen-2) [82], and AlphaMissense [83] predictors. Variants identified by VEP as “low” IMPACT and “benign” according to the ClinVar database [84] were filtered out. In addition, variants were selected based on classification as “deleterious/pathogenic” by SIFT and Poly-Phen-2 or by AlphaMissense. Finally, variants that have not yet been described in the Single-Nucleotide Polymorphism Database population (dbSNP) [85] were manually reviewed for additional verification of the occurrence of potential artifacts (especially for INDELs) using Golden Helix GenomeBrowse^®^ version 3.0.0 software (reference sequence GRCH37 g1k, 1000 Genomes). Variants present in the “1000 Genomes” database [86] with AF > 0.05, with less than 5 reads in total and less than 2 reads in each strand, were excluded from the analysis [78,79].
4.8. Tumor Mutation Burden Analysis and Visualization of NGS Data
The TMB was calculated as the number of final variants (excluding CNVs) per size of the gene panel: 1.7 Mb. The Maftools R package (v2.18.0) [87] was used to visualize the data obtained from NGS. Functional analysis of deregulated genes was performed based on the data available from two different papers [26,88] using the Maftools package.
4.9. Copy Number Variants Detection
The PureCN R package version 2.0.2 [89] was used to identify copy number variants. Variant calling was performed based on BAMs obtained from GATK (v4.2.2.0) and using Mutect2 (v4.2.2.0). The previously described pool of nine “healthy” samples was used for the normalization.
4.10. Microsatellite Instability Evaluation
To assess MSI in the study population, we used the automated Idylla^TM^ MSI Test (Biocartis US, Inc., Raritan, NJ, USA), which is based on the qPCR of seven MSI gene loci, ACVR2A, BTBD7, DIDO1, MRE11, RYR3, SEC31A, and SULF2, following the manufacturer’s instructions. For this purpose, we used 1–2 FFPE tissue slides of 10 µm thickness. The results were analyzed using the Idylla^TM^ system (v26.0).
4.11. Evaluation of Immunological and Genetic Prognostic Factors and Multivariate Analysis
Univariate and multivariate analyses of the effect of genetic and immunologic factors on patients’ OS were performed using Cox regression. To select significant factors with an impact on patients’ OS we have incorporated all clinical, immunohistopathological, and molecular variables in a LASSO-penalized Cox model with 10-fold cross-validation. The optimal lambda value was selected as the one within 1 standard deviation of the minimum cross-validation error.
4.12. Statistical Analysis
The Spearman correlation was used to evaluate the relationship between variables. The Kruskal–Wallis and Fisher’s exact (with Benjamini–Hochberg correction were applicable) tests were used for comparisons between categorical variables. All data met the assumptions of the statistical tests used and were tested for normality. Statistical significance was set at p < 0.05 or FDR < 0.05. The analyses were performed using R language (v4.3.1) [90].
4.13. Limitations of the Study
Although the retrospective design and inclusion of surgically treated patients may limit generalizability, this approach reflects current standard-of-care and represents the most feasible methodology for studying rare malignancies such as ChS. The used tissue microarray (TMA) approach, while standardized, provides limited sampling that may not capture complete intratumoral heterogeneity and may provide bias in immunophenotyping, whereas the single staining IHC did not allow colocalization of immune cell markers. Therefore, in the future, it would be valuable to perform an analysis using multiplex techniques. The absence of matched normal controls prevents definitive somatic variant confirmation. In addition, due to the FFPE origin of the tissue, in a few samples we noticed an increased deamination score, which could influence the TMB value and variant calling.
The reference list from the paper itself. Each links out to its DOI / PubMed record.
- 1Rutkowski P. Świtaj T. Koseła-Paterczyk H. Kotrych D. GoryńT. Mazurkiewicz T. Fijuth J. Grzesiakowska U. Borkowska A. Spałek M. Postępowanie diagnostyczno-terapeutyczne u chorych na mięsaki kości—Zalecenia ekspertów Onkol. Prakt. Klin.-Eduk.20239181200
- 2Bovée J.V.M.G. Bloem J.L. Flanagan A.M. Nielsen G.P. Yoshida A. WHO Classification of Tumours: Soft Tissue and Bone Tumour 5th ed.WHO Geneva, Switzerland 2020978-92-832-4502-5
- 3Giuffrida A.Y. Burgueno J.E. Koniaris L.G. Gutierrez J.C. Duncan R. Scully S.P. Chondrosarcoma in the United States (1973 to 2003): An Analysis of 2890 Cases from the SEER Database J. Bone Jt. Surg.-Am. Vol.2009911063107210.2106/JBJS.H.0041619411454 · doi ↗ · pubmed ↗
- 4Kim M.-J. Cho K.-J. Ayala A.G. Ro J.Y. Chondrosarcoma: With updates on molecular genetics Sarcoma 2011201140543710.1155/2011/40543721403832 PMC 3042668 · doi ↗ · pubmed ↗
- 5Strauss S.J. Frezza A.M. Abecassis N. Bajpai J. Bauer S. Biagini R. Bielack S. Blay J.Y. Bolle S. Bonvalot S. Bone sarcomas: ESMO–EURACAN–GENTURIS–ERN Paed Can Clinical Practice Guideline for diagnosis, treatment and follow-up Ann. Oncol.2021321520153610.1016/j.annonc.2021.08.199534500044 · doi ↗ · pubmed ↗
- 6Zając A.E. KopećS. Szostakowski B. Spałek M.J. Fiedorowicz M. Bylina E. Filipowicz P. Szumera-Ciećkiewicz A. Tysarowski A. Czarnecka A.M. Chondrosarcoma-from Molecular Pathology to Novel Therapies Cancers 202113239010.3390/cancers 1310239034069269 PMC 8155983 · doi ↗ · pubmed ↗
- 7Italiano A. Mir O. Cioffi A. Palmerini E. Piperno-Neumann S. Perrin C. Chaigneau L. Penel N. Duffaud F. Kurtz J.E. Advanced chondrosarcomas: Role of chemotherapy and survival Ann. Oncol.2013242916292210.1093/annonc/mdt 37424099780 PMC 3811906 · doi ↗ · pubmed ↗
- 8Sina Coşkun H. Erdoğan F. Büyükceranİ. Dabak N. Evaluation of prognostic factors affecting sua multicentre, two-cohort, single-arm, open-label, phase 2rvival in chondrosarcoma treatment and comparison with literature Jt. Dis. Relat. Surg.20223344044810.52312/jdrs.2022.52635852206 PMC 9361089 · doi ↗ · pubmed ↗