Genome-Wide Identification and Analysis of the MADS-Box Gene Family in Tectona grandis (Teak), a Member of the Lamiaceae Family
Tareq Alhindi, Khaldoun J. Al-Hadid, Ayed M. Al-Abdallat

TL;DR
This study identifies and analyzes 87 MADS-box genes in teak, revealing their roles in development and evolution.
Contribution
The first genome-wide analysis of MADS-box genes in Tectona grandis, revealing unique structural and functional characteristics.
Findings
87 MADS-box genes were identified in T. grandis, distributed across 18 pseudo-chromosomes.
Type II MADS-box genes showed greater motif diversity and potential for broader functions.
MIKC-type genes were particularly active during flower development in teak.
Abstract
Background: In plants, members of the MADS-box gene family encode transcription factors that regulate a wide range of developmental processes, including cell differentiation, organ identity, floral induction, and responses to environmental stimuli. Moreover, MADS-box genes play central roles in the well-known ABCDE model of floral development. Teak (Tectona grandis), a woody species belonging to the Lamiaceae family, is recognized for its medicinal and agricultural significance. The recent availability of a chromosome-level genome assembly for T. grandis has enabled the genome-wide identification of 87 MADS-box genes, which are distributed across 18 pseudo-chromosomes. Methods: The amino acid sequences of these genes were compared with orthologous proteins from Arabidopsis thaliana, Sesamum indicum, and Amborella trichopoda to infer the phylogenetic relationships. The structures of key…
Genes, proteins, chemicals, diseases, species, mutations and cell lines named across the full text — each resolved to its canonical identifier and authoritative record.
Click any figure to enlarge with its caption.
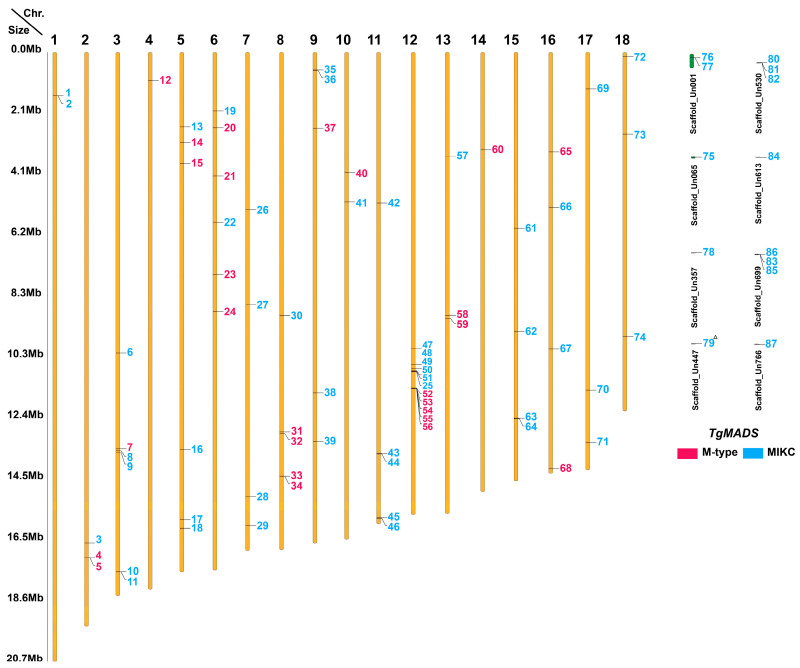 Figure 1
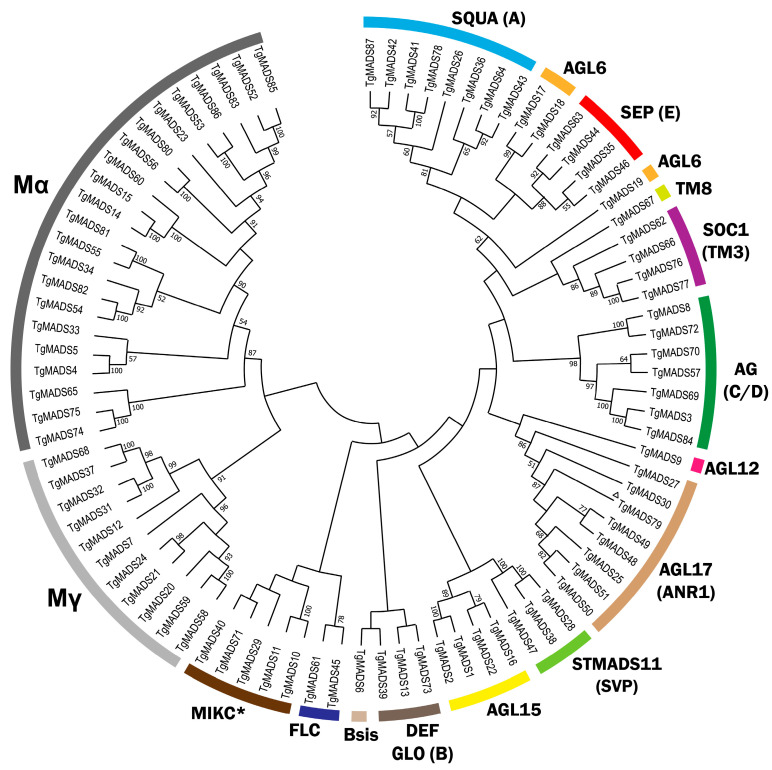 Figure 2
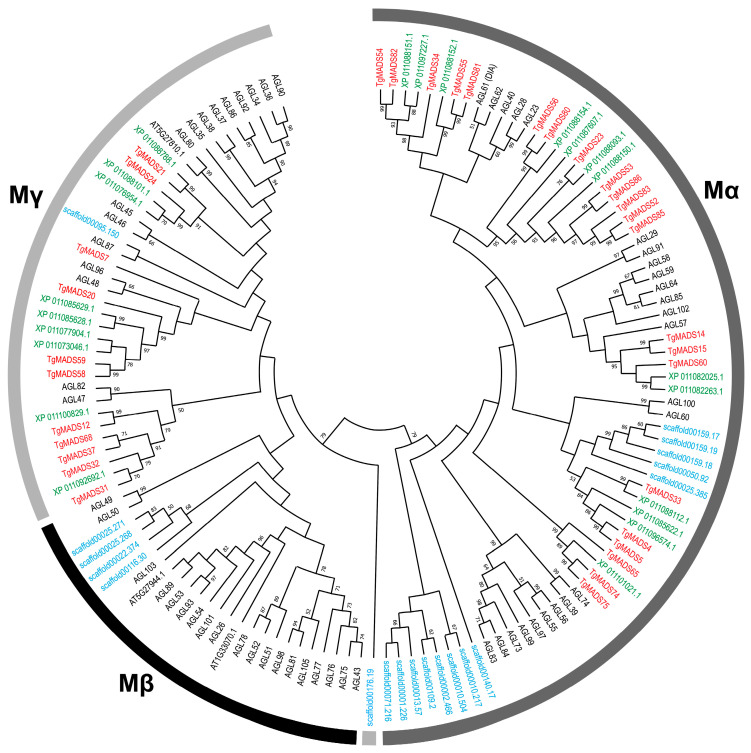 Figure 3
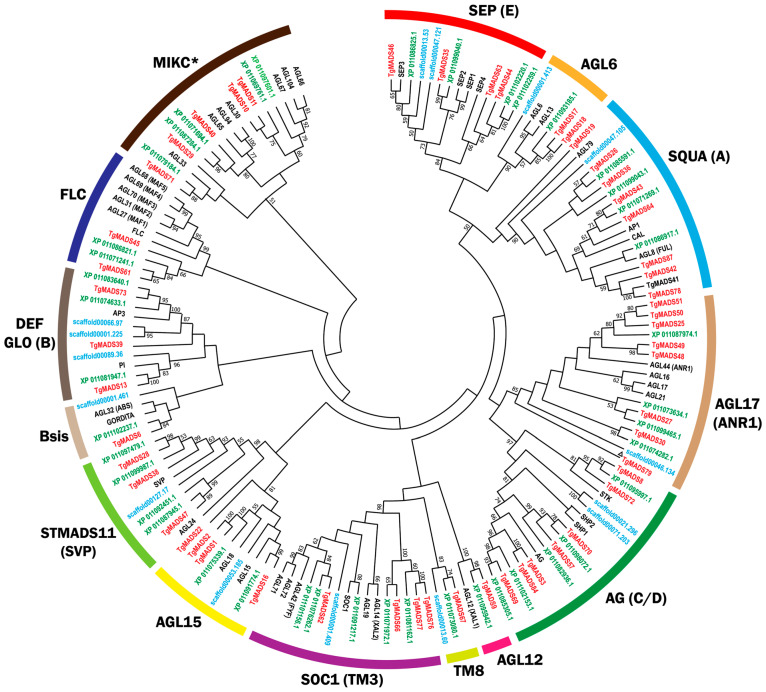 Figure 4
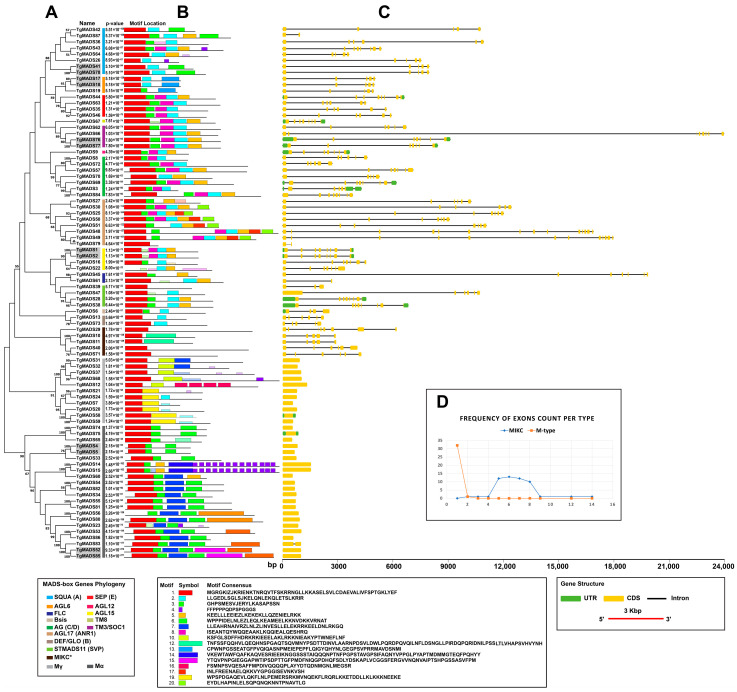 Figure 5
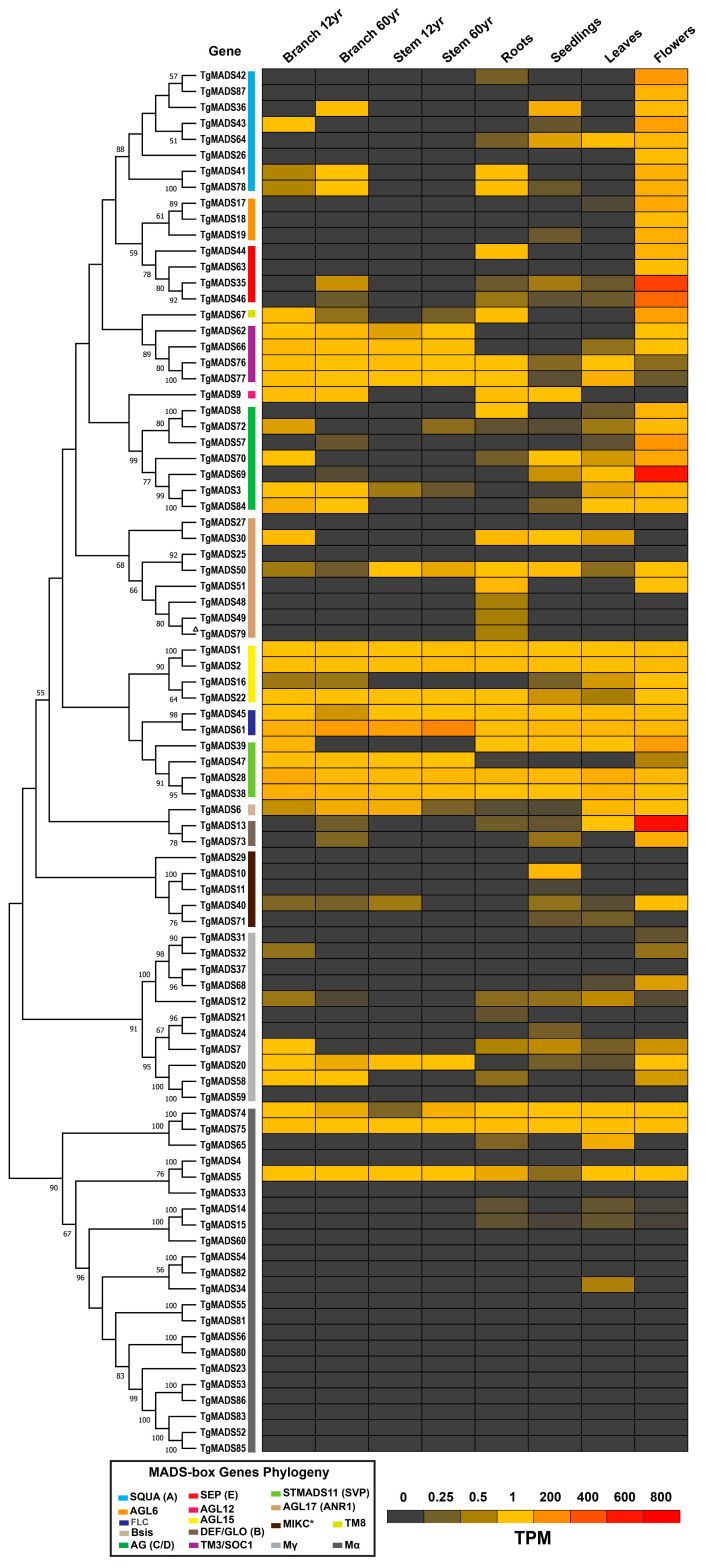 Figure 6
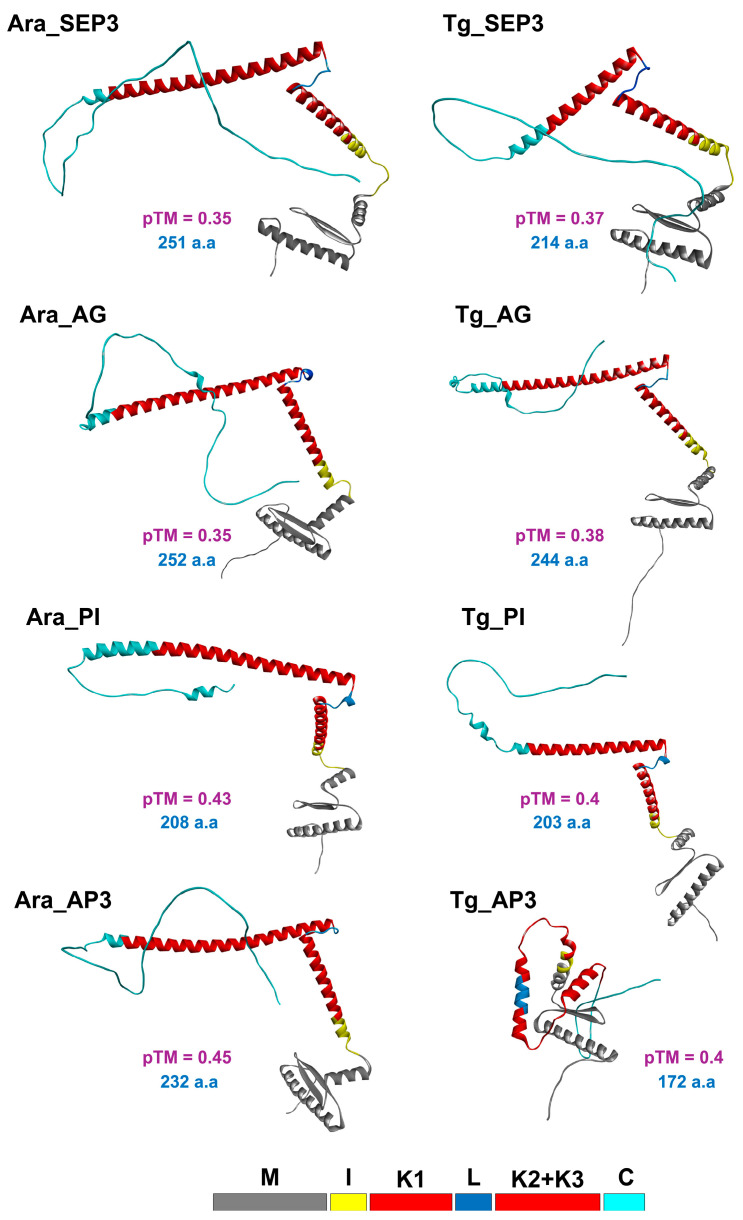 Figure 7
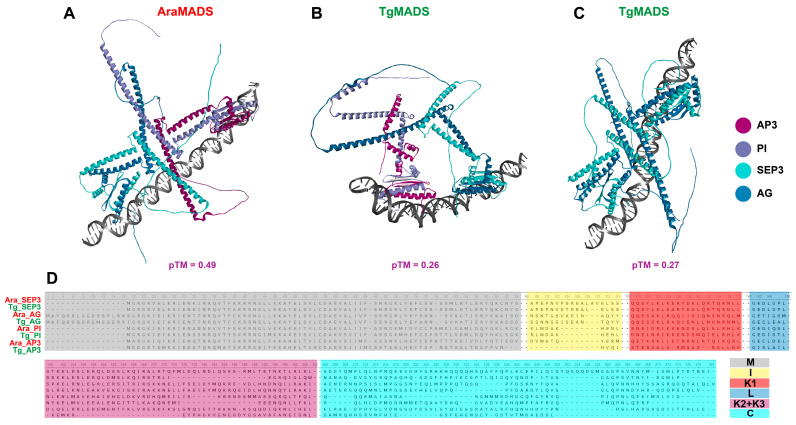 Figure 8
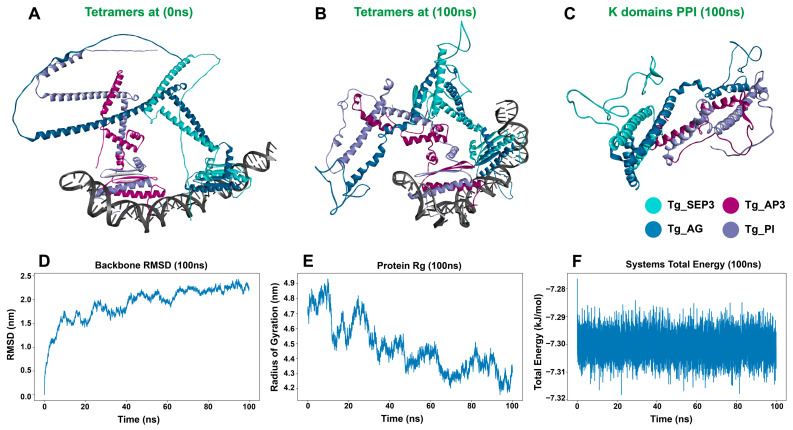 Figure 9
- —Deanship of Scientific Research—The University of Jordan
Peer Reviews
No public reviews on file for this paper yet. If you reviewed it on a platform where reviews are public (OpenReview, ICLR, NeurIPS, ICML), you can paste yours below so the community can read it here.
Videos
No videos yet. Explain this paper in a talk, walkthrough, or lecture? Add one.
Taxonomy
TopicsPlant Molecular Biology Research · Chromosomal and Genetic Variations · Plant Gene Expression Analysis
1. Introduction
The mint family (Lamiaceae) contains numerous aromatic species, such as lavender, basil, rosemary, sage, and mint. Members of this family are typically characterized by having opposite leaves, bilaterally symmetric flowers, and square stems. Plants of this family are widely valued for their culinary, medicinal, and ornamental uses due to their essential oils and fragrant properties [1,2]. T. grandis (teak) belongs to this family, is native to a few countries in South and Southeast Asia, and is a prominent timber species that can reach a height of 25–30 m [3]. Teak is highly valued for its exceptional durability, dimensional stability, and resistance to decay [4].
Phytochemical studies have shown that teak tissues contain various phytochemicals, including naphthoquinones, anthraquinones, and isoprenoid quinones [5], which contribute to its medicinal properties, and are associated with anti-inflammatory, antioxidant, wound-healing, and antimicrobial activities [6,7]. Moreover, it has analgesic and hypoglycemic effects [5,8]. Teak extracts have traditionally been used to treat various ailments, including bronchitis, dysentery, and diabetes [9]. Recent studies have explored its potential in modern medicine, including its antidiuretic and hair growth-promoting activities [8,9]. Teak presents a promising source for developing new therapeutic agents. Therefore, various genetic improvement programs have been implemented to enhance both the productivity and quality of teak [10].
Genome-wide analyses of teak have revealed significant insights into its genetic structure and wood formation processes. A high-quality chromosomal-scale genome assembly has been developed, comprising 18 pseudo-chromosomes and 31,168 genes encoding 46,826 gene models [11,12]. The genome contains numerous simple sequence repeats (SSRs), which have an important role in genetic conservation and breeding programs [13]. In addition, 130 NAC transcription factors have been identified and analyzed for their potential role in wood formation and secondary cell wall synthesis [14]. These genomic resources are expected to enable the discovery of novel genes associated with desirable traits and to support sustainable teak production and conservation efforts. Genetic studies of teak have revealed moderate genetic diversity within populations and significant differentiation among populations [15,16]. High-throughput genotyping and microsatellite markers have been used to assess its genetic structure and diversity [17,18]. Furthermore, genome analyses have also uncovered the genes associated with natural products biosynthesis (e.g., terpene synthases [12]) and drought-stress responses [19], as well as correlations between photosynthetic traits and growth performance [20]. These genetic studies have important applications in teak improvement, including the selection of superior clones for plantation forestry and the development of conservation strategies [16,21].
MADS-box transcription factors constitute a conserved gene family that are widely distributed among eukaryotes lineages, including plants and animals [22]. They encode transcription factors crucial for developmental transitions and floral organogenesis and flowering behavior [22,23,24]. Phylogenetic analyses, gene structure investigations, and expression profiling have revealed the diverse functions of MADS-box genes across different species. Each MADS-box protein contains a highly conserved 56-amino-acid DNA-binding domain that mediates dimerization and binding to target promoters [22]. In plants, these genes are organized into distinct functional groups, such as AGAMOUS and APETALA, which diversified rapidly before the emergence of angiosperms [24]. Expression analyses have revealed tissue-specific patterns and involvement in multiple developmental processes and stress responses, making them potential targets for improving plant characteristics [25,26,27]. Comparative genomics has shown that MADS-box gene numbers vary widely across species, from 24 in eucalyptus [25] to 300 in bread wheat [28,29], with 211 in maize [27], 144 in radish [23], 62 in melon [30], 102 in coffee [31], 153 in potato [32], 90 in grapevine [33], and 114 in flax [34]. These studies have highlighted both conserved subfamilies and species-specific expansions to better understand their evolution and role in plant growth and development. Some subfamilies remain conserved across multiple species, while others have expanded uniquely in certain lineages [23,26,27,30].
MADS-box genes are typically divided into two major groups, Type I and Type II, that can be further divided into subgroups [23,27]. The type I MADS-box genes have been characterized in various plant species, including barley and Brassica oleracea [35,36]. The members of this group have been further categorized into three subgroups: Mα, Mβ, and Mγ [37]. Members of the Type I group usually play essential roles in female gametophyte development, as well as in embryo and seed formation [38,39]. In barley, the Type I MADS-box genes are predominantly expressed in the antipodal cells, the central cells, and chalazal endosperm [35]. Moreover, Type I MADS-box genes are subject to epigenetic regulation, including DNA methylation and histone modification [35]. The Type I genes are numerous in angiosperms but are less common in gymnosperms, suggesting an expansion of this gene family during angiosperm evolution [40].
In contrast, Type II MADS-box members (synonymous with the MIKC type) are considered the key regulatory genes of growth and development in plants [41]. In addition to the MADS domain, their amino acid sequence contains the I region, L (loop), K domain, and C-terminal domain [42]. Type II MADS-box genes underwent a slower birth-and-death evolution in angiosperms, resulting in higher rates of duplication and pseudogenization when compared to Type I genes [43]. Type II MADS-box genes have roles in the ABCDE flowering model [44,45]; these proteins usually function through tetramer formation (floral quartet model) that cause the promoter region containing CArG-box sites to loop, thus activating the transcription process [46].They also have roles in both gametophytic and sporophytic formation in non-seed plants, contributing to vegetative and reproductive structure development [42]. In seed plants, they are crucial for various aspects of sporophyte development, including floral organ specification [37]. The Type II genes are further subdivided into MIKC^C^ and MIKC* subgroups [37]. They are found in streptophytes with a K domain, but are absent in rhodophytes, glaucophytes, prasinodermophytes, and chlorophytes [47].
In this study, a comprehensive analysis of the MADS-box gene family in teak was performed. Utilizing the new chromosome-scale genome assembly of teak plant, 87 MADS-box genes were identified and classified into subfamilies. The amino acid sequences were analyzed for their conserved motifs and phylogenetic relationships with orthologous genes from other plant species. The chromosomal distribution of the identified MADS-box genes and gene structure of teak MADS-box genes were analyzed. In addition, expression profiles across different tissues were performed using publicly available transcriptomic data. Structures of key T. grandis MADS-box genes involved in the ABCDE flowering model were predicted, and the molecular dynamics and the stability of the protein–protein interaction (PPI) were analyzed. Finally, the putative functional roles of key MADS-box genes in developmental processes were discussed and suitable candidates for future functional studies were highlighted.
2. Materials and Methods
2.1. Identification of TgMADS Genes
The teak genome assembly and protein annotation (BioProject: PRJNA493753) were downloaded from publicly available GIGA databases [48]. Thereafter, hidden Markov model (HMM) profiles for the SRF-type MADS domain (PF00319) and MEF2 domain (PF09047) were obtained from the Pfam database, as described previously [49]. The retrieved HMM profiles were used as queries in HMMER searches (HMMER v3.0) against the T. grandis proteome dataset using the default parameters (Hits with e-values < 10^−3^ were considered significant hits (Supplementary Table S1). Full consensus sequences comprised HMMR3 score). The candidate TgMADS proteins were further analyzed using the Conserved Domain Database (CDD) and ScanProsite and SMART tools to confirm the presence of the MADS domain [50,51]. Redundant sequences were then removed, and the remaining genes were considered as putative teak MADS-box genes. Each Type II (MIKC) candidate gene missing the K domain was reannotated using the FGENESH suite [52,53], with the TgMADS genomic DNA sequences referenced against S. indicum genes. The TgMADS amino acid sequences were analyzed for their theoretical molecular weights and isoelectric points (pI) using the ProtParam tool [54].
2.2. TgMADS Genes Chromosomal Mapping and Gene Structure Analysis
The chromosomal positions of the TgMADS genes were obtained from genome annotation data and mapped onto the 18 pseudo-chromosomes of T. grandis using the TBtools software suite v2.323 [55]. Gene duplication events (tandem and segmental duplication) were inferred using the genomic position, gene order, and synteny-based evidence [56]. Tandem duplication events were identified based on strict physical adjacency (no intervening annotated genes were present between them). For segmental duplication, genome-wide protein similarity searches were performed using BLASTP, and reciprocal best-hit relationships (RHBs) were used to identify homologous gene anchors, and each TgMADS paralog supported by two or more conserved RBH flanking gene anchors (threshold set to >5) were classified as segmental duplicates. To examine the gene structure, exon–intron organization was visualized with the Gene Structure Display Server (GSDS 2.0) [57] by aligning the coding sequences of TgMADS genes with their corresponding genomic regions, based on the T. grandis GFF3 annotation file retrieved from the GIGA database [48].
Conserved motifs within TgMADS proteins were predicted using MEME (Multiple Expectation Maximization for Motif Elicitation [58]), with the motif widths ranging from 6 to 200 amino acids and the maximum number of motifs set to 20. The motifs were annotated by comparison against the Pfam and SMART databases.
2.3. TgMADS Proteins Phylogenetic Analysis
To assess the evolutionary relationships, the TgMADS Type I and Type II MADS-box proteins were aligned with the MADS-box proteins from S. indicum, A. thaliana, and A. trichopoda [59] using UGENE MUSCLE [60] and MEGA 12 software [61] with the following parameters: Gap Open: −2.9; Gap Extension: 0.0; Hydrophobicity Multiplier: 1.2; Cluster Method: UPGMA (for computationally less intensive establishment of initial branching order). Thereafter, the alignment was used to construct the maximum likelihood (ML) phylogenetic trees in MEGA X (1000 bootstraps; model: Jones–Taylor–Thornton (a gold-standard suitable for nuclear proteins); rates: uniform; gaps: use all sites replicates) that included T. grandis, A. thaliana, S. indicum, and A. trichopoda Type I and Type II MADS-box proteins. Using the same approach, circular and linear phylogenetic trees were constructed for all members of TgMADS protein family.
2.4. Expression Profiling of TgMADS Genes
Publicly available RNA-Seq datasets containing T. grandis RNA-Seq data from teak tissues (including the roots, seedlings, leaves, flowers, branches, and stems of 12- and 60-year-old specimens) were downloaded from the GIGA database (BioProject: PRJNA493753). Transcript abundances (TPM) were estimated by converting the Fragments Per Kilobase of transcript per million (FPKM) data to transcripts per million (TPM) using the formula: TPM = FPKM/[sum of all FPKM of a sample] × 10^6^. The differential expression patterns were visualized with heatmaps generated in Microsoft® Excel® for Microsoft 365 MSO (Version 2512 Build 16.0.19530.20184) 64-bit..
2.5. Protein Structure Predictions and Molecular Dynamics Simulations
The protein monomers’ and tetramers’ 3D structures were predicted using the amino acids sequences submission to Alphafold3 (AF3) server accessed on 16th January 2026 [62]. Molecular dynamics simulations (MDS) assays were performed using GROMACS 2026.0 [63]; the complexes were dissolved in TIP3P water dodecahedron and neutralized with 0.15 M NaCl at a constant pressure of 1 bar and temperature of 300 K. All the structures were visualized by BIOVIA Discovery Studio Visualizer v24.1.
3. Results
3.1. Identification, Genomic Distribution, and Gene Structure of TgMADS Gene Family
Eighty-seven non-redundant MADS-box genes were identified using the HMMER toolkit (HMMER) on the T. grandis proteome sequences (Table 1). These genes were designated TgMADS1 to TgMADS87 based on their chromosomal positions, and the presence of the MADS domain was confirmed using SMART [50] and PROSITE servers (accessed on 5 April 2025) [51]. Using this approach, a number of TgMADS genes (TgMADS 4, 5, 22, 25, 27, 29, 36, 39, 45, 47, 48, 49, 51, 61, 62, 66, 71, 79, 84) were identified as MADS-box genes. The other identified TgMADS genes were either lacking the K domain, contained odd domains (e.g., transmembrane domains), or the K domain was too short (e.g., only one of the three α-helices was present). This might have been due to the common limitations in the automated assembly and annotation pipelines in genomics studies. Therefore, further inspection of the genomic data was carried out to identify functional sites, followed by a genome annotation analysis using the FGENESH suite [52]. For this purpose, the TgMADS genomic DNA sequences were used in reference to the S. indicum genes to predict the correct gene structure, and the corrected TgMADS protein annotations contained both the M and K domains, while the odd domain exons were removed.
Seventy-four TgMADS genes were physically mapped across the 18 pseudo-chromosomes of the T. grandis draft genome, with 13 TgMADS genes located on unanchored scaffolds (Figure 1). The chromosomal distribution of TgMADS genes was uneven, with chromosome 12 harboring the highest number of genes (11; 12.6%), whereas chromosomes 4 and 14 each contained only a single gene. Several TgMADS members were organized into localized clusters containing 2–5 consecutive genes, suggesting potential tandem and segmental duplication events. For the tandem duplications, 10 events were identified across the T. grandis genome that were distributed among five pseudo-chromosomes, with one pair on pseudo-chromosome 8, one pair on pseudo-chromosome 9, two pairs on pseudo-chromosome 11, five pairs on pseudo-chromosome 12, and one pair on pseudo-chromosome 15, and two events in two unanchored scaffolds (Un530 and Un699) (Supplementary Table S2: Tandemly repeated genes). Interestingly, pseudo-chromosome 12 harbored the highest number of tandemly duplicated TgMADS genes (five pairs), with four consecutive tandem pairs forming a localized gene cluster (TgMADS 50–56), suggesting a tandem duplication hotspot of TgMADS genes on this pseudo-chromosome. For the segmental duplication events, a total of 10 TgMADS gene pairs were identified using a MicroSynteny analysis with anchor support values ranging from 6 to 17, indicating a conservation between the duplicated loci (Supplementary Table S3: Segmental MicroSynteny analysis results). The segmental duplication events were also detected within the same chromosomes (intra) and between different chromosomes (inter). The intra-chromosomal segmental duplications (three events) were observed on chromosomes 3, 5, and 13, where the duplicated TgMADS gene pairs were separated by large genomic distances within the same chromosome. In contrast, the inter-chromosomal segmental duplications (seven events) were distributed across different chromosomes, including duplications between chromosomes 3 and 18, 7 and 9, and 11 and 15, and between anchored chromosomes and unplaced scaffolds. On the other hand, four TgMADS genes found in tandem duplication events (two events) were also identified as segmental duplicates (one event), with the paralogs located on distant chromosomal regions. In addition to the chromosome-based genes, those located on unanchored scaffolds were also examined, revealing a total of 10 putative paralogous gene pairs, 6 of the MIKC type (TgMADS {1, 2}, {17, 18}, {76, 77}) and four of the M type (TgMADS {4, 5}, {52, 85}). These duplication patterns likely contributed to the evolutionary expansion and functional diversification of the MADS-box gene family in T. grandis.
3.2. Phylogenetic Analysis of TgMADS Gene Family
To classify the TgMADS proteins accurately, three maximum likelihood phylogenetic trees were constructed. The first phylogenetic tree included all the identified TgMADS proteins (Figure 2), whereas the other two illustrated the evolutionary relationships within the Type I (Figure 3) and Type II (Figure 4) subfamilies. Each tree was generated using full-length MADS-box amino acid sequences from T. grandis in combination with representative MADS-box proteins from A. thaliana, S. indicum, and A. trichopoda. In addition, the TgMADS proteins were assigned to functional groups following the classifications previously described for A. thaliana and S. indicum [32,33]. This phylogenetic analysis identified 54 Type II and 33 Type I genes, which were further subdivided into four well-defined clades: MIKC^C^ and MIKC* (Type II) and Mα type and Mγ type (Type I). Interestingly, the Mβ-type subgroup of Type I MADS-box genes was absent from the T. grandis genome (Figure 3), which is in agreement with previous analysis of S. indicum [64] and Callicarpa americana [65]. The phylogenetic analysis with Arabidopsis, Sesame, and Amborella genes showed that the T. grandis MIKC^C^ genes were grouped into well-defined subfamilies, such as AGAMOUS, APETALA1, SEPALLATA, and PISTILLATA, indicating conservation of floral identity gene lineages among the studied species.
3.3. Conserved Motif Distribution and Gene Structure Analysis of TgMADS Genes
For the gene structure analysis, exon numbers of TgMADS genes varied from 1 to 14 exons, with the Type II MADS-box genes (2–14) showing noticeably higher exon numbers than the Type I genes (1–2). TgMADS79 was excluded from the above calculations as the gene was not complete due to short contig assembly. The exon numbers were generally conserved within each subgroup, except for a few minor exceptions. The exon–intron organization of the coding sequences of each TgMADS gene are shown in Figure 5—right. The exon distribution exhibited a distinct bimodal trend, where all the Type II (MIKC) TgMADS genes consistently contained an average of six exons. The lowest exon number was 2 exons (TgMADS11 in the SQUA subgroup), and the highest numbers were 12 and 14 exons (TgMADS49 and TgMADS48, respectively, in the AGL17 subgroup). In contrast, the Type I (M type) TgMADS genes typically contained a single exon and lacked introns, except for the Mα subgroup, where TgMADS83 contained two exons. Additionally, a few members of the MIKC group exhibited notably long introns—exceeding 10 kb—compared with the rest of the TgMADS genes.
Most of TgMADS proteins showed alkaline isoelectric points, with 59 proteins exhibiting pI values above 7.5, whereas only 6 fell in the neutral range (6.5–7.5), and 27 were considered acidic with pI values below 6.5. Interestingly, all members of the MIKC* subgroup were acidic, averaging a pI of 6.29, while the M-type proteins averaged 7.43 and the MIKC^C^ group averaged 8.21, reflecting a basic character. The predicted molecular masses also varied among the classes: the MIKC^C^ proteins had a mean mass of approximately 25.7 kDa, the MIKC* proteins about 29.7 kDa, and the M-type proteins around 30.2 kDa. Such variation in the pI and molecular weight among TgMADS proteins has also been observed in other species, where subsets of the family separate into acidic, neutral, and basic.
The sequence features and motif architecture of all the TgMADS proteins were analyzed using the MEME suite, which identified and visualized the conserved motif patterns and their structural variations across the different TgMADS groups (Figure 5, left panel). As expected, Motif 1 corresponds to the canonical MADS domain, comprising 57 amino acids, which is responsible for DNA binding. Motif 3 represents the I domain, while motifs 8, 2, and 5 collectively define the highly conserved K domain, subdivided into K1, K2, and K3 segments with a total length of 87 amino acids (29 + 29 + 29). These motifs, identified through the MEME analysis, were found either fully or partially across all the MIKC-type TgMADS proteins. In several TgMADS proteins, however, certain M and K domains were not detected by the MEME analysis and, therefore, a secondary validation was performed using the SMART, PROSITE, and MotifFinder tools, which confirmed their presence. In general, the same subgroups of TgMADS proteins had similar motif structures, indicating they might have conserved and similar functions. Conversely, the observed variation in the motif structure and distribution among the TgMADS members implies divergent functional specialization across different organs of T. grandis.
3.4. Expression Profile of TgMADS Genes
The expression patterns of the 87 TgMADS genes were used to construct a heat map after converting the Fragments Per Kilobase of transcript per million mapped reads (FPKM) values into transcripts per million (TPM) values [12]. The gene expression patterns were analyzed across multiple tissues, including the roots, seedlings, leaves, flowers, stems, and branches of 12- and 16-year-old trees (Figure 6). Overall, the TgMADS genes were actively expressed in all the examined tissues, underscoring their essential roles in key developmental and physiological processes.
In the floral organs, the Type II (MIKC) TgMADS genes displayed the highest expression levels, with several members showing exclusive expression in floral tissues. This observation is consistent with their known function as core regulators of the florogenesis pathway. The results further support the involvement of TgMADS genes in the ABCDE model of flower development and confirm the conservation of this regulatory framework in T. grandis. Within the MIKC subgroup, members of the DEF/GLO (B) class—particularly TgMADS13—showed the highest expression in flower tissues, followed by TgMADS69 from the AG (C/D) subgroup and TgMADS35 and TgMADS46 from the SEP (E) subgroup. In contrast, most Type I TgMADS genes exhibited low or undetectable expression in the sampled tissues. Among the Type I MADS-box genes, TgMADS74, TgMADS75, and TgMADS5 (members of the Mα subgroup) were expressed across all the examined tissues, whereas TgMADS20 from the Mγ subgroup showed a similar expression pattern except in the roots. A few additional Type I genes exhibited weak expression in the floral tissues.
3.5. Structural Prediction and Protein–Protein Interaction Modeling
The structures of SEP3, AG, PI, and AP3 orthologs in the T. grandis (Tg) and A. thaliana (Ara) MADS-box genes involved in the ABCDE flowering model [44,45] were predicted via AF3 (Figure 7). All protein orthologs showed the key M, I, K1, Loop, K2, K3, and C domains in the Type II MIKC^C^ subfamily [42,66]. It is worth noting that the TgMADS proteins were shorter than the A. thaliana orthologs; mainly the I and K domains were shorter, while the M domain was conserved in length. All the predicted structures were overall similar except Tg-AP3, which had a very short overall length of 172 amino acids (a.a) compared to the 232 in Ara-AP3; this resulted in a very short I domain and K2-K3 domains.
To verify the potential of these proteins to form floral quartets, a 118 nucleotides sequence containing two CArG sites toward its ends was used to compare the tetramer formation of one of the quartets in the stamens that consisted of members of class E (SEP3), class C (AG), and class B (PI, AP3) (Figure 8).
The M domains were always able to dimerize and bind to the DNA as predicted. The A. thaliana proteins were able to form tetramers mainly through coiled-coil interactions between the K2 and K3 domains, as reported in wet lab assays [67]. The Tg-SEP3 (TgMADS46) and Tg-AG (TgMADS69) had similar interaction patterns as the Ara-SEP3 and Ara-AG proteins, but Tg-PI (TgMADS13) and Tg-AP3 (TgMADS39) had different interaction patterns compared to Ara-PI and Ara-AP3. This was mainly due to the odd shaped, shorter Tg-AP3 protein. Nonetheless, they were able to form tetramers. To investigate the ability of T. grandis proteins to form similar structured tetramers as the A. thaliana orthologs, another quartet (SEP3, AG, SEP3, and AG) found in carpels was simulated (Figure 8C). This quartet had a very similar tetramer standard formation, as seen in the A. thalian orthologs, were the K2 and K3 domains are involved in the PPI along the stretched α-helices.
To confirm the stability of the predicted T. grandis tetramers, and the possible dynamics of the odd shortened Tg_AP3 protein, an MDS was carried out for 100 ns (Figure 9).
Overall, the tetramer remained stable and bound to the promoter DNA over the 100 ns simulation time. The K2 and K3 domains remained the key domains involved in tetramerization, but the Tg-AP3 K3 domain interacted with the Tg-PI K3 domain in a perpendicular angle rather than the expected parallel geometry, and the Tg-AP3 domain seemed to play a role in the PPI with Tg-PI as well.
4. Discussion
In plants, the MADS-box gene family exhibits considerable variation in the numbers and types of its members, with the Type I (M type) genes showing particularly dynamic evolutionary patterns, with faster birth-and-death evolution compared to the Type II genes [37]. For instance, green algae (chlorophytes) typically lack or have few MIKC (Type II) MADS-box genes, suggesting major differences in MADS-box gene evolution between different plant lineages [37]. In contrast, angiosperms have experienced significant expansions of specific Type I subclades, particularly those associated with reproductive development, with angiosperm-specific Type I clades (Mγ and Mα) originating at the base of flowering plants and undergoing subsequent duplications and neofunctionalization [68]. For instance, Arabidopsis contains 64 functional Type I genes while rice has only 24 functional Type I genes, demonstrating the rapid turnover characteristic of this gene family [69]; this is reflected in the lower bootstrap values calculated in the phylogenetic tree. Type I genes often lack the conserved K domain found in Type II genes and are under weaker purifying selection. This leads to higher sequence divergence, which can cause long branch attraction and lower bootstrap support. Furthermore, Type I (M type) MADS-box genes are found in a limited number of organisms, while some lack them entirely; examples include Saccharum officinarum (sugarcane); Marchantia polymorpha; and the algal species Klebsormidium flaccidum, Dunaliella salina, and Chlorella variabilis. Among land plants, M. polymorpha contains only two Type II genes, the gymnosperm Picea abies has three, while the carrot (Daucus carota) has five. In contrast, other angiosperms exhibit a lineage-specific expansion of both groups, with Camelina sativa harboring the largest complement of Type I genes (271), whereas Glycine max (soybean) contains the highest number of Type II genes (209) [53,59]. Collectively, these evolutionary patterns highlight the variability in MADS-box gene families across the plant kingdom and reflect their central involvement in diverse developmental pathways and their rapid evolution under different selective pressures.
Within the Lamiaceae family, the number of Type I MADS-box genes in T. grandis (33) closely matches those in S. indicum (31) and C. americana (32), though it remains lower than in Ocimum tenuiflorum (42). For Type II genes, T. grandis (54) has a higher count than O. tenuiflorum (43) and C. americana (46), yet fewer than S. indicum (62). The genome size of T. grandis is 338 Mb [12], nearly identical to S. indicum (337 Mb) [64], and smaller than O. tenuiflorum at 612 Mb [70]. It is also notably smaller than the soybean genome (1115 Mb) [71], which contains 269 MADS-box genes, and is smaller than Camelina sativa at 785 Mb [72], which carries 384 MADS-box genes. The low number of MAD-box genes observed in certain Lamiaceae species may be associated with their smaller genome sizes and possible genome size reduction following duplication events. Such events are known to play a key role in the expansion and diversification of gene families in plants [64,68,73,74]. This is further supported by the presence of tandem and segmental duplicates, which indicate the contribution of large-scale duplication processes in TgMADS family expansion and evolution, and provide evidence for the non-random chromosomal distribution. It is worth mentioning that the observed enrichment of TgMADS genes on pseudo-chromosome 12 is mainly attributed to a localized tandem duplication event (four gene pairs in tandem), whereas the segmental duplication analysis indicates a broad distribution of TgMADS genes across the genome, consistent with the distinct evolutionary mechanisms underlying local gene clustering versus large-scale duplication [75]. Furthermore, MADS-Box gene clustering likely originated through duplication followed by functional divergence [74,76]; such phenomenon has also been reported in other transcription factor families, such as HOX genes [77]. The higher exon counts observed in Type II (MIKC) genes (2–14) compared with Type I genes (1–2) are consistent with previous findings for S. indicum, A. thaliana, O. sative, and G. max [64,71,73]. This pattern reflects the greater structural complexity and broader functional diversity typically associated with Type II genes relative to Type I [37,44,76,78]. Collectively, these evolutionary patterns highlight the variability in MADS-box gene families across the plant kingdom and reflect their central involvement in diverse developmental pathways and their rapid evolution under different selective pressures.
The absence of the Mβ subgroup in members of the Lamiaceae family T. grandis, S. indicum, and C. americana [65] points to a targeted contraction of this Type I MADS-box clade. Type I MADS-box genes are characterized by a rapid birth-and-death evolution; thus, the loss of Mβ likely reflects a period of intensive genome fractionation following ancestral polyploidy events in the Lamiales. Furthermore, given the specialized role of Mβ genes in endosperm development [38,73], its absence may be linked to the diverse and often specialized seed developmental strategies observed across this order. The loss of Mβ may indicate a functional shift where its ancestral role in seed nourishment was either lost or reassigned to expanded Mα and Mγ paralogs, coinciding with the evolution of cellular endosperm development and haustorial endosperm structures characteristic of this order [79,80]. This suggests that while MIKC^C^ genes remain conserved as a ‘core toolkit,’ the Type I Mβ lineage might be prone to lineage-specific extinction when its functions become redundant or the underlying developmental processes shift. Mβ-type genes have also been reported missing in rice and other monocots [73], which supports the view that this subgroup likely evolved as a lineage-specific clade.
TgMADS67, a TM8 gene ortholog, is found in S. indicum, S. lycopersicum, and Nicotiana benthamiana, yet it is absent in A. thaliana. The expression pattern across multiple tissue types, combined with the absence of a well-defined phenotype when TM8 is deleted or overexpressed, has made it challenging to determine their precise role. In N. benthamiana, TM8 represses the microRNA miR172 together with an SVP-type gene [81]. In S. lycopersicum, the overexpression or repression of TM8 changes sexual organs viability, shape, and some floral identity gene expression [82]. Additional molecular and spatiotemporal expression profile studies on the TgMADS67 ortholog in T. grandis could help clarify the biological function of this still poorly understood gene.
Overall, at least one TgMADS gene was actively expressed in every tissue examined, emphasizing the broad functional range and biological significance of MADs-box gene family in T. grandis. The expression was generally higher among the Type II TgMADS genes compared to Type I, a pattern consistent with their structural complexity and functional diversification [37,44,76,78]. In the floral tissues, TgMADS13, the ortholog of Arabidopsis PISTILLATA (PI), displayed the strongest expression, together with TgMADS35, the ortholog of SEPALLATA2 (SEP2); TgMADS46, the ortholog of SEPALLATA3 (SEP3); and TgMADS69, the ortholog of AGAMOUS (AG). This pattern reflects the pivotal regulatory functions of PI, AG, and SEP genes and their paralogs during floral organ development [83]. Two other genes, TgMADS45 and TgMADS61, corresponding to Arabidopsis MAF3 and MAF2 of the FLC subgroup, were also expressed in the flowers. However, their transcript levels do not appear to align with the repression of flowering observed in Arabidopsis [84]. Interestingly, no FLC ortholog was detected in T. grandis, which may suggest modifications in the vernalization response and a potential role of the MAF2 and MAF3 paralogs, which in A. thaliana act as repressors to prevent premature flowering during transient cold exposure [85]. Similar losses of FLC have been reported in other taxa, including orchids [86], where SVP and AGL25 orthologs likely act as floral repressors. Furthermore, TgMADS40, an ortholog of Arabidopsis AGL65, which belongs to the MIKC* subgroup, was expressed in floral tissues, implying a possible conserved role in male gametophyte development, particularly in the later stages of pollen maturation and pollen tube growth [76,87,88]. Some MIKC-type genes in T. grandis showed expression in the roots, stems, and leaves; this agrees with observations in A. thaliana, where several MADS-box genes function beyond flower development. For example, SVP and SOC1 contribute to drought tolerance, while ANR1 and AGL21 regulate lateral root formation. Consistently, the corresponding orthologs TgMADS28, TgMADS38, TgMADS49, and TgMADS79 are expressed in T. grandis roots.
In Arabidopsis, most of Type I MADS-box genes were found to be expressed at a low level, and their function is not as well understood as the Type II MADS-box genes. The expression of the following Type I genes in flower bud tissues—TgMADS5, 74 and 75 orthologs of Arabidopsis AGL62; TgMADS68, 32 orthologs of Arabidopsis AGL47; TgMADS58, ortholog of Arabidopsis AGL45; TgMADS20, ortholog of Arabidopsis AGL35; and TgMADS7, ortholog of Arabidopsis AGL80—suggests their potential involvement in floral development. These expression patterns are consistent with earlier reports showing that certain Type I MADS-box genes participate in specific reproductive and developmental processes in A. thaliana [38,73]. Interestingly, several genes showed no detectable expression in any T. grandis tissue, and such absence may indicate that some MADS-box genes might be conditionally expressed under particular environmental factors or abiotic stresses, such as temperature, salinity, drought, or mechanical injury [89,90]. Another possible explanation is that some of these genes represent pseudogenes with no active function or redundant duplicates undergoing neofunctionalization. The presence of two or more A. thaliana MADS-box orthologs in T. grandis indicate functional redundancy, or the gaining of new regulatory roles. Such genes might also display differential expression patterns in response to environmental cues, allowing fine-tuned transcriptional control within T. grandis. Genomic studies of T. grandis have identified at least one whole-genome duplication event [12], consistent with recent findings of gene duplications reported in mint plants [91]. Indeed, such events are known to play a major role in the expansion and diversification of the MADS-box gene family [68].
The ABCDE flowering model seems to be conserved in T. grandis. The floral quartets—Tg-SEP3, Tg-AG, Tg-AP3, and Tg-PI found in the stamens, and Tg-SEP3, Tg-AG, Tg-SEP3, and Tg-AG found in the carpels—were able to form tetramers and bind to the DNA promoter sequence. Interestingly, the T. grandis orthologs were overall shorter than the A. thaliana orthologs. In particular, the Tg-AP3 protein was 60 amino acids shorter than Ara-AP3, with noticeably shortened I and K domains. Nonetheless, the floral quartet formed during simulation seemed to be stable, although it had a peculiar PPI pattern, where the α-helix of the K3 domain of Tg-AP3 was bound to the α-helix of the K3 domain of Tg-PI at a perpendicular angle, rather than the expected parallel coiled-coil structure [66,67]. In addition, the C domain of Tg-AP3 seems to have a role in the PPI as well. These might be adaptations to stabilize the complex due to the shortened K domains, but future wet lab PPI assays will be essential to confirm these odd interaction patterns, and their relevance to the overall protein network dynamics. In addition, future MDS assays of the complex for longer durations with modified promoter lengths might also help shed light on this PPI stability. These observations on possible alternative modes of PPI in the floral quartets might help further our understanding of the complexity of the overall PPI dynamics, and it might shed more light on the role of the variable unstructured C domain in the PPI in this key transcription factors family.
5. Conclusions
Using the latest T. grandis genome assembly and RNA-Seq datasets, a total of 87 TgMADS genes were identified through multiple bioinformatics analyses. These genes were categorized into Type I (Mα and Mγ) and Type II (MIKC* and MIKC^C^) clades based on their phylogenetic relationships and protein structural features. Mβ-type genes were not detected, consistent with their absence in other Lamiales species. The gene structure analysis revealed that the Type II genes contain more exons than the Type I genes. The expression profiling across eight tissues suggests that functions related to abiotic stress responses and the ABCDE floral regulatory model might be at least partially conserved in T. grandis. The variation in expression among some TgMADS genes suggests possible functional diversification or redundancy. The simulation of tetramers formation in the quartet model of key T. grandis orthologs revealed a stable complex formation that can bind to the DNA promoter sequence. Tg-AP3 had a significant reduction in protein length that might have resulted in an odd PPI, but further in silico and wet lab analyses are needed to confirm these peculiar dynamics. Our findings provide a foundation for future studies, including protein–protein interaction experiments, to clarify the regulatory functions of TgMADS genes, and to confirm the predicted PPI and the protein networks dynamics.
The reference list from the paper itself. Each links out to its DOI / PubMed record.
- 1Harley R.M. Labiatae Flowering Plants·Dicotyledons: Lamiales (Except Acanthaceae Including Avicenniaceae) Kadereit J.W. Springer Science & Business Media Berlin, Heidelberg 2004 Volume 7167275
- 2Mabberley D.J. Mabberley’s Plant-Book: A Portable Dictionary of Plants, Their Classification and Uses Cambridge University Press Cambridge, UK 2017
- 3Pandey D. Brown C. Teak: A Global Overview Unasylva FAO Rome, Italy 2000313
- 4Nidavani R.B. Mahalakshmi A. Pharmacology of Tectona grandis Linn.: Short review Int. J. Pharmacogn. Phytochem. Res.201468690
- 5Vyas P. Yadav D.K. Khandelwal P. Tectona grandis (teak)—A review on its phytochemical and therapeutic potential Nat. Prod. Res.2019332338235410.1080/14786419.2018.144021729506390 · doi ↗ · pubmed ↗
- 6Asdaq S.M.B. Nayeem N. Alam M.T. Alaqel S.I. Imran M. Hassan E.-W.E. Rabbani S.I. Tectona grandis Lf: A comprehensive review on its patents, chemical constituents, and biological activities Saudi J. Biol. Sci.2022291456146410.1016/j.sjbs.2021.11.02635280534 PMC 8913375 · doi ↗ · pubmed ↗
- 7Khera N. Bhargava S. Phytochemical and pharmacological evaluation of Tectona grandis Linn Int. J. Pharm. Pharm. Sci.20135923927
- 8Kolli P.K. Obbalareddy S. Yejella R.P. Athili L.D. Ponnada S. A Review on Tectona grandis Int. J. Res. Pharm. Chem.20221235939410.33289/IJRPC.12.3.2022.12(39) · doi ↗