Quantitative Texture Analysis of Cervical Cytology Identifies Endometrial Lesions in Atypical Glandular Cells on Liquid-Based Cytology: A Pilot Study
Toshimichi Onuma, Akiko Shinagawa, Makoto Orisaka, Yoshio Yoshida

TL;DR
This study shows that analyzing cell textures in cervical samples can help identify endometrial issues, especially after menopause, using machine learning.
Contribution
The study introduces a machine learning approach to distinguish endometrial lesions in atypical glandular cells using quantitative cytology analysis.
Findings
Machine learning models achieved AUCs of 0.805 (SurePath) and 0.887 (ThinPrep) in distinguishing endometrial lesions from normal cases.
Performance improved post-menopause, with AUCs reaching up to 0.841 (SurePath) and 0.884 (ThinPrep).
Platform-specific features influenced model performance, indicating differences in data from SurePath and ThinPrep preparations.
Abstract
Background/Objectives: Within human papillomavirus (HPV)-based screening, cytology remains essential for cervical cancer detection while also potentially revealing endometrial pathology. This pilot study aimed to distinguish benign (normal) cases from atypical endometrial hyperplasia (AEH) and endometrial cancer (EC) within atypical glandular cell (AGC) cytology using quantitative analysis of liquid-based cervical cytology. Methods: SurePath and ThinPrep sets included 62 (37 normal, 25 AEH/EC) and 52 (24 normal, 28 AEH/EC) AGC cases, respectively. Semi-automatic QuPath analysis workflow detected cellular clusters; extracted texture, intensity, and geometric features; and produced case-level summaries. A random forest (RF) classifier was used to discriminate AEH/EC from normal cases. Feature subset selection was performed using a beam-search wrapper and joint hyperparameter tuning.…
Genes, proteins, chemicals, diseases, species, mutations and cell lines named across the full text — each resolved to its canonical identifier and authoritative record.
Click any figure to enlarge with its caption.
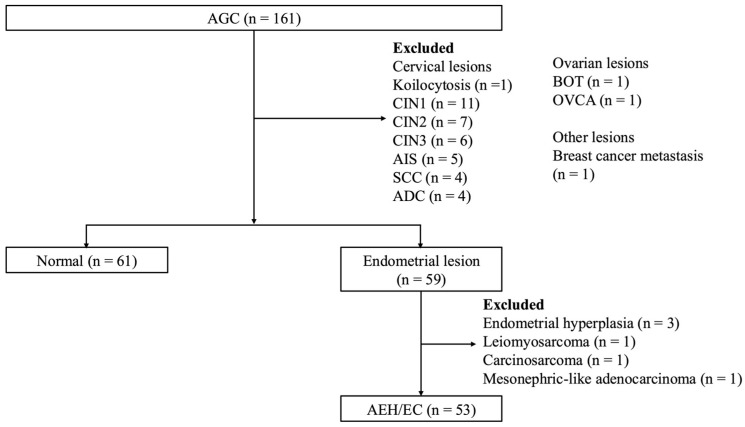 Figure 1
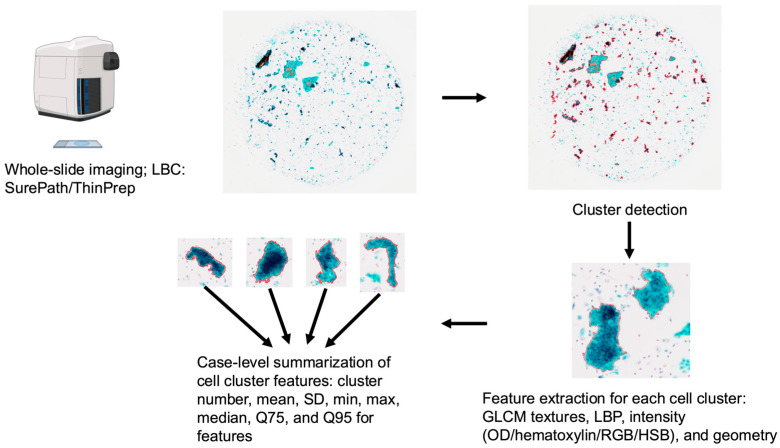 Figure 2
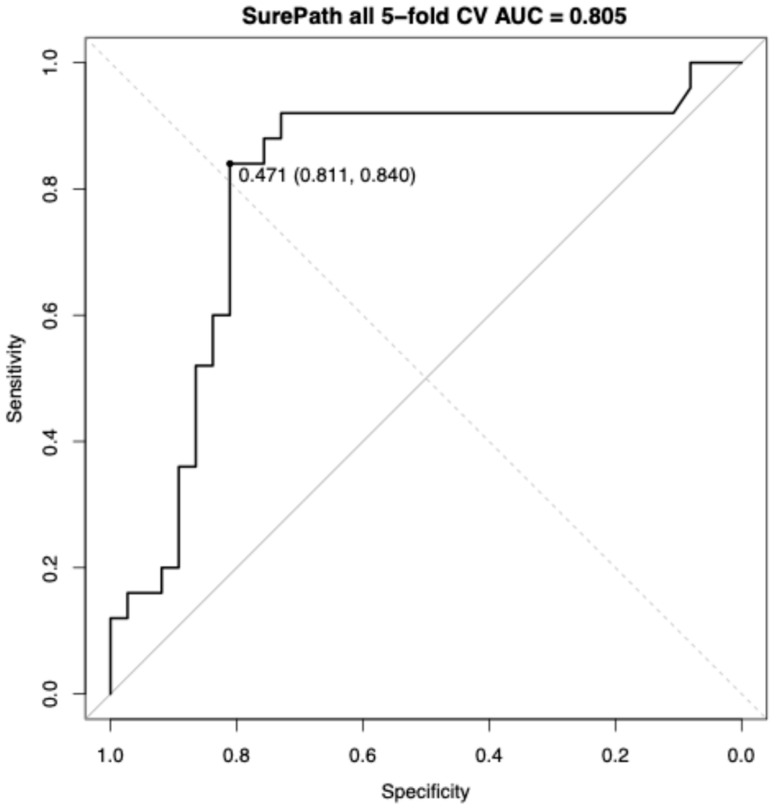 Figure 3
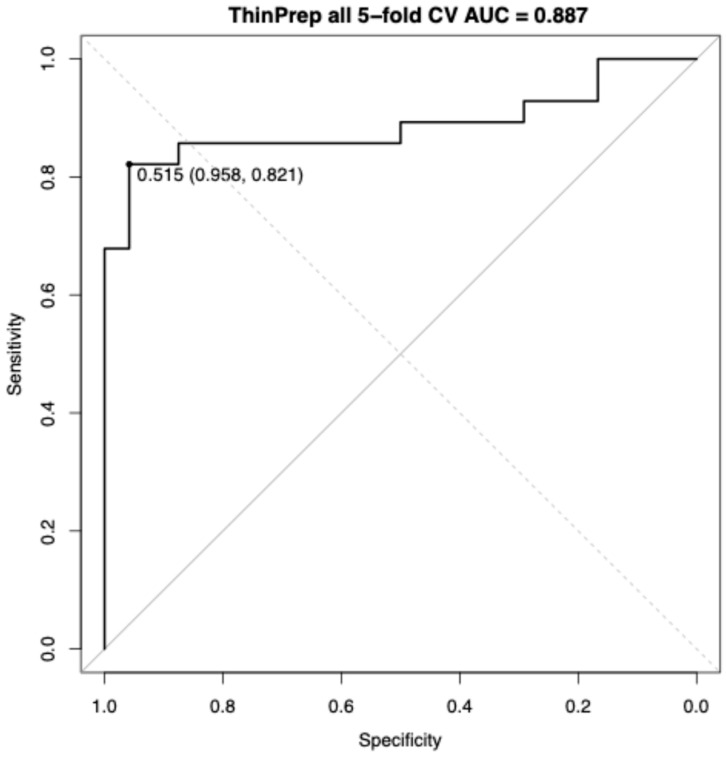 Figure 4
Peer Reviews
No public reviews on file for this paper yet. If you reviewed it on a platform where reviews are public (OpenReview, ICLR, NeurIPS, ICML), you can paste yours below so the community can read it here.
Videos
No videos yet. Explain this paper in a talk, walkthrough, or lecture? Add one.
Taxonomy
TopicsCervical Cancer and HPV Research · AI in cancer detection · Endometrial and Cervical Cancer Treatments
1. Introduction
Cervical cancer screening is increasingly shifting toward human papillomavirus (HPV) testing as the primary modality in line with contemporary guidelines and risk-based management frameworks [1,2]. Nevertheless, cytology retains the unique advantage of providing direct morphological assessment of epithelial lesions and continues to play a central role in clinical diagnosis using the Bethesda System [3]. Within this context, the identification of atypical glandular cells (AGCs) in cervical cytology is clinically significant as it necessitates prompt targeted follow-up and careful differential diagnosis [1,4]. AGCs represent a heterogeneous spectrum of findings, ranging from reactive changes to precancerous lesions and invasive malignancies across both squamous and glandular lineages, as described in contemporary reviews of glandular cytology and the Bethesda classification [5,6]. A previous study conducted in the United States has shown that approximately 5.2% of AGC cases have been associated with malignancy [4].
The incidence of endometrial cancer (EC) is rising worldwide, underscoring the need for improved detection strategies beyond traditional cervical pathways. Recent global estimates and trend analyses have shown substantial growth in EC burden since the 1990s, with 400,000 new cases reported worldwide annually in 2020–2022 [7,8,9]. Endometrial cell spillover into cervical cytology is clinically meaningful. In women aged ≥50 years, or after menopause, the presence of endometrial cells on Papanicolaou tests is associated with endometrial pathology, including carcinoma, and therefore warrants targeted evaluation [10,11]. Such cases are frequently categorized as AGCs, and EC represents 57.6% of AGC-associated malignancies [4]. These observations suggest the need for diagnostic approaches that carefully consider both endometrial and cervical sources of disease. However, consistent visual appraisal is difficult [12,13,14]. Moreover, reliable distinction among these diverse etiologies remains challenging, as conventional cytomorphologic interpretation is subject to observer variability [15,16]. Therefore, advanced imaging analytics may detect endometrial cell leakage and contribute to the diagnosis of EC.
Recent advances in digital pathology and image analysis enable reproducible extraction and quantification of diverse features, such as shape, texture, and spatial arrangement, through generating standardized measurements from whole-slide and cytology images [17,18,19]. These computational methods can complement traditional experience-dependent assessments through revealing subtle differences not readily appreciable to an unaided microscopy [12,20]. Prior studies and systematic reviews of automated cervical screening tools have reported improvements in both accuracy and efficiency when using artificial intelligence (AI)-assisted digital cytology [21,22].
Within this background, this pilot study aims to distinguish benign (normal) cases from atypical endometrial hyperplasia (AEH) and EC within AGC cytology using quantitative image analysis of liquid-based cervical cytology.
2. Materials and Methods
2.1. Case Selection
Between 2014 and 2024, we identified 161 cases of AGCs at the University of Fukui Hospital in which liquid-based cervical cytology (LBC) had been used (SurePath, Becton, Dickinson and Company, Franklin Lakes, NJ, USA; or ThinPrep, Hologic, Inc., Marlborough, MA, USA). The AGC subcategories were not routinely assigned [23]. The platform varied according to period—SurePath (2014–2017), ThinPrep (2018–2023), and SurePath again in 2024—reflecting transitions prompted by institutional equipment upgrades. Reference diagnoses were determined from histologic assessment or follow-up cytology. Histological diagnosis was derived from biopsy or surgical specimens. The benign (normal) category included the following: (i) cases with benign histologic findings and no evidence of atypical endometrial hyperplasia or endometrial cancer (AEH/EC) and/or (ii) cases in which repeat cervical cytology during follow-up was negative for intraepithelial lesion or malignancy without a subsequent clinical diagnosis of endometrial neoplasia. Trained pathology specialists performed all the histopathologic and cytologic assessments. In this study, AEH/EC comprised atypical endometrial hyperplasia and endometrial cancer, including endometrioid carcinoma and non-endometrioid histologies such as serous and clear cell carcinoma.
This retrospective study was approved by the Research Ethics Committee of the University of Fukui (Approval No. 20250063). Written consent was waived and opt-out consent was implemented via public notice on the following institutional website: https://research.hosp.u-fukui.ac.jp/rinsho/ethicscommittee/koukai_list/#sankafujinka (accessed on 1 December 2025).
Figure 1 shows the pathological results of the AGC cases, of which 36.6% (59/161) were lesions of endometrial origin and 37.9% (61/161) were classified as normal. On the SurePath slides, 37 cases were classified as normal (median age, 48.3 [range, 31.6–74.0] years) and 25 were classified as AEH/EC (median age, 58.6 [range, 41.1–81.3] years). Within the AEH/EC group, there were two cases of AEH, while ECs comprised endometrioid grade 1 (n = 12), grade 2 (n = 7), and grade 3 (n = 2); serous carcinoma (n = 1); and clear cell carcinoma (n = 1). Among the post-menopausal subset, 13 cases were normal and 17 cases were AEH/ECs, comprising endometrioid grade 1 (n = 8), grade 2 (n = 6), and grade 3 (n = 1); serous carcinoma (n = 1); and clear cell carcinoma (n = 1).
On the ThinPrep slides, 24 cases were classified as normal (median age, 41.5 [range, 21.2–80.5] years) and 28 were classified as AEH/EC (median age, 59.5 [range, 35.2–79.8] years). Within the AEH/EC group, there was one case of AEH, and the remaining carcinomas included endometrioid grade 1 (n = 13), grade 2 (n = 6), and grade 3 (n = 4); serous carcinoma (n = 2); and clear cell carcinoma (n = 2). Among post-menopausal patients, there were 5 normal cases and 19 AEH/EC cases, comprising endometrioid grade 1 (n = 8), grade 2 (n = 5), and grade 3 (n = 3); serous carcinoma (n = 2); and clear cell carcinoma (n = 1).
2.2. Image Acquisition and Preprocessing
The analytical workflow is illustrated in Figure 2. Whole-slide images, which were acquired using a SLIDEVIEW VS200 research slide scanner (Evident, Tokyo, Japan), were then processed semi-automatically using QuPath and OpenCV to detect and record cell clusters [24]. The slides were initially scanned at one-third resolution, after which coordinates were adjusted to full scale. Red, green, and blue (RGB) images were converted to grayscale, and global thresholding (fixed threshold = 210) was applied to binarize the images. Contours of connected foreground regions were then extracted and their areas were calculated. To reduce false detections, only regions with areas between 10,000 and 100,000,000 pixels in the downsampled images were retained as cell clusters. These regions were polygonized, rescaled to original slide coordinates, and saved as annotations in QuPath. Any enclosed areas that did not represent cell clusters were manually excluded (Figure 2).
2.3. Feature Extraction
The following features were measured: (i) gray-level co-occurrence matrix (GLCM)-based texture features, including correlation, contrast, homogeneity, energy, entropy, difference entropy/variance, sum average, sum variance, and sum of squares variance, along with their normalized counterparts; (ii) local binary pattern (LBP) features, including mean, standard deviation (SD), and entropy [25,26]; and (iii) intensity statistics within regions of interest sampled at 2.00 µm per pixel, including mean, SD, minimum, maximum, median values for optical density (OD) sum, hematoxylin, residual, RGB channels, hue, saturation, and brightness. Geometric descriptors (area, µm^2^; length, µm) were also recorded (Figure 3). For each case, the mean, SD, maximum, minimum, median, and 75th (Q75) and 95th (Q95) percentiles of these measurements were calculated (Figure 3). One case containing only a single cluster in SurePath was excluded because the SD could not be defined. Summaries of the extracted data are presented in Supplementary Tables S1 and S2.
2.4. Statistical Analyses
All statistical computations were performed using EZR version 1.42 software [27]. Receiver operating characteristic (ROC) curves were constructed for each feature and the area under the curve (AUC) was used as the primary univariable metric. The Youden index was applied to determine the optimal threshold and the diagnostic performance for AEH/EC was calculated accordingly. Multivariable discrimination was assessed using a random forest (RF) classifier [28,29]. Feature subset selection was performed using a beam-search wrapper that increased subset size stepwise to identify compact feature panels [30,31,32]. For each candidate subset, an RF model was trained with joint tuning of the number of trees, mtry, minimal node size, and split rule. Class weights were set inverse to class frequencies. The final feature subset and hyperparameters were selected by maximizing performance under stratified 5-fold cross-validation (CV) [33]. Beam search and simultaneous RF tuning was conducted within the training folds to prevent information leakage [34]. Model performance was estimated exclusively from out-of-fold (OOF) predictions aggregated across these 5 folds [33]. From these OOF scores, the ROC curves, the cross-validated AUC (CV AUC) with DeLong 95% confidence intervals (CIs), and operating characteristics at the Youden point were derived.
3. Results
3.1. ROC Curve Analysis Between Normal and Endometrial Lesion Groups Using SurePath
Table 1 presents the ROC curve analysis for diagnosing AEH/EC using SurePath. In AEH/EC cases, the median cell cluster count was 52 (range, 1–1797), whereas in normal cases, the median cell cluster count was 58 (range, 1–1743). In univariate ROC curve analyses, dispersion-type metrics provided the strongest discrimination. Hematoxylin variability performed the best (AUC, 0.773), followed by residual variability and summed OD. Intensity features showed moderate performance, including minimum of blue, maximum; minimum of residual, maximum; and hue, mean. Red-channel dispersion occurred between these groups. Across all markers, the AUCs ranged from 0.701 to 0.773.
Performance improved in the post-menopausal subgroup where dispersion-type features again predominated. Red-channel variability exhibited the highest accuracy (SD of red, median; AUC, 0.841). Hematoxylin intensities were comparably strong (minimum of hematoxylin, median; AUC, 0.833; minimum of hematoxylin, mean; AUC, 0.819). A GLCM contrast measure captured additional heterogeneity (maximum of normalized difference entropy; AUC, 0.814). Sensitivity learning behavior was evident for blue intensity (minimum of blue, maximum; sensitivity, 0.941). Overall, the AUCs ranged from 0.798 to 0.841, indicating uniformly stronger separation post-menopause.
3.2. RF-Driven Feature Subsets and ROC Performance in SurePath
Using the locked three-feature subset (minimum of hematoxylin, SD; SD of hematoxylin, SD; and minimum of red, SD), and tuned RF hyperparameters, a stratified 5-fold cross-validation yielded a CV AUC of 0.805 (95% CI, 0.683–0.927). At the Youden threshold (0.471), sensitivity was 0.840 and specificity was 0.811 (Figure 3).
3.3. ROC Curve Analysis Between Normal and Endometrial Lesion Groups Using ThinPrep
Table 2 presents the ROC curve performance of ThinPrep in diagnosing AEH/EC. In AEH/EC cases, the median cell cluster count was 347 (range, 6–1351), whereas in normal cases, the median cell cluster count was 267 (range, 26–2007). In ThinPrep-based univariate ROC curve analyses, the overall discrimination was moderate with AUCs ranging from 0.728 to 0.778. Among all features, GLCM variance-type metrics performed the best, with the minimum sum of squares variance and minimum sum variance each achieving an AUC of 0.778 with identical operating points. Intensity markers followed closely. The minimum of OD sum: median reached an AUC of 0.765 while the minimum of hematoxylin: median achieved an AUC of 0.764, favoring specificity (specificity, 0.958). Dispersion-oriented measures clustered just below these highest performers, including the SD of brightness: median; the SD of brightness: mean; the SD of residual: minimum; minimum of residual: maximum; the SD of red: minimum; and the SD of residual: maximum.
Performance improved markedly in the post-menopausal subgroup with AUCs concentrated in a higher band (range, 0.832–0.884). The SD of hematoxylin: mean yielded the highest accuracy (AUC, 0.884; sensitivity, 0.789; specificity, 1.000). Several features demonstrated uniformly high sensitivity and specificity at Youden optimal thresholds, including the minimum of sum of squares variance, minimum of sum variance (each AUC, 0.842; sensitivity, 1.000; specificity, 0.800), and minimum of homogeneity (AUC, 0.842; sensitivity, 0.737; specificity, 1.000). Consistent with this finding, slightly lower AUCs with perfect specificity were observed for the SD of OD sum: median, as well as for Q95 of hematoxylin: SD, indicating uniformly stronger separation post-menopause.
3.4. RF-Driven Feature Subsets and ROC Performance in ThinPrep
Using the locked five-feature subset (SD of brightness, median; minimum of green, minimum; minimum of hematoxylin, median; mean of length; and minimum of sum of squares variances) and tuned RF hyperparameters, a stratified 5-fold cross-validation yielded a CV AUC of 0.887 (95% CI, 0.787–0.987). At the Youden threshold (0.515), sensitivity was 0.821 and specificity was 0.958 (Figure 4).
4. Discussion
Across SurePath and ThinPrep liquid-based preparations, univariate ROC analyses showed only moderate discrimination between normal cases and AEH/EC cases overall, but consistently stronger separation post-menopause. In SurePath, single-marker AUCs ranged from 0.701 to 0.773 and shifted upward to 0.798–0.841 post-menopause. A compact RF model trained on the overall SurePath cohort achieved a stratified 5-fold CV AUC of 0.805 (95% CI, 0.683–0.927). In ThinPrep, overall univariate AUCs were 0.728–0.778, concentrating at 0.832–0.884 post-menopause with the highest marker at 0.884. The overall ThinPrep RF yielded a stratified 5-fold CV AUC of 0.887 (95% CI, 0.787–0.987). In the univariable analyses, the highest AUC features differed between SurePath and ThinPrep. Similarly, in RF models, the feature sets selected also differed across the two preparations.
Across both preparations, AEH/EC could be differentiated from normal cases. Univariate ROC analyses indicated moderate separability overall with stronger separation post-menopause, and compact RF models further improved performance. This was consistent with the prior clinical literature indicating that a subset of AGC has shown cytologic features suggestive of AEH/EC and has been associated with a clinically meaningful risk of underlying neoplasia [4,5,6]. The stronger separation observed after menopause was clinically plausible, as reports have shown that endometrial cell findings on cervical cytology in older or post-menopausal women were associated with EC [10,11]. These findings suggested that quantitative image features can assist where human visual assessment can be challenging and offer operational leverage, particularly given the interobserver variability in AGC interpretation [15,16]. RGB-derived values should not be equated with pure hematoxylin/eosin concentrations without stain unmixing or normalization [35]. Preparation- and scanner-related variability also indicated the need for harmonization in future external validation [36]. If these limitations can be overcome, image analysis may extend diagnostic capability in selected contexts.
ThinPrep and SurePath shared high-ranking features, yet the specific highest markers differed, indicating a preparation-dependent appearance that must be considered in an image analysis workflow. Cytomorphologic comparisons indicated systematic platform-dependent differences in cellularity, cluster architecture, and background characteristics [37,38,39]. ThinPrep tended to yield flatter and more fragmented cell aggregates, whereas SurePath more often produced larger and more three-dimensional aggregates [37,38,39]. These preparation-related differences likely influenced which features were most informative for classification on each platform. Furthermore, one comparative screening study reported unequal unsatisfactory rates and operational behaviors between the two systems [38]. Taken together, these data could suggest the need for protocol-specific preprocessing/feature selection, stain normalization, and cross-preparation validation to ensure transferability in line with evidence that stain/scanner variability can degrade model performance and should be mitigated during external validation [36,40].
Image analysis-based adjuncts were technically feasible and increasingly validated. AI-assisted or computer-aided cytology can triage slides at scale, improving sensitivity while maintaining clinically acceptable specificity in both population screening and prospective evaluations [41,42,43,44]. These software-based methods can analyze quantitative morphology, intensity, and texture features from standard liquid-based preparations. These image-based measures can offer objective and reproducible aids during routine review. Because primary HPV screening is designed to detect cervical diseases, endometrial lesions such as AEH/EC can fall outside the intended detection scope of HPV testing and may therefore be overlooked, even though cervicovaginal cytology has historically identified a substantial proportion of AEH/EC, albeit incidentally [2,45]. In this context, our results can extend to prior AI-cytology work that has largely focused on cervical lesion detection and grading [22,41,42,43,44] by evaluating AEH/EC discrimination within AGC, a clinically difficult diagnostic setting.
This approach may be most useful as a decision support adjunct in AGC cases with subtle or equivocal morphology, and it may help identify AEH/EC that could otherwise be missed in HPV-negative cases under HPV primary screening.
This study has some limitations. It was a single-center retrospective study without external validation and the reported performance reflects internal cross-validation only. Therefore, external multi-site validation is required. However, the cohort reflected a real-world clinical workflow in which liquid-based cervical cytology cases classified as AGC by trained specialists were managed in routine practice, supporting the practical relevance of the findings. Owing to the limited number of cases, RF-based analyses were not performed within the post-menopausal subgroup. Nevertheless, the consistently stronger discrimination observed after menopause could suggest a clinically relevant subgroup and provide a clear rationale for targeted validation. Textural features may be influenced by pre-analytical and analytical factors, including staining procedures, scanner calibration, and platform architecture. Because SurePath and ThinPrep were used in temporally separated periods, cross-platform differences may be confounded by changes in case mix. Therefore, our analyses were intended primarily as within-platform evaluations, and any cross-platform comparisons should be interpreted cautiously. Importantly, the inclusion of both SurePath and ThinPrep may help to clarify preparation-dependent behavior and may indicate the need for standardization. Thus, prospective multicenter validation with standardized workflows will be necessary.
5. Conclusions
Quantitative analysis of liquid-based cervical cytology distinguishing endometrial lesions across both SurePath and ThinPrep with compact machine-learning models provided clear gains over univariate baselines. These model-based readouts can complement expert reviews and, in some cases where morphology can be subtle, may extend diagnostic capabilities beyond the limits of unaided visual inspections. Taken together, the findings can support a practical, prespecified RF panel as a software adjunct to HPV primary screening, including the potential to help identify ECs in HPV-negative cases.
The reference list from the paper itself. Each links out to its DOI / PubMed record.
- 1Cheung L.C. Egemen D. Chen X. Katki H.A. Demarco M. Wiser A.L. Perkins R.B. Guido R.S. Wentzensen N. Schiffman M. 2019 ASCCP Risk-Based Management Consensus Guidelines: Methods for Risk Estimation, Recommended Management, and Validation J. Low. Genit. Tract Dis.2020249010110.1097/LGT.000000000000052832243306 PMC 7147416 · doi ↗ · pubmed ↗
- 2US Preventive Services Task Force Curry S.J. Krist A.H. Owens D.K. Barry M.J. Caughey A.B. Davidson K.W. Doubeni C.A. Epling J.W.Jr. Kemper A.R. Screening for Cervical Cancer: US Preventive Services Task Force Recommendation Statement: US Preventive Services Task Force Recommendation Statement JAMA 201832067468610.1001/jama.2018.1089730140884 · doi ↗ · pubmed ↗
- 3Pangarkar M.A. The Bethesda System for Reporting Cervical Cytology Cyto Journal 2022192810.25259/CMAS_03_07_202135673697 PMC 9168399 · doi ↗ · pubmed ↗
- 4Schnatz P.F. Guile M. OʼSullivan D.M. Sorosky J.I. Clinical Significance of Atypical Glandular Cells on Cervical Cytology Obstet. Gynecol.200610770170810.1097/01.AOG.0000202401.29145.6816507944 · doi ↗ · pubmed ↗
- 5Khan M.Y.A. Bandyopadhyay S. Alrajjal A. Choudhury M.S.R. Ali-Fehmi R. Shidham V.B. Atypical Glandular Cells (AGC): Cytology of Glandular Lesions of the Uterine Cervix Cyto Journal 2022193110.25259/CMAS_03_11_202135673694 PMC 9168395 · doi ↗ · pubmed ↗
- 6Cangiarella J.F. Chhieng D.C. Atypical Glandular Cells—An Update Diagn. Cytopathol.20032927127910.1002/dc.1031614595795 · doi ↗ · pubmed ↗
- 7Bray F. Laversanne M. Sung H. Ferlay J. Siegel R.L. Soerjomataram I. Jemal A. Global Cancer Statistics 2022: GLOBOCAN Estimates of Incidence and Mortality Worldwide for 36 Cancers in 185 Countries CA Cancer J. Clin.20247422926310.3322/caac.2183438572751 · doi ↗ · pubmed ↗
- 8Gao S. Wang J. Li Z. Wang T. Wang J. Global Trends in Incidence and Mortality Rates of Endometrial Cancer among Individuals Aged 55 Years and above from 1990 to 2021: An Analysis of the Global Burden of Disease Int. J. Womens Health 20251765166210.2147/IJWH.S 49943540066179 PMC 11892492 · doi ↗ · pubmed ↗