Analysis of Codon Usage Bias Between Entomopathogenic Fungus Ophiocordyceps sinensis and Its Host, Thitarodes xiaojinensis
Jinxuan Yan, Chuyu Tang, Haoxu Tang, Bing Jia, Chao Feng, Jianzhao Qi, Yuling Li, Xiuzhang Li

TL;DR
This paper studies how codon usage differs between a parasitic fungus and its insect host, revealing how genetic factors might contribute to their specific relationship.
Contribution
The study reveals co-adaptation in codon usage between a parasitic fungus and its host, offering new molecular insights into obligate parasitism.
Findings
Codon usage in nuclear genes is shaped by natural selection, while mitochondrial genes are influenced by mutational pressure.
Overlap in optimal codons for certain amino acids suggests gene-expression level co-adaptation between the fungus and its host.
Nuclear genomes of O. sinensis and T. xiaojinensis show contrasting GC-ending codon preferences.
Abstract
Ophiocordyceps sinensis, a rare medicinal fungus endemic to the Qinghai–Tibet Plateau, exhibits a highly specific obligate parasitic relationship with its insect host, Thitarodes xiaojinensis. To investigate potential genetic underpinnings of this specificity, we analyzed codon usage bias in both the nuclear and mitochondrial genomes of the fungus and its host. The results indicate that codon usage in both organisms is shaped by both natural selection and mutational pressure. The nuclear genes are primarily driven by natural selection, whereas the mitochondrial genes are more influenced by mutational pressure. Notably, overlap in optimal codons for certain amino acids suggests possible co-adaptation at the gene-expression level. This study provides molecular evolutionary insights into the adaptation mechanisms of O. sinensis and its host, offering new perspectives on the evolution of…
Genes, proteins, chemicals, diseases, species, mutations and cell lines named across the full text — each resolved to its canonical identifier and authoritative record.
Click any figure to enlarge with its caption.
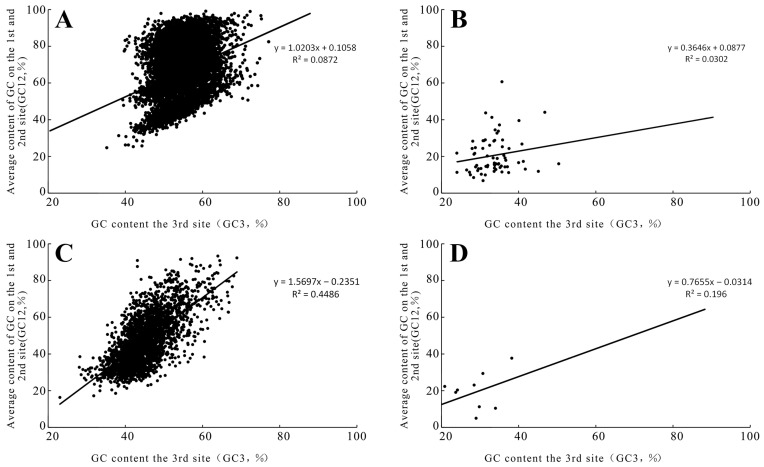 Figure 1
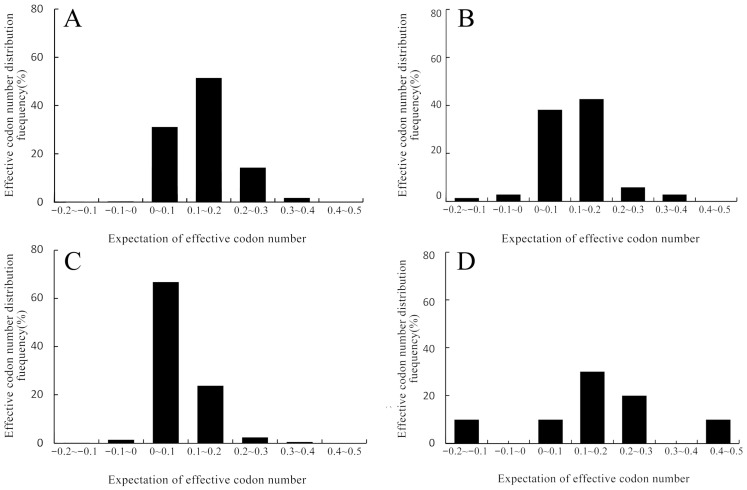 Figure 2
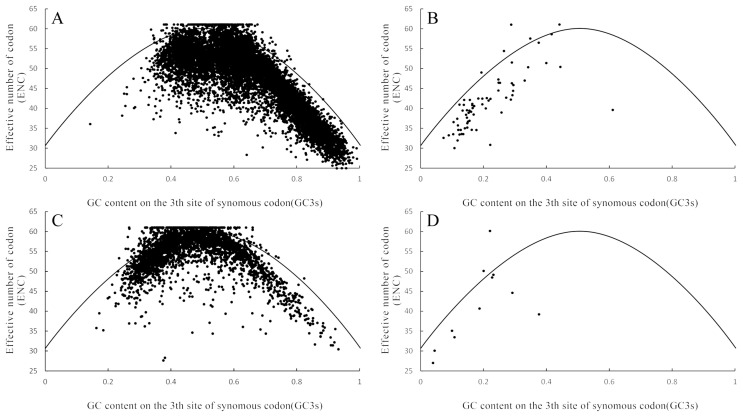 Figure 3
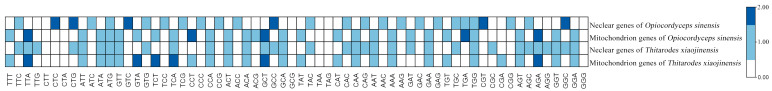 Figure 4
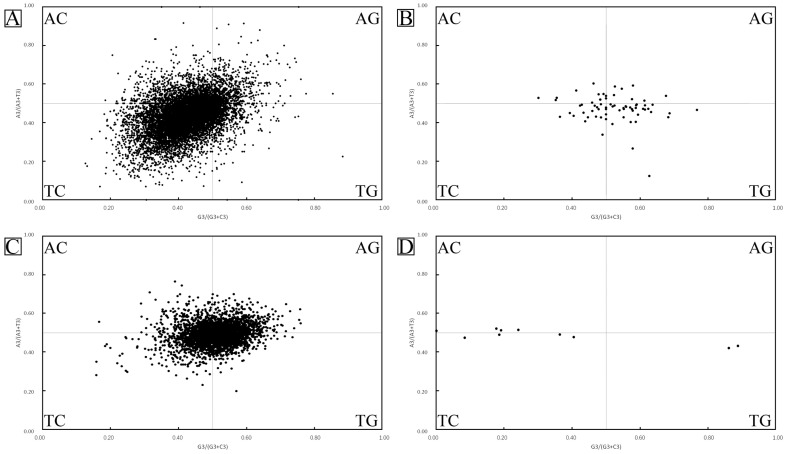 Figure 5
- —Process Optimization and Application of. Antioxidant Performance of Yushu Cordyceps sinensis Extract
- —Chinese Academy of Sciences-People’s Government of Qinghai Province on Sanjiangyuan National Park
- —Wild Ophiocordyceps sinensis Identification and Application Project
- —Shaanxi Key Laboratory of Natural Product & Chemical Biology Open Foundation
Peer Reviews
No public reviews on file for this paper yet. If you reviewed it on a platform where reviews are public (OpenReview, ICLR, NeurIPS, ICML), you can paste yours below so the community can read it here.
Videos
No videos yet. Explain this paper in a talk, walkthrough, or lecture? Add one.
Taxonomy
TopicsRNA and protein synthesis mechanisms · Genomics and Phylogenetic Studies · Microbial Natural Products and Biosynthesis
1. Introduction
Codon usage bias refers to the phenomenon that synonymous codons show non-random distribution in the genome. This bias not only reflects the evolutionary trajectory of a species but may also affect the host adaptation ability of parasites by regulating the rate and accuracy of protein synthesis. In the genetic code, most amino acids are encoded by multiple codons, which usually differ only in the third position of the codon, namely synonymous codons [1,2]. Among the 64 codons, 61 codons encode 20 different amino acids; the remaining three serve as stop codons. Codon usage bias refers to the non-uniform usage of codons [3]. Various factors, such as expression level, gene length, and compositional bias, can all influence codon bias [4,5,6]. When the GC content of the genome changes, the changing trends and degrees of different codons will show significant differences. Specifically, the variation in the GC content of the codons themselves is the direct cause of the shift in codon usage bias within the genome. This process reveals important mechanisms in genome evolution. Changes in GC content usually stem from environmental stress, which directly affects codon composition. For example, in a high-GC environment, genomes tend to increase the usage frequency of GC-rich codons, such as GGC, CCC, and CGC, while reducing the proportion of AT-rich codons such as AAT, TTA, and ATA [7].
O. sinensis refers to the complex of the larval corpse and fungal stroma formed by the infection of the larvae of Hepialidae insects by O. sinensis [8]. It is a resource with extremely high ecological and economic value on the Qinghai–Tibet Plateau [3,9]. O. sinensis is also a traditional substance homologous to medicine and food; it is of great significance for improving public health and enhancing the quality of human life in the future [10,11].
Currently, there are extensive reports on the mitochondrial codon usage bias of Clavicipitaceae and Hepialidae. By analyzing the codon usage bias of Samsoniella hepialid and Samsoniella yunnanensis, it was found that there are significant differences in genomic characteristics and secondary metabolite biosynthetic gene clusters among fungi of different genera, different species, and different strains of the same species. What is more, the phylogenetic tree constructed by PKS (polyketide synthase) homologous sequences was highly similar to the multi-gene genetic distance tree, indicating that PKS homologous sequences can be used as molecular markers. By analyzing the mitochondria codons of Thitarodes sejilaensis from Sejila Mountain in Tibet, it was found that its mitochondria contain 13 protein-coding genes [12]. Most of these use the typical start codon ATN. However, COI (Cytochrome c Oxidase subunit I) and ND1 (NADH dehydrogenase subunit 1) use the atypical start codons CGA and TTG; the top codons are mostly TAA. In addition, the researchers also studied the mitochondrial codon usage bias of Thitarodes damxungensis and Thitarodes pui. They found that the mitochondrial genomes of T. damxungensis and T. pui had high AT contents (82.5% and 81.4%) and that the gene arrangement order was the same as that of ancestral insects. Analysis based on the K2P (Kimura two-parameter) genetic distance showed that T. pui was most closely related to T. sejilaensis and that T. damxungensis was most closely related to Thitarodes yunnanensis [13].
There are relatively few reports on the nuclear genomes of Ophiocordycipitaceae and Hepialidae. Therefore, Beauveria bassiana was selected for codon bias analysis. Researchers analyzed B. bassiana and found that B. bassiana does not have a strong codon usage bias [14]. Codon bias is affected by multiple factors, such as mutational pressure and natural selection, and the selection for translation efficiency plays an important role in shaping codon usage bias. The study on the codon usage bias of Epichloë festucae found that the codon usage bias of E. festucae is related to gene length, hydrophobicity, and aromaticity [15]. There is a significant positive correlation between gene length and codon usage bias. The GRAVY value and Aromo value are negatively correlated with codon usage bias. In addition, the researchers analyzed the first comparative study on the codon usage patterns of two Lepidoptera insects, Ostrinia furnacalis and Bombyx mandarina [16]. The results indicated week codon usage bias in both species, primarily driven by nucleotide composition constraints and mutational pressure. Moreover, a preference for codons ending with cytosine (C) was observed, potentially attributable to GC-biased mutation dynamics [17].
To date, most existing studies have focused on the analysis of codon usage bias in single species. However, few studies have reported on the obligate parasitism of fungi on insects; no reports have been found on the comprehensive analysis of the two organisms in the obligate parasitic relationship. In this study, the codons of the nuclear genes of O. sinensis and T. xiaojinensis, as well as the mitochondrial genes of O. sinensis and T. xiaojinensis, were used as data for neutral analysis, ENC analysis, RSCU analysis, and optimal codon analysis to investigate the codon usage preferences between the nuclear genomes and mitochondrial genomes of O. sinensis and T. xiaojinensis.
2. Materials and Methods
2.1. Sequence Processing
The sequences of the mitochondrial gene serial number NC_034659.1, and nuclear gene accession number GCA_042246355.1 of O. sinensis, as well as the mitochondrial gene serial number NC_028348.1 and nuclear gene accession number GCA_012934285.1 of T. xiaojinensis were obtained from the GenBank database (https://www.ncbi.nlm.nih.gov/genbank/, accessed on 10 May 2025), respectively. The following screenings were performed on the downloaded sequences: (1) Ensure that the beginning of the sequence is the start codon ATG and the end is the stop codon; (2) Delete all sequences with a length less than 300 dp; (3) Ensure that there are no internal stop codons and that the open reading frame is correct; and (4) Remove redundant sequences with high similarity (95% sequence identity).
2.2. Codon Bias Analysis
Systematic analysis of the codon usage bias of T. xiaojinensis and O. sinensis was carried out using CodonW 1.42 and MEGA 12 software, to measure, in particular, the base composition of the first and third positions of codons (T3s, C3s, A3s, G3s, CG3s) and the genomic GC content, the effective number of codons (ENC), and the relative synonymous codon usage (RSCU), thus systematically comparing the base composition characteristics and codon usage preference parameters of the two organisms.
2.3. Determination of Optimal Codons
RSCU is the ratio of the usage frequency of a certain synonymous codon to the expected frequency without preference: the larger the RSCU value, the stronger the codon usage preference. The maximum value of the RSCU of synonymous codons of T. xiaojinensis and O. sinensis was taken as the optimal translation codon for the corresponding amino acid. Similarly, the RSCU values of synonymous codons of T. xiaojinensis and O. sinensis were calculated to summarize the characteristics of their optimal codons.
2.4. Drafting of ENC-GC3
In this study, the ENC-GC3 scatterplot analysis method was used. A coordinate system was constructed with the GC3 content as the abscissa and the observed effective number of codons (ENCobs) as the ordinate. The standard curve of the expected effective number of codons (ENCexp) was drawn according to the calculation formula proposed [18]. The ENC frequency ratio (ENCratio) was calculated using the formula (ENCexp − ENCobs)/ENCobs. Then, the distribution frequency map of each gene was constructed. This method quantifies the deviation between the expected and observed values to intuitively show the degree of codon usage bias.
The ENC, as a core indicator for measuring gene translation efficiency, has a numerical range with clear biological significance: when ENC = 20, it indicates complete codon bias (each amino acid uses only a single codon), while ENC = 61 reflects complete randomness (codons are used uniformly). This study systematically analyzed the ENCobs and ENCexp data of all genes and revealed the rule that lower values indicate stronger codon preference, while higher values tend towards random selection. This quantitative relationship provides an important basis for analyzing the adaptive evolution of species.
2.5. The Analysis of Parity Preference (PR2-Plot)
In this study, Microsoft Office Excel software was used to draw scatterplots. Analysis of the parity preference of codons is a scatterplot drawn based on the parity rule 2 (PR2), with A3/(A3 + T3) as the ordinate and G3/(G3 + C3) as the abscissa. When there are base mutations or selection biases between the two strands of DNA, the coordinate values of A3/(A3 + T3) and G3/(G3 + C3) will deviate from the central position of 0.5.
The core principle is to obtain AT-bias and GC-bias by evaluating and calculating the A/T/G/C content (A3S, T3S, G3S, C3S) of the third base of the codon. When the base substitution rates of the two DNA strands are balanced (for example, the rate of A → T on the W strand is equal to the rate of T → A on the complementary strand), the AT/GC content shows a symmetrical distribution; the graphical presentation uses a two-dimensional coordinate system, with AT-bias as the vertical axis and GC-bias as the horizontal axis. Data points close to the origin (0, 0) reflect mutation dominance, while deviation from the center indicates the effect of natural selection.
2.6. Neutral Analysis
Codon neutrality analysis was performed by plotting a scatterplot with GC3 as the abscissa and CG12 as the ordinate, and then by conducting linear regression fitting on it. If the slope of the fitted line approaches 0, it indicates a low correlation between GC3 and GC12. In this case, the codon usage bias is mainly driven by natural selection. Conversely, if the slope significantly deviates from 0, it reflects that the base mutation pressure has a stronger influence on codon bias. This analytical method effectively distinguishes the weight of the effects of natural selection and mutational pressure on codon evolution by quantifying the change in regression slope.
3. Results
3.1. Analysis of Base Composition of Genomic Codons in O. sinensis and T. xiaojinensis
After screening, CDS sequences of 9485 nuclear genes and 69 mitochondrial genes were obtained from O. sinensis. Their average GC contents were 62.40% and 29.20%, respectively. The GC content of nuclear sequences of O. sinensis ranged from 81.60% to 27.20%; the GC content of sequence from the mitochondrial genomes of O. sinensis ranged from 46.90% to 20.30% (Table 1). The average GC contents at the three positions of codons in the nuclear genome were 61.17% (GC1), 47.15% (GC2), and 66.13% (GC3), respectively. The distribution range of GC12 was 42.00–75.00%. The average GC contents at the three positions of codons in its mitochondrial genome were 35.38% (GC1), 31.70% (GC2), and 20.99% (GC3), respectively. The distribution range of GC12 was 24.00–50.31% (Figure 1).
A total of 2870 mitochondrial and nuclear genomic sequences and 10 CDS sequences of the mitochondrial genome exist in T. xiaojinensis. The average GC contents are 46.43% and 20.97%, respectively. The GC content of each nuclear gene sequence in T. xiaojinensis ranges from 76.80% to 21.90%; the GC content of each mitochondrial sequence in T. xiaojinensis ranges from 12.8% to 28.1%. The average GC contents at the three positions of codons in the nuclear genome are 51.01% (GC1), 39.15% (GC2), and 49.14% (GC3), respectively. The distribution range of GC12 is from 22.60% to 84.65%. The average GC contents at the three positions of codons in its mitochondrial genome are 20.97% (GC1), 29.18% (GC2), and 19.26% (GC3), respectively; the distribution range of GC12 is from 17.42% to 38.23% (Figure 1).
3.2. Neutral Analysis of the Genomes of O. sinensis and T. xiaojinensis
The neutral analysis mainly revealed the correlation between GC12 and GC3 (Figure 1). There was a positive correlation between the nuclear genes of O. sinensis sclerotium (r = 0.08, p < 0.01) and its mitochondria (r = 0.03, p < 0.01); there was also a positive correlation between the nuclear genes of T. xiaojinensis (r = 0.44, p < 0.01) and its mitochondrial genome (r = 0.19, p < 0.01). This indicates that both the nuclear genomes and mitochondrial genomes of O. sinensis and T. xiaojinensis are affected by mutation pressure.
3.3. Frequency Distribution of Effective Codons of O. sinensis and T. xiaojinensis
The ENC ranges of the nuclear genome and mitochondrial genome of O. sinensis were 24.4–61.00 and 29.81–61.00, respectively; their average values were 47.72 and 41.46, respectively. Among the 9484 genes in the nuclear genome, only 967 genes showed a high codon preference (ENC < 35). Among the 69 genes in the mitochondrial genome, only 13 genes showed a high codon preference. Therefore, the codon usage preference of O. sinensis is weak. The ranges of the effective number of codons (ENC) in the nuclear genome and mitochondrial genome of T. xiaojinensis were 27.62–61.00 and 27.10–60.11, respectively; their average values were 54.27 and 40.99, respectively. Among the 2869 genes in the nuclear genome of T. xiaojinensis, only 15 genes showed a high codon usage bias (ENC < 35); among the 11 genes in the mitochondrial genome, only 3 genes showed a high codon usage bias. Therefore, the codon usage bias of T. xiaojinensis is also weak. The usage frequency of most effective codons of genes was distributed between 0 and 0.1, indicating that the observed values of most effective codons are lower than the expected values (Figure 2).
3.4. Correlation Analysis Between the Effective Number of Codons (ENC) and the Synonymous Codon Usage at the Third Position (GC3s) of O. sinensis and T. xiaojinensis
Normally, ENC plotting analysis is used to explore the influence of GC3s on the codon usage pattern of the genome. If the effective number of codons (ENC) of a gene lies on the expected curve, it indicates that there is no codon usage bias in the gene. In this study, the ENC values of most genes were lower than the expected values and located at the lower right of the expected curve (Figure 3). Apart from the influence of other factors, mutational pressure is also an important factor affecting codon usage bias.
3.5. Correlation Analysis of Each Codon Index in the Genomes of O. sinensis and T. xiaojinensis
To determine the correlation between the relative codon usage preferences and nucleotide compositions of the genomes of O. sinensis and T. xiaojinensis, multivariate correlation analysis was used in this study to determine the interrelationship between codon usage preferences and hydrophobicity and aromaticity. The results showed that in the nuclear genome and mitochondrial genome of O. sinensis, there were extremely significant correlations between GC3s and Gravy, Aromo values (p < 0.01). In the nuclear genome of T. xiaojinensis, there were extremely significant correlations between GC3s and Gravy, Aromo values (p < 0.01), and there was an extremely significant correlation between the GC3s and Gravy value in the mitochondrial genome (p < 0.01).
The ENC values of the nuclear genome of O. sinensis (Table 2) were extremely significantly negatively correlated with the Gravy (r = −0.337, p < 0.01) and Aromo (r = −0.280, p < 0.01) values. In the mitochondrial genome of O. sinensis (Table 3), the ENC value was significantly correlated with Gravy (r = 0.270, p < 0.05). The ENC value of the nuclear genome of T. xiaojinensis (Table 4) was extremely significantly positively correlated with the Aromo value (r = 0.075, p < 0.05); the ENC value of the mitochondrial genome of T. xiaojinensis (Table 5) was extremely significantly positively correlated with the Aromo value (r = 0.931, p < 0.05). Meanwhile, the ENC value of the nuclear genome of O. sinensis (Table 2) showed a highly significant negative correlation with the first axis (r = −0.604, p < 0.05) and second axis (r = −0.458, p < 0.05), and a highly significant negative correlation with GC3s (r = −0.789, p < 0.01). The ENC value of the mitochondrial genome of O. sinensis (Table 3) showed a highly significant positive correlation with GC3s (r = 0.396, p < 0.01). The ENC value of the nuclear genome of T. xiaojinensis (Table 4) was positively correlated with the first axis (r = 0.135, p < 0.01) and second axis (r = 0.105, p < 0.01) and showed a highly significant negative correlation with GC3s (r = −0.221, p < 0.01). The ENC value of the mitochondrial genome of T. xiaojinensis (Table 5) showed a highly significant positive correlation with GC3s (r = 0.722, p < 0.01).
3.6. Relative Synonymous Codon Usage Frequency
Through calculation, the usage times and frequencies (RSCU) of synonymous codons in the nuclear genome of O. sinensis were obtained (Figure 4). In both nuclear genes and mitochondrial genes, O. sinensis and T. xiaojinensis have some common frequently used codons, such as TTA, GCT, TCA, AGA, etc. Although there are common high-frequency codons, there are still certain differences in the specific usage frequencies and the usage of other codons. Especially in mitochondrial genes, there are obvious differences in codon usage preferences between the two. The frequencies of base codons ending with T and A are relatively high, and the RSCU values are greater than 1 (indicated by light blue), which are the codons preferentially used in the genomes of O. sinensis and T. xiaojinensis. In contrast, for C and G, the RSCU values are all less than 1, which are the codons with lower usage frequencies and are avoided by both.
3.7. Analysis of Parity Preference
Odd–even preference is mainly used to analyze the relationship between pyrimidines and purines at the third position of codons (Figure 5). In the sclerotium genes and mitochondrial genes of O. sinensis, the content of pyrimidines (C + T) at the third position is greater than that of purines (A + G); in T. xiaojinensis, the content of pyrimidines (C + T) at the third position is approximately equal to that of purines (A + G). Generally, it is considered that when G and C (or A and T) are proportionally distributed at the third position of codons, it indicates that the codon usage bias is affected by mutation pressure; if G and C (or A and T) are disproportionately distributed at the third position of codons; it indicates that the codon usage bias is affected by natural selection pressure.
Therefore, based on the parity analysis, the codon usage bias of the genes of O. sinensis may be affected by natural selection pressure, while the codon usage bias of the genes of T. xiaojinensis may be affected by mutation pressure.
3.8. Optimal Codon Analysis
In this study, the ΔRSCU method was used to identify the optimal codons. By calculating the optimal codon tables for the entire genome, the tables show the synonymous codons encoding each amino acid and the corresponding RSCU values of “high expression” and “low expression” for each synonymous codon. The ΔRSCU values were obtained. In the nuclear genome of O. sinensis, 25 optimal codons and 16 optimal codons were detected in the mitochondrial genome. Among these, in the nuclear genome, 10 codons end with G and 15 end with C; in the mitochondrial genome, 9 codons end with T and 7 end with A. This indicates that these are related to the GC content at the third position of the codons in the nuclear genome; the codons in the mitochondrial genome may be related to the AT content at the third position. In the nuclear genome of T. xiaojinensis, there are 28 optimal codons, and 13 optimal codons in the mitochondrial genome. Among these, in the nuclear genome, 12 codons end with G and 16 end with C; in the mitochondrial genome, 10 codons end with T and 3 end with A (Table 6).
In addition, there are two optimal codons for Leucine (Leu), Valine (Val), Serine (Ser), and Proline (Pro) in the nuclear genome of O. sinensis. There are also two optimal codons for Leucine (Leu), Valine (Val), Serine (Ser), Proline (Pro), Threonine (Thr), Alanine (Ala), and Arginine (Arg) in the nuclear genome of T. xiaojinensis.
4. Discussion
By analyzing the codon usage biases of O. sinensis and T. xiaojinensis, it can be shown that the nuclear genes of O. sinensis may be mainly affected by natural selection, while the nuclear genes of T. xiaojinensis may be affected by mutational pressure. Moreover, the mitochondrial genes of both O. sinensis and T. xiaojinensis are mainly affected by mutational pressure.
The analysis revealed that the nuclear genome of O. sinensis exhibits 25 optimal codons, with 10 ending in G and 15 ending in C. The nuclear genome of T. xiaojinensis contains 28 optimal codons, with 12 ending in G and 16 ending in C. Therefore, it is inferred that most of the codons in the nuclear genomes of O. sinensis and T. xiaojinensis tend to end with G or C, which is mainly affected by natural selection. In the analysis of codon usage bias of fungi, such as Amanita, Volvariella volvacea, and Pleurotus [19,20], researchers found that the nuclear genes of these species all prefer codons ending with C or G, which is similar to the research results of the nuclear genes of O. sinensis [21,22]. The analysis shows that the nuclear genes of Lepidoptera insects, such as O. furnacalis and B. mandarina, prefer to end with C or G, which is similar to the results of this study [16]. In studies on Heliconius melpomene, Danaus plexippus, Callosamia cecrops, Parides sennea, and Drosophila melanogaster [23], it was found that the codon preferences of nuclear genes in these species all favored codons ending with A or T. This is inconsistent with the results of the codon preference analysis of the nuclear genome of T. xiaojinensis. This could be attributed to butterflies and hepialid moths belonging to distinct families within the order Lepidoptera; for instance, butterflies typically fall under the superfamily Papilionoidea, while hepialid moths belong to the family Hepialidae. The nuclear genes of fungi in yeasts, such as Saccharomyces cerevisiae and Schizosaccharomyces pombe, prefer to end with A or T, which is inconsistent with the research results of the nuclear genes of O. sinensis. This may be related to the genetic evolution or environmental adaptability of these species [24].
In the mitochondrial genome of O. sinensis, 16 optimal codons were identified, comprising seven ending with A and nine ending with T. In contrast, the mitochondrial genome of T. xiaojinensis contains 13 optimal codons, with 3 ending with A and 10 ending with T. Consequently, it is concluded that mitochondrial genomic codon usage in O. sinensis and T. xiaojinensis predominantly terminates with A or T, and is primarily driven by natural selection. Analysis of mitochondrial codon usage bias in Amanita sinensis, Amanita muscaria and Amanita phalloides [25] and S. hepialid revealed a consistent preference for codons ending with A or T, aligning with findings from studies on the mitochondrial genome of O. sinensis. Analysis of mitochondrial codon usage bias in Kallima inachus, Argynnis hyperbius and Brachmia macroscopa, Potanthus flavus revealed a consistent preference for codons ending with A or T, aligning with the mitochondrial codon preference observed in T. xiaojinensis [26,27]. Analysis of mitochondrial codon usage bias in diverse higher plants—including Medicago polymorpha, Medicago sativa, and Medicago truncatula—revealed that despite phylogenetic divergence across plant families, their mitochondrial preferred codons predominantly terminate with A or T [28,29]. This finding aligns with results from the present study and may reflect conserved evolutionary traits stemming from the monophyletic origin of mitochondria in ancestral microorganisms [30].
ENC analysis demonstrated that the effective number of codons (ENC) for nuclear genes ranged from 24.4 to 61.0 in O. sinensis sclerotia and 26.4 to 61.0 in T. xiaojinensis, whereas mitochondrial genes exhibited distinct distributions: O. sinensis mitochondria spanned 29.8–61.0, while T. xiaojinensis mitochondria showed a markedly narrower ENC range (27.1–49.13). Comprehensive codon usage analysis employing CodonW and MEGA integrated three complementary approaches: ENC-GC3s correlation plots, parity rule 2 (PR2) analysis, and neutrality tests to characterize usage patterns and elucidate evolutionary mechanisms in both organisms.
Codon bias is usually affected to varying degrees by multiple factors such as gene length, gene expression level, genomic base composition, transcription, and translation. The selection–mutation–drift model suggests that, among numerous influencing factors, base mutation pressure and natural selection pressure are the two most important ones. The codon usage biases of different fungal genomes also vary. The nuclear genome tends to be affected by selection pressure, while the mitochondrial genome is more strongly influenced by base mutations, which is consistent with the results of this study [31]. Mutational selection pressure is considered to be the most significant factor contributing to codon asymmetry. Through neutral plotting analysis of the nuclear and mitochondrial genomes of O. sinensis (Figure 1), it was found that the codons of O. sinensis are subject to directional mutational pressure under natural selection; similar conclusions were drawn in the study of B. bassiana [32,33]. This result is the same as that of other fungi living a parasitic life. Their codons are also affected by strong directional mutation pressure. Therefore, it is considered that the directional pressure on the codons of O. sinensis may be related to its parasitic life, and that the pressure may come from its host [34].
Data show that, for both O. sinensis and T. xiaojinensis, the effective number of codon (ENC) values of their nuclear genes and mitochondrial genes are greater than 35, indicating that the codon usage bias of their nuclear genomes and mitochondrial genomes is weak [35,36]. Within the O. sinensis–host insect system, this weak bias may arise from the parasitic life history: as an obligate parasitic fungus, O. sinensis genomic evolution is influenced by co-evolution with its host, reducing gene expression constraints. Concurrently, the host insect T. xiaojinensis genome likely maintains genetic diversity through selection mechanisms to adapt to high-altitude environments [37].
Furthermore, O. sinensis exhibits a relatively long lifecycle among cordyceps fungi; its ecological adaptation strategy sacrifices reproductive speed for host specificity and survival advantages in extreme environments. Genome analysis of O. sinensis reveals a codon usage bias significantly favoring low-frequency codons. This bias optimizes gene translation efficiency, meets protein synthesis demands in low-temperature, high-altitude conditions, and aligns with co-evolutionary mechanisms involving the slow lifecycle and ecological strategy [38,39].
As an obligate parasite of T. xiaojinensis, O. sinensis can evade competitive microbial pressures. From a nuclear gene perspective, O. sinensis may enhance translation efficiency for host-cell regulation via codon bias optimization in specific genes such as those encoding parasitic effector proteins [40]. Conversely, weak codon bias in the nuclear genes of T. xiaojinensis reflects diverse mutation strategies responding to parasitic pressures [41]. Regarding mitochondrial gene interactions, O. sinensis retains strong codon bias in mitochondrial genomes (COX1 and ND4 genes), potentially linked to its reliance on host mitochondrial energy metabolism [42]. In contrast, T. xiaojinensis mitochondrial genome shows low-preference patterns, adapting to metabolic plasticity during larval stages in hypoxic, low-temperature environments [43]. Notably, complementary codon pairing occurs between the two species—for instance, O. sinensis prefers NNT codons while T. xiaojinensis favors NNA anticodons in the ND2 gene. This suggests a cross-species coordinated regulatory mechanism for mitochondrial gene expression, possibly serving as a key molecular interface in obligate parasitic system evolution [44,45]. Collectively, the dual co-evolutionary pathways of nuclear and mitochondrial genomes maintain a dynamic balance between O. sinensis breaching host immune barriers and host-restricted metabolic resource allocation [46].
An obligate parasitic relationship exists between O. sinecsis and T. xiaojinensis; this host specificity is manifested as the extreme specificity of the former only being able to infect the larvae of the latter, which is in sharp contrast to the generalist parasitism that can infect hundreds of hosts [47]. This difference essentially stems from the constraints of the “host unit”—jointly shaped by the host niche such as the high-altitude habitat of ghost moth larvae, and the co-evolutionary history of the parasitic system [48]. Although host specificity is a common pattern in parasitic systems, there are still significant gaps in the research on the molecular mechanisms of obligate parasitic taxa, as an obligate parasitic fungus with both medicinal value and ecological representativeness, O. sinensis and its interaction system with its key host, T. xiaojinensis, provide an ideal model for exploring the adaptive functions of codon bias [49]. By focusing on the differences in codon usage preferences between the two, this study aims to decipher the molecular adaptation mechanisms of obligate hosts and host organisms at the levels of gene expression regulation and protein synthesis, providing a theoretical basis for revealing the evolutionary driving forces of the obligate parasitic interaction relationship [50,51].
Based on existing research, we propose a new hypothesis: codon preference is jointly influenced by natural selection, mutational pressure, and host ecological adaptability [52]. For example, in obligate parasitic fungi, such as O. sinensis, this fungus forms a coevolutionary mechanism with its host to cope with survival pressures [53]. Future research can explore the dynamic change patterns under different ecological gradients, particularly adaptations to extreme environments. Additionally, single-cell sequencing technology can be used to analyze the molecular coevolutionary trajectories of the host–parasite system, which will provide new perspectives for understanding the evolutionary dynamics of obligate parasitic relationships [54].
5. Conclusions
This study systematically analyzed the codon usage bias in the nuclear and mitochondrial genomes of O. sinensis and its host insect, T. xiaojinensis, revealing significant differences in codon preference between the two and their evolutionary driving forces. The results showed that the nuclear genome of O. sinensis exhibited a strong GC3 preference and a codon usage pattern dominated by natural selection, while the nuclear genes of T. xiaojinensis were more significantly affected by mutational pressure. In the mitochondrial genomes, both showed high AT content and were mainly dominated by mutational pressure [55]. In addition, although there was some overlap in the selection of optimal codons between the two organisms, the overall biases were different, suggesting that they have formed unique molecular adaptation mechanisms during their long-term obligate parasitic relationship.
The reference list from the paper itself. Each links out to its DOI / PubMed record.
- 1Hershberg R. Petrov D.A. Evidence That Mutation Is Universally Biased towards AT in Bacteria P Lo S Genet.20106 e 100111510.1371/journal.pgen.100111520838599 PMC 2936535 · doi ↗ · pubmed ↗
- 2Parvathy S.T. Udayasuriyan V. Bhadana V. Codon usage bias Mol. Biol. Rep.20224953956510.1007/s 11033-021-06749-434822069 PMC 8613526 · doi ↗ · pubmed ↗
- 3Wu X. Xu M. Yang J.R. Lu J. Genome-wide impact of codon usage bias on translation optimization in Drosophila melanogaster Nat. Commun.202415832910.1038/s 41467-024-52660-439333102 PMC 11437122 · doi ↗ · pubmed ↗
- 4Akashi H. Codon bias evolution in Drosophila. Population genetics of mutation-selection drift Gene 199720526927810.1016/S 0378-1119(97)00400-99461401 · doi ↗ · pubmed ↗
- 5Hershberg R. Petrov D.A. Selection on Codon Bias Annu. Rev. Genet.20084228729910.1146/annurev.genet.42.110807.09144218983258 · doi ↗ · pubmed ↗
- 6Powell J.R. Moriyama E.N. Evolution of codon usage bias in Drosophila Proc. Natl. Acad. Sci. USA 1997947784779010.1073/pnas.94.15.77849223264 PMC 33704 · doi ↗ · pubmed ↗
- 7Hershberg R. Tang H. Petrov D.A. Reduced selection leads to accelerated gene loss in Shigella Genome Biol.200781110.1186/gb-2007-8-8-r 16417686180 PMC 2374995 · doi ↗ · pubmed ↗
- 8Sung G.H. Hywel-Jones N.L. Sung J.M. Luangsa-Ard J.J. Shrestha B. Spatafora J.W. Phylogenetic classification of Cordyceps and the clavicipitaceous fungi Stud. Mycol.20075755910.3114/sim.2007.57.0118490993 PMC 2104736 · doi ↗ · pubmed ↗