Potential Biological Processes Related to Brain SLC13A5 Across the Lifespan: Weighted Gene Co-Expression Network Analysis from Large Human Transcriptomic Data
Bruna Klippel Ferreira, Patricia Fernanda Schuck, Gustavo Costa Ferreira, Hércules Rezende Freitas

TL;DR
This study explores how the SLC13A5 gene, linked to brain disorders, changes across human development and identifies related biological processes in the brain.
Contribution
The study reveals a mitochondria-centered gene network co-varying with SLC13A5 across the human lifespan.
Findings
SLC13A5 expression peaks in the first postnatal year in the cerebrum and increases in the cerebellum across the lifespan.
SLC13A5 is part of a gene module strongly associated with brain maturation and mitochondrial function.
A subnetwork of genes closely connected to SLC13A5 includes CYP46A1, ITM2B, and others involved in oxidative phosphorylation.
Abstract
Background/Objectives: SLC13A5 encodes a sodium–citrate cotransporter implicated in early-onset epileptic encephalopathy and metabolic brain dysfunction, yet its developmental regulation and molecular context in the human brain remain incompletely defined. Methods: Leveraging human developmental transcriptomes from the Evo-Devo resource, we delineated tissue trajectories and network context for SLC13A5 across the fetal–postnatal life. Results: In the cerebrum, SLC13A5 expression rises from late fetal stages to peak in the first postnatal year and then declines into adulthood, while cerebellar levels increase across the lifespan; liver shows a fetal decrease followed by sustained postnatal upregulation. A transcriptome-wide scan identified extensive positive and negative associations with SLC13A5, and a signed weighted gene co-expression network analysis (WGCNA) built on biweight…
Genes, proteins, chemicals, diseases, species, mutations and cell lines named across the full text — each resolved to its canonical identifier and authoritative record.
Click any figure to enlarge with its caption.
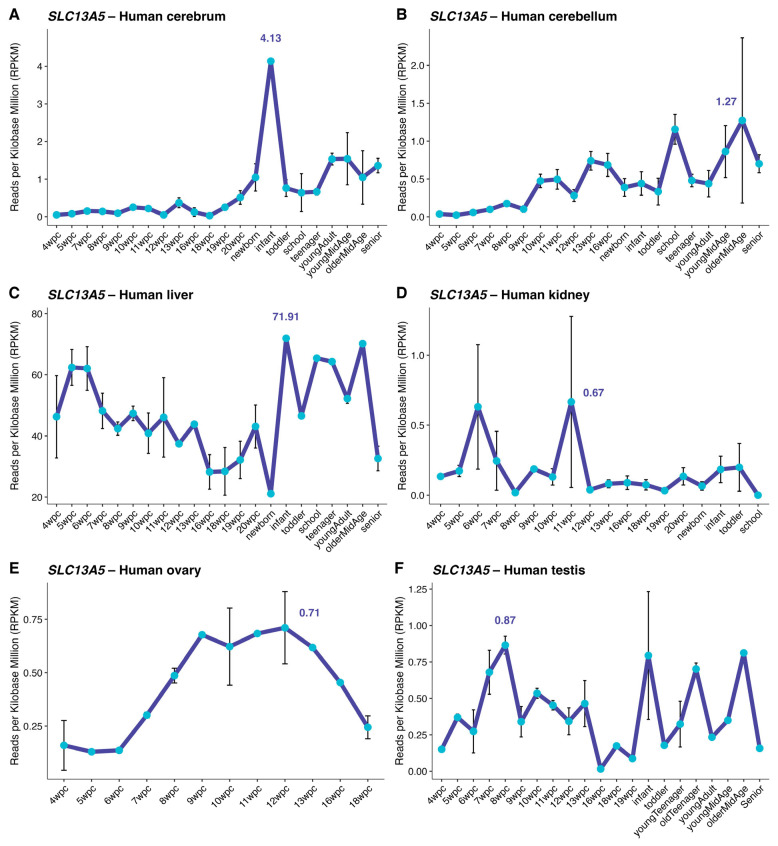 Figure 1
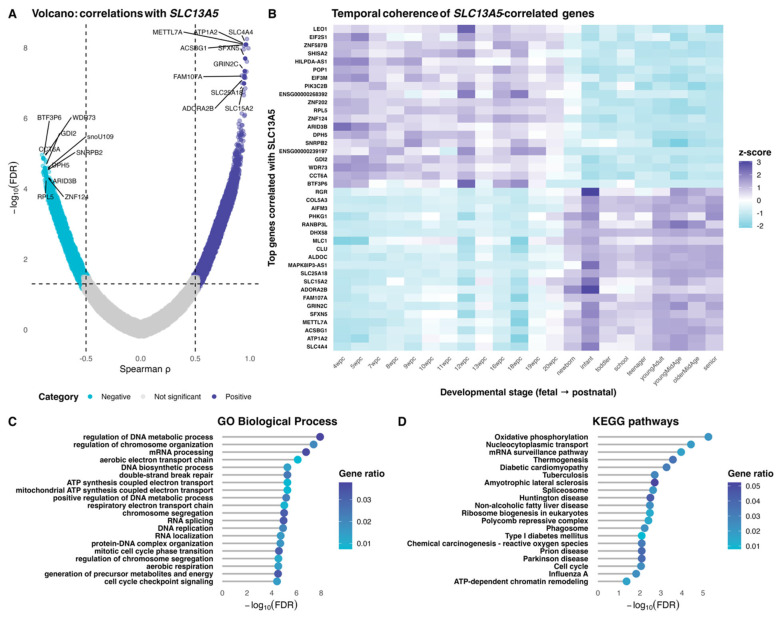 Figure 2
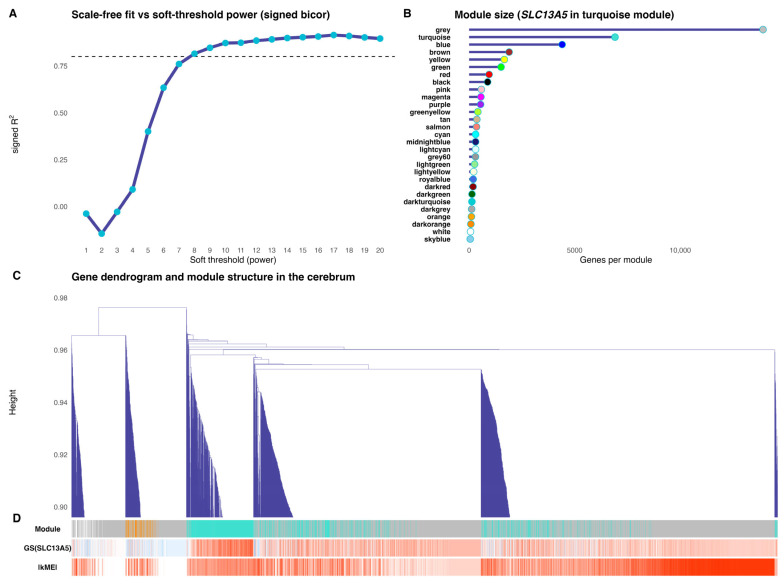 Figure 3
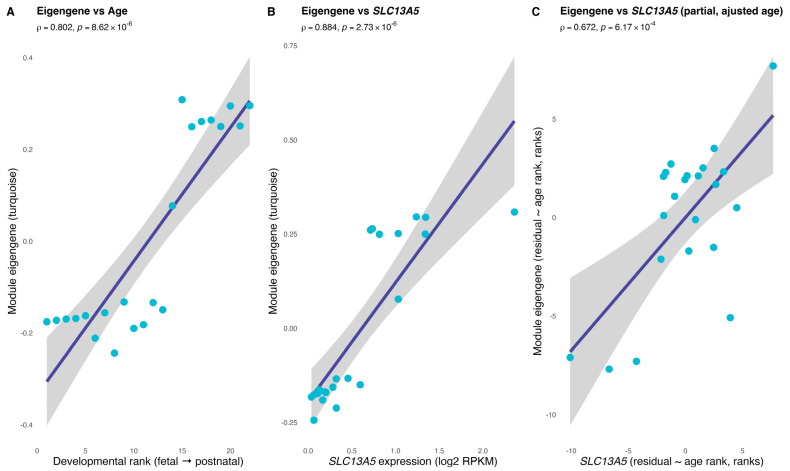 Figure 4
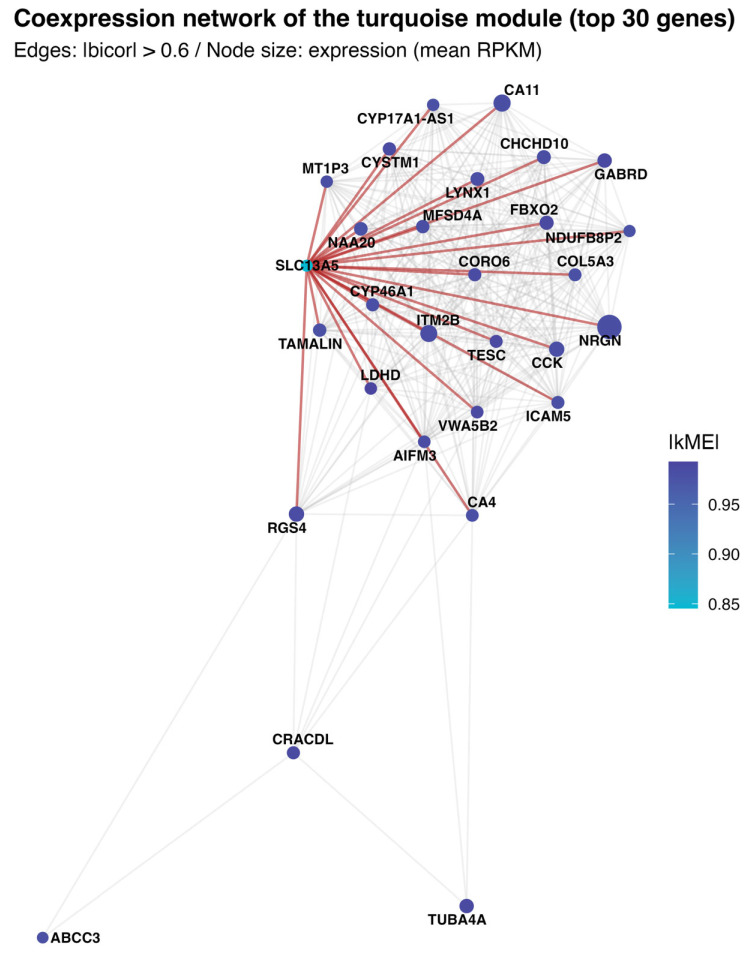 Figure 5
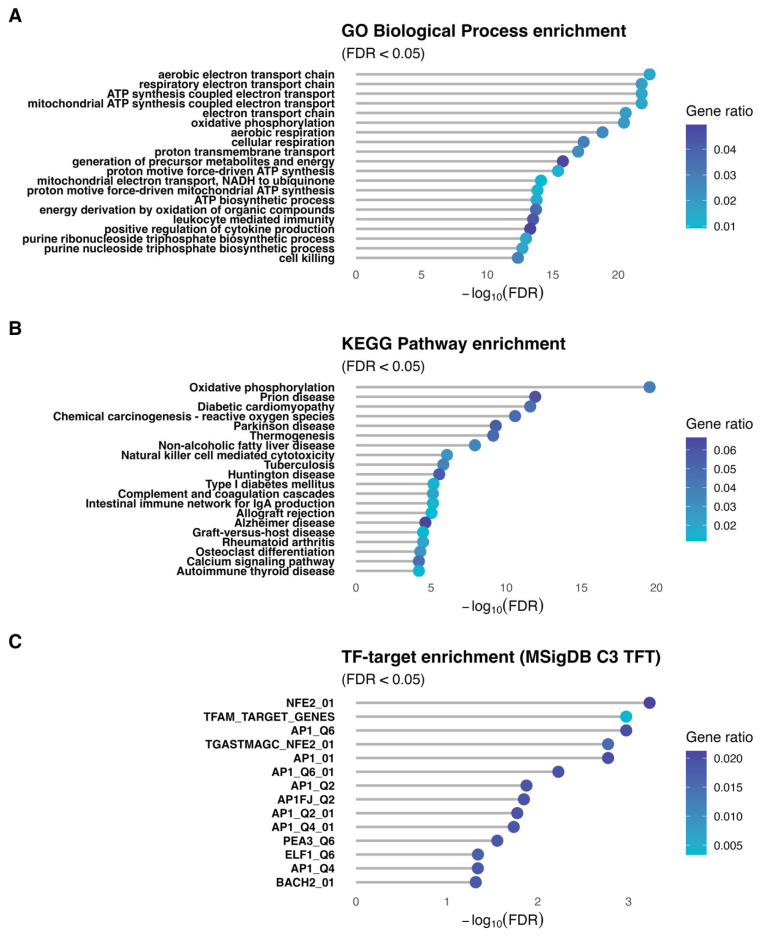 Figure 6
- —Carlos Chagas Filho Research Support Foundation of the State of Rio de Janeiro (FAPERJ, Brazil)
- —National Council for Scientific and Technological Development (CNPq, Brazil)
- —Tess Research Foundation (TRF, USA)
Peer Reviews
No public reviews on file for this paper yet. If you reviewed it on a platform where reviews are public (OpenReview, ICLR, NeurIPS, ICML), you can paste yours below so the community can read it here.
Videos
No videos yet. Explain this paper in a talk, walkthrough, or lecture? Add one.
Taxonomy
TopicsAmino Acid Enzymes and Metabolism · Neuroscience and Neuropharmacology Research · Ion Transport and Channel Regulation
1. Introduction
SLC13A5 epilepsy, also known as developmental epileptic encephalopathy 25 (OMIM # 615905), is an autosomal recessive disease caused by deficiency in SLC13A5 citrate transporter. The disease is characterized by neonatal seizures, febrile seizures, status epilepticus, developmental delay, a severe movement disorder, and lack of tooth enamel. Severe seizures start in the first days of life, with better seizure control in late childhood and adolescence but lifelong increased seizure risk [1]. Patients have global developmental delay and impaired motor function [2]. Tooth hypoplasia due to amelogenesis imperfecta remains a distinctive feature [3].
To date, more than 50 loss-of-function mutations in human SLC13A5 have been found to cause SLC13A5 epilepsy [4,5]. Interestingly, there has been no genotype–phenotype correlation identified, though all tested mutations had a severe loss of citrate transporter function [6,7]. Slc13a5-knockout mice showed pro-epileptogenic neuronal excitability changes in the hippocampus, and approximately 50% of the mice had spontaneous seizures [8].
There are no curative treatments for SLC13A5 epilepsy, and all patients are treated with standard antiseizure medications, with mixed results. Previously reported antiseizure medications include benzodiazepines, phenobarbital, phenytoin, and carbamazepine, with good seizure control in some patients. However, some patients needed to use up to 10 drugs in polytherapy [1,2]. Although current antiseizure medications may reduce seizure frequency, more targeted treatments are needed to address the epileptic and non-epileptic features of SLC13A5 epilepsy, such as communication and movement disorders [9]. Additionally, SLC13A5 has been proposed as a molecular target for several diseases, such as metabolic syndrome, kidney disease, and cancer [10].
Studies have demonstrated that SLC13A5 epilepsy symptoms change with age [1,9]. However, it is unknown whether physiological SLC13A5 expression changes over time. The present work is therefore an effort to use large transcriptomic data to investigate SLC13A5 expression in humans.
2. Materials and Methods
2.1. Data Sources
The Evo-Devo application, created by Cardoso-Moreira et al. (2019) [11], is a vast database including expression results for genes in different species, organs, and development stages. Human RNA-seq expression (RPKM) across developmental stages was obtained from the Evo-Devo resource [11]. SLC13A5 and genome-wide expression for brain and peripheral tissues reported by Evo-Devo were analyzed. Analyses focused on Homo sapiens only. Descriptive trajectories were assembled for brain, cerebellum, kidney, liver, testis, and ovary.
2.2. Preprocessing and Sample Ordering
Expression tables were reshaped into sample-by-gene matrices keyed by Ensembl gene identifiers. To stabilize variance, values were transformed as log2(RPKM + 1). Genes with zero variance or entirely missing values were removed, and Ensembl version suffixes were stripped to harmonize identifiers. Cerebrum samples were arranged according to a biologically consistent developmental sequence spanning from 4 to 20 weeks post-conception (wpc) through newborn, infant (6 to 9 months old), toddler (2 to 4 years old), school age (7 to 9 years old), teenager (13 to 19 years old), young adult (25 to 32 years old), young mid-age (39 to 41 years old), older mid-age (46 to 54 years old), and senior (58 to 63 years old). Since the Evo–Devo developmental labels are ordinal rather than metrically spaced, an ordinal trait (age rank) was constructed by assigning ranks from 1 to N along this sequence. Data quality was assessed using the WGCNA goodSamplesGenes criterion, with a minimum non-missing fraction of 0.30 [12]; only samples and genes passing quality control were retained.
2.3. Transcriptome-Wide Association with SLC13A5
Within the brain data set, transcriptome-wide association was performed across cerebrum samples, correlating SLC13A5 (Stable ID: ENSG00000141485) with each expressed gene by using Spearman rank correlation and pairwise handling of missingness. Genes present in at least 80% of samples were included in the correlation analysis. Transcriptome-wide developmental correlation screening used 22 developmental samples and 37,743 genes, yielding 830,346 sample × gene measurements in the analyzed expression matrix. Downstream enrichment analyses used this same set of 37,743 tested genes as the background universe, with a significant input set of 13,915 genes at FDR < 0.05. Two-sided P-values were adjusted for multiple testing using Benjamini–Hochberg false discovery rate (FDR). The full correlation landscape was summarized with a volcano-type display and a compact temporal heatmap of the top positively and negatively associated genes to visualize developmental coherence.
2.4. Weighted Gene Co-Expression Network Analysis (WGCNA)
A signed co-expression network was constructed from the brain matrix using biweight midcorrelation (bicor). The soft-thresholding power was chosen from the range of 1–20 as the first value, achieving a scale-free topology fit of R^2^ ≥ 0.80; when no value reached this criterion, a conservative default of 6 was used [13]. Modules were identified with blockwise hierarchical clustering using signed topology overlap, a minimum module size of 30 genes, a merge cut height of 0.25, zero reassignment threshold, and partitioning around medoids respecting the dendrogram [14]. For each module, the first principal component (module eigengene) was computed to summarize expression.
2.5. Module–Trait and Gene–Module Relationships
Associations between the SLC13A5 module eigengene (SME) and developmental progression were tested using Spearman correlation with the ordinal age group rank. The relationship between SME and SLC13A5 expression was assessed analogously. A partial Spearman association between SME and SLC13A5 controlling for age rank was obtained by correlating rank-based residuals from linear models. Intramodular connectivity (kME) was quantified as the signed correlation between each gene and its own module eigengene, providing a continuous measure of hubness.
2.6. Functional Enrichment
Functional enrichment for the SLC13A5 module was performed while keeping gene-identifier universes consistent with each analysis. Gene Ontology Biological Process testing used Ensembl IDs for both input and background (all genes passing network quality control), with FDR control by Benjamini–Hochberg [15]. KEGG analysis required mapping Ensembl to Entrez Gene identifiers; both the module and the background were mapped symmetrically with deduplication at the Entrez level prior to testing, and FDR was controlled analogously. Transcription factor target enrichment used MSigDB C3 TFT signatures retrieved via msigdbr [16], tested as over-representation on HUGO Gene Nomenclature Committee (HGNC) symbols with a matching symbol-level background. Enrichment results were summarized by −log10(FDR) and gene-ratio for the most significant terms.
2.7. Co-Expression Subnetwork Visualization
To illustrate intramodular organization, the 30 genes with the highest absolute kME within the SLC13A5 module were selected, with SLC13A5 forcibly included (if not originally among the top 30). Pairwise bicor values were computed within this set, and an undirected edge was drawn when the absolute correlation exceeded 0.60 [17]. The graph was laid out with a Fruchterman–Reingold force-directed algorithm using a fixed random seed for reproducibility. Node size and color encode |kME|, labels are shown for SLC13A5 and the highest-connectivity genes, and edges incident to SLC13A5 are highlighted to delineate its immediate neighborhood.
2.8. Statistical Considerations
Since expression distributions deviated substantially from normality, nonparametric measures, such as Spearman’s rho (ρ), were used throughout for association. All tests were two-sided, and multiplicity was controlled by Benjamini–Hochberg FDR unless otherwise stated. Random seeds were fixed where stochastic procedures were involved to ensure reproducibility of visual layouts and summaries. All analyses were performed using the R language (version 4.5.1) with IDE RStudio (version 2025.9.1.401). A reproducible script is provided as Supplementary Material.
3. Results
To determine SLC13A5 expression across tissues and how expression changes throughout development, we analyzed SLC13A5 expression using the human data from Cardoso-Moreira et al. (2019) [11]. Figure 1 shows the longitudinal view of SLC13A5 expression in different human tissues, namely cerebrum (Figure 1A), cerebellum (Figure 1B), liver (Figure 1C), kidney (Figure 1D), testis (Figure 1E), and ovaries (Figure 1F). Mean values for pre- and post-conception SLC13A5 expression (RPKM) by tissue are shown in Table 1 (raw data available in Supplementary Data S1).
In the cerebrum, SLC13A5 expression increases from ~0.5 RPKM at 19 wpc to ~4 RPKM in the first year of life. This is followed by a decrease in cerebrum SLC13A5 expression until adult life, when levels are kept above 1 RPKM for the following decades. In early stages of development, cerebellar SLC13A5 expression is less than 1 RPKM (0.3 ± 0.3 RPKM) but increases slowly and continuously throughout life (0.7 ± 0.3 RPKM). Liver is the tissue with the highest SLC13A5 expression. Following an initial drop during the fetal period until birth (from ~50 RPKM to ~20 RPKM), SLC13A5 expression increases and is kept high (~60 RPKM) until the end of adulthood. Other peripheral tissues (including kidney, ovaries, and testis) are also low throughout life.
We then assessed the genes whose expression co-varies with SLC13A5 across development in the human cerebrum transcriptome. A transcriptome-wide correlation scan across Evo-Devo cerebrum samples revealed extensive bidirectional associations with SLC13A5 expression (Figure 2A, Supplementary Data S2). It includes both positively and negatively correlated genes after multiple-testing correction. To examine whether these relationships are developmentally organized, we evaluated z-scored expression for the top SLC13A5-correlated genes across fetal-to-postnatal stages. The heat map shows temporal coherence, with many transcripts mirroring the fetal-to-postnatal shift observed for SLC13A5 (Figure 2B). Over-representation analyses of this set of genes flagged processes/pathways linked to mitochondrial energy metabolism (notably oxidative phosphorylation), RNA processing and surveillance (including spliceosome-related terms), and cell-cycle/chromatin regulation (Figure 2C,D).
Network construction of the human cerebrum yielded a scale-free-like topology at low double-digit soft thresholds, with the signed bicor fit approaching the conventional R2 = 0.8 plateau and remaining stable thereafter (Figure 3A). Using this parameter, WGCNA identified a heterogeneous module landscape with a few very large groups and many smaller ones (Figure 3B); the “grey” set aggregated unassigned genes, while the turquoise and blue modules comprised the largest structured clusters. The hierarchical dendrogram revealed block structure (Figure 3C). The aligned annotation tracks (Figure 3D) showed that SLC13A5 is found in the turquoise module, where genes with the strongest gene significance to SLC13A5 (red in GS track) spatially co-localize with high intramodular connectivity (deep red in |kME| track).
The SLC13A5 module’s eigengene tracked cerebrum maturation and the gene’s own expression (Figure 4). Across fetal-to-postnatal stages, the eigengene rose in accordance with developmental rank (Spearman rho = 0.802, p = 8.62 × 10^−6^; Figure 4A), indicating that the turquoise module is progressively activated during human cerebrum development. The eigengene was also tightly correlated with SLC13A5 expression itself (rho = 0.884, p = 2.73 × 10^−6^; Figure 4B), consistent with SLC13A5 being embedded within, and representative of, the module. Importantly, this association persisted after regressing out age effects: A partial correlation between the eigengene and SLC13A5 (controlling for developmental rank) remained significant (rho = 0.672, p = 6.17 × 10^−4^; Figure 4C).
To visualize the local wiring of the SLC13A5 module, a force-directed subnetwork composed of the top 30 module members was plotted (ranked by |kME|); edges represent robust pairwise co-expression (|bicor| > 0.6) (Figure 5). The layout reveals a compact nucleus of highly interconnected genes with high module cohesion, flanked by a few peripheral nodes with weaker within-module connectivity. SLC13A5 sits adjacent to the core and forms numerous strong links to neuronal and mitochondrial/transport genes (including CYP46A1, ITM2B, NRGN, GABRD, FBXO2, CHCHD10, CYSTM1, MFSD4A, CORO6, and LYNX1), consistent with the functional enrichments for oxidative metabolism, RNA/protein homeostasis, and synaptic programs. In contrast, nodes such as ABCC3, CRACDL, and TUBA4A occupy a more peripheral position with fewer edges, indicating lower intramodular connectivity.
Gene set enrichment of the SLC13A5-containing module revealed a coherent, mitochondria-centered program (Figure 6). In GO Biological Process (Figure 6A), top terms were related to mitochondrial metabolism, including ‘aerobic electron transport chain’, ‘respiratory electron transport chain’, ‘ATP synthesis coupled electron transport’, and ‘mitochondrial ATP synthesis coupled electron transport’. Other terms also revealed involvement with inflammation and purine metabolism. KEGG analysis (Figure 6B) showed a significant enrichment for ‘oxidative phosphorylation’ and pathways involved in neurodegenerative and inflammatory diseases. Transcription factor target enrichment (MSigDB C3 TFT; Figure 6C) highlighted regulators consistent with these themes, including NFE2/NRF-like motifs, TFAM-associated genes, and AP-1 family targets (multiple AP1 motif sets), as well as ELF1/BACH2 target sets.
4. Discussion
SLC13A5 plays a key role in citrate metabolism, impacting hepatic lipogenesis, cell proliferation, bone development, and epilepsy in mammals [18]. Loss-of-function mutations in the SLC13A5 gene have been associated with SLC13A5 epilepsy [19]. On the other hand, overexpression of Slc13a5 in neurons from mouse forebrain has been linked to disrupted white matter integrity and autistic-like behaviors [20]. Slc13a5 overexpression also causes progeria-like phenotype, systemic inflammation, and alterations in protein acetylation [21]. Thus, SLC13A5 may present different roles/importance across the lifespan.
The physiological pattern of SLC13A5 expression across life in human tissues has not been described yet. We therefore used a dataset of human tissues from Moreira and colleagues (2019) [11] to start addressing this issue. Liver was the tissue with the highest SLC13A5 mRNA expression at all timepoints investigated. Previous reports showed SLC13A5 expression to be much higher in liver than in brain (for both humans and rats) [22,23]. In cerebrum, SLC13A5 mRNA expression increased from conception until infancy, when it reached its peak. An increase in Slc13a5 mRNA expression during early postnatal life was also shown in rat cerebral cortex [24]. Cerebellar expression of SLC13A5 steadily increased throughout life. Slc13a5-knockout mice show distinct metabolic pathways disrupted depending on the tissue investigated [25]. Thus, the distinct patterns of SLC13A5 mRNA expression reported here may cooperate with the different roles played by SLC13A5 in the metabolism of these tissues.
We then assessed expression data of all cerebrum genes in the Evo-Devo database and ran multiple Spearman correlation analyses against the longitudinal expression of SLC13A5. We found sets of genes with strong correlation (positive or negative) and time coherence appropriateness with SLC13A5 expression. Analysis of gene ontology and KEGG pathways indicates that SLC13A5 sits in a developmentally coherent gene neighborhood enriched for mitochondrial bioenergetics and gene regulatory pathways in the human cerebrum. Genes related to transcription, translation, and synthesis of proteins are critical during neurodevelopment, and dysfunction of these genes may cause reduced brain volume, developmental delay, cognitive deficits, alterations in neural cristae, and neuronal alteration [26,27,28,29]. Additionally, the tuning of bioenergetic metabolism is crucial during neurodevelopment. Shifts in bioenergetics control cell fate, as well as neural progenitor proliferation and differentiation [30].
In order to evaluate the network hierarchy, we performed a weighted gene co-expression network analysis and evaluated the intramodular connectivity. The results of WGCNA validated the chosen network parameters, delineated the global co-expression architecture of the developing brain, and defined a densely connected SLC13A5-centered module for downstream analyses. The analyses of association between SLC13A5, the eigengene, and the developmental rank indicated that the module captures a coordinated expression program that matches developmental progression and specifically co-varies with SLC13A5 (regardless of the global age trajectory).
The analysis of |kME| within the SLC13A5 module suggested that SLC13A5 is embedded in a densely connected module. It is directly connected to genes involved in neuronal homeostasis (synaptic signaling and structural proteins), mitochondrial organization, and lipid/cholesterol turnover. It is feasible that SLC13A5 plays a role in the cooperation between brain and liver for citrate homeostasis, maintaining lipid balance throughout the body (including basic and complex lipids) [25]. We also observed the presence of genes important for calcium handling (e.g., NRGN and TESC) [31,32,33] for cell signaling, metabolism, and fate (e.g., CYP46A1, LDHD, CA4, CA11, RGS4, CHCHD10, AIFM3, and TAMALIN) [34,35,36,37,38,39,40], as well as cell structure and extracellular matrix (e.g., COL5A3, ICAM5, TUBA4A, and CORO6) [41,42,43,44]. Interestingly, GABRD was found to be directly connected to SLC13A5 in the module. GABRD is a gene that encodes GABA_A_ subunit, an important receptor during neurodevelopment and for epilepsy [45]. SLC13A5 was also directly connected to LYNX1, a gene encoding a protein that modulates nAChR. Alterations in nAChR are associated with some epilepsies [46]. LYNX1 dysregulation was reported in Fragile X Syndrome, a condition characterized by epilepsy [47], and in neurodevelopmental disorders [48]. Additionally, knockout of Lynx1 in animal models enhances synaptic efficacy and performance in memory tests. However, it induces neurodegeneration by the hyperactivation of nAChR [49].
The functional programs enriched in the SLC13A5 module were then analyzed. GO Biological Process enrichment analysis indicated that the SLC13A5 module is embedded in a developmental program with genes involved in mitochondrial energy metabolism, reflecting a transcriptional coordination between mitochondrial homeostasis and SLC13A5. KEGG analysis showed an enrichment in pathways associated with neurodegenerative disease (Parkinson’s, Alzheimer’s, Huntington’s disease) and metabolic and inflammatory diseases (type I diabetes, non-alcoholic fatty liver disease, rheumatoid arthritis). Interestingly, SLC13A5 inhibition has also been suggested as a potential therapeutic target for kidney disease [50], hyperlipidemia [51], non-alcoholic fatty liver disease, insulin resistance, and a myriad of metabolic diseases [10,52,53,54]. The underlying mechanisms may involve decreasing citrate uptake from blood and reducing intracellular levels of citrate in the liver [55]. The enriched transcription-factor targets include factors such as NFE2, TFAM, and members of the AP-1 family (API, AP1F), implicated in the regulation of mitochondrial biogenesis, stress response, and cell differentiation [42,56,57,58]. The presence of TFAM, a key regulator of mitochondrial transcription, is particularly relevant. Altogether, the data suggest that this module may represent a regulatory axis relevant to physiological and pathophysiological conditions involving mitochondria.
It is important to emphasize that our analyses rely on transcriptomic data quantified as RPKM, which does not always correlate directly with protein abundance or functional activity. In fact, mRNA levels explain only about 40% of the variability in protein abundance across human tissues, highlighting the inherent constraints of using transcriptomic data alone to infer protein expression or biological function [59,60]. Therefore, protein abundance and localization must be addressed with orthogonal data. Moreover, potential confounders such as age-dependent changes in cell type composition, inter-donor variability, sex, and technical artifacts were not systematically addressed in this study. These factors may influence both transcript and protein measurements and should be considered when interpreting the data. While our analyses focus on within-series co-variation and use rank-based associations with matched testing universes to mitigate some sources of bias, we cannot exclude the possibility that part of the reported pathway enrichment and co-expression structure is influenced by these factors.
5. Conclusions
SLC13A5 is highly expressed in the brain in the first years of life, suggesting an important role in this period of life and coinciding with the onset of seizures in SLC13A5 epilepsy patients. Potential targets of metabolic interplay with SLC13A5 include mitochondria, neurotransmission-related genes, and lipid metabolism. These findings deepen our understanding of the SLC13A5 expression patterns and highlight its potential significance in cellular metabolism and disease pathogenesis. Continued investigation into the molecular mechanisms underlying SLC13A5 regulation and its functional implications in health and disease will be essential for unraveling its full biological significance and therapeutic potential. For instance, a better understanding of the mechanisms behind age- and tissue-specific SLC13A5 transcription would help identify targeted therapeutics for SLC13A5 epilepsy and other metabolic disorders with altered citrate homeostasis. Future studies should also investigate neurotransmitter changes after loss of SLC13A5 to elucidate the functional role of SLC13A5 in neurotransmission.
The reference list from the paper itself. Each links out to its DOI / PubMed record.
- 1Matricardi S. De Liso P. Freri E. Costa P. Castellotti B. Magri S. Gellera C. Granata T. Musante L. Lesca G. Neonatal Developmental and Epileptic Encephalopathy Due to Autosomal Recessive Variants in SLC 13A 5 Gene Epilepsia 2020612474248510.1111/epi.1669933063863 · doi ↗ · pubmed ↗
- 2Spelbrink E.M. Brown T.L. Brimble E. Blanco K.A. Nye K.L. Porter B.E. Characterizing a Rare Neurogenetic Disease, SLC 13A 5 Citrate Transporter Disorder, Utilizing Clinical Data in a Cloud-Based Medical Record Collection System Front. Genet.202314110954710.3389/fgene.2023.110954737025451 PMC 10072280 · doi ↗ · pubmed ↗
- 3Hardies K. de Kovel C.G.F. Weckhuysen S. Asselbergh B. Geuens T. Deconinck T. Azmi A. May P. Brilstra E. Becker F. Recessive Mutations in SLC 13A 5 Result in a Loss of Citrate Transport and Cause Neonatal Epilepsy, Developmental Delay and Teeth Hypoplasia Brain 20151383238325010.1093/brain/awv 26326384929 · doi ↗ · pubmed ↗
- 4Brown T.L. Bainbridge M.N. Zahn G. Nye K.L. Porter B.E. The Growing Research Toolbox for SLC 13A 5 Citrate Transporter Disorder: A Rare Disease with Animal Models, Cell Lines, an Ongoing Natural History Study and an Engaged Patient Advocacy Organization Ther. Adv. Rare Dis.2024511510.1177/2633004024126397239091896 PMC 11292725 · doi ↗ · pubmed ↗
- 5Goodspeed K. Liu J.S. Nye K.L. Prasad S. Sadhu C. Tavakkoli F. Bilder D.A. Minassian B.A. Bailey R.M. SLC 13A 5 Deficiency Disorder: From Genetics to Gene Therapy Genes 202213165510.3390/genes 1309165536140822 PMC 9498415 · doi ↗ · pubmed ↗
- 6Klotz J. Porter B.E. Colas C. Schlessinger A. Pajor A.M. Mutations in the Na+/Citrate Cotransporter Na CT (SLC 13A 5) in Pediatric Patients with Epilepsy and Developmental Delay Mol. Med.20162231032110.2119/molmed.2016.0007727261973 PMC 5023510 · doi ↗ · pubmed ↗
- 7Wang W.-A. Ferrada E. Klimek C. Osthushenrich T. Mac Namara A. Wiedmer T. Superti-Furga G. Large-Scale Experimental Assessment of Variant Effects on the Structure and Function of the Citrate Transporter SLC 13A 5Sci. Adv.202511 eadx 301110.1126/sciadv.adx 301140577459 PMC 12204159 · doi ↗ · pubmed ↗
- 8Henke C. Töllner K. van Dijk R.M. Miljanovic N. Cordes T. Twele F. Bröer S. Ziesak V. Rohde M. Hauck S.M. Disruption of the Sodium-Dependent Citrate Transporter SLC 13A 5 in Mice Causes Alterations in Brain Citrate Levels and Neuronal Network Excitability in the Hippocampus Neurobiol. Dis.202014310501810.1016/j.nbd.2020.10501832682952 · doi ↗ · pubmed ↗