Mitogenomic Phylogeny and Adaptive Evolution of Snailfishes (Liparidae) Reveal Correlation Between tRNA Rearrangements and Deep-Sea Colonization
Ruxiang Wang, Ang Li, Shuai Che, Huan Wang, Shufang Liu

TL;DR
This study shows that snailfishes' mitochondrial gene rearrangements are linked to their deep-sea adaptation, offering new insights into marine fish evolution.
Contribution
The paper identifies a correlation between tRNA gene rearrangements and deep-sea colonization in snailfishes.
Findings
Shallow-water snailfishes have a different tRNA gene order compared to deep-water species.
tRNA rearrangements in deep-water snailfishes may result from duplication and gene loss events.
L. tanakae shows structural divergence in tRNA secondary structures with non-canonical base pairs.
Abstract
We sequenced and analyzed the complete mitochondrial genomes of two snailfish species, Liparis chefuensis and Liparis tanakae, from the Yellow Sea. Our study reveals that these fishes show unique rearrangements in their mitochondrial tRNA genes, which are closely linked to their habitat depths. Shallow-water species exhibit one gene order, while deep-water species show a different arrangement. This suggests that changes in mitochondrial gene organization may help these fishes adapt to extreme deep-sea environments. Our findings provide valuable genetic data for snailfish identification and deepen our understanding of how marine organisms evolve to survive in the deep ocean. The snailfish family (Liparidae) represents one of the most rapidly speciating and ecologically diverse lineages of marine fishes, with species distributed across a broad bathymetric range from intertidal zones to…
Genes, proteins, chemicals, diseases, species, mutations and cell lines named across the full text — each resolved to its canonical identifier and authoritative record.
Click any figure to enlarge with its caption.
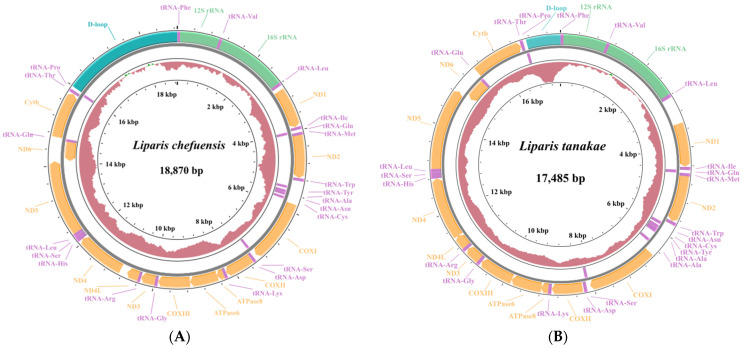 Figure 1
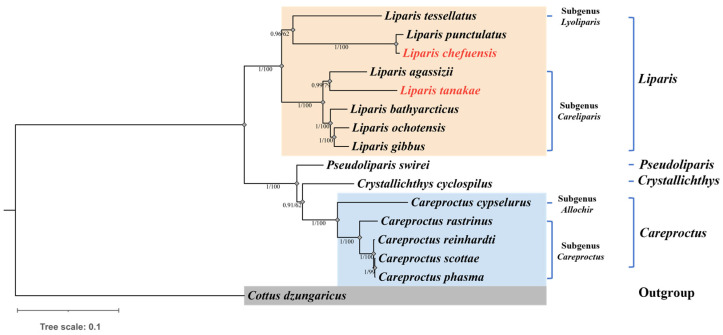 Figure 2
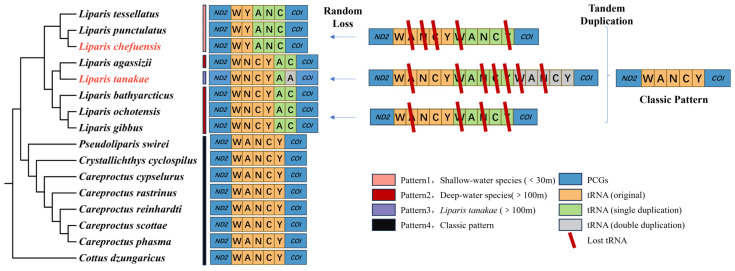 Figure 3
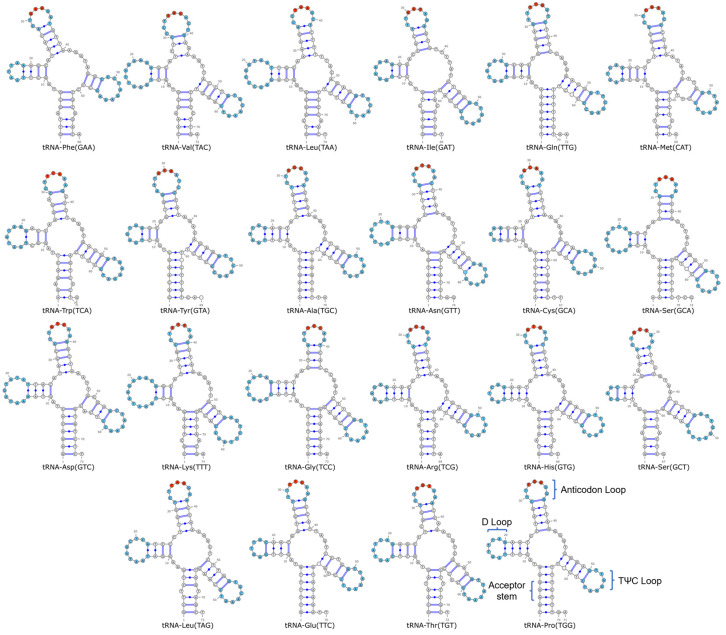 Figure 4
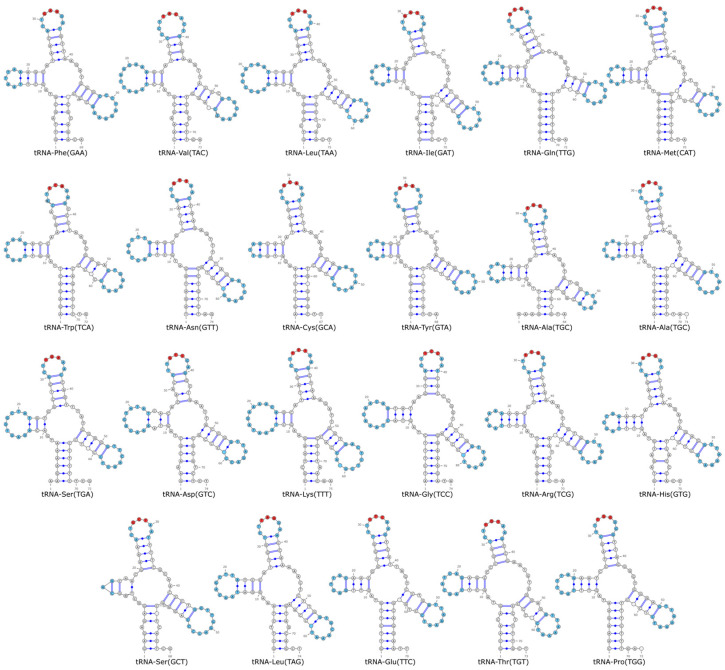 Figure 5
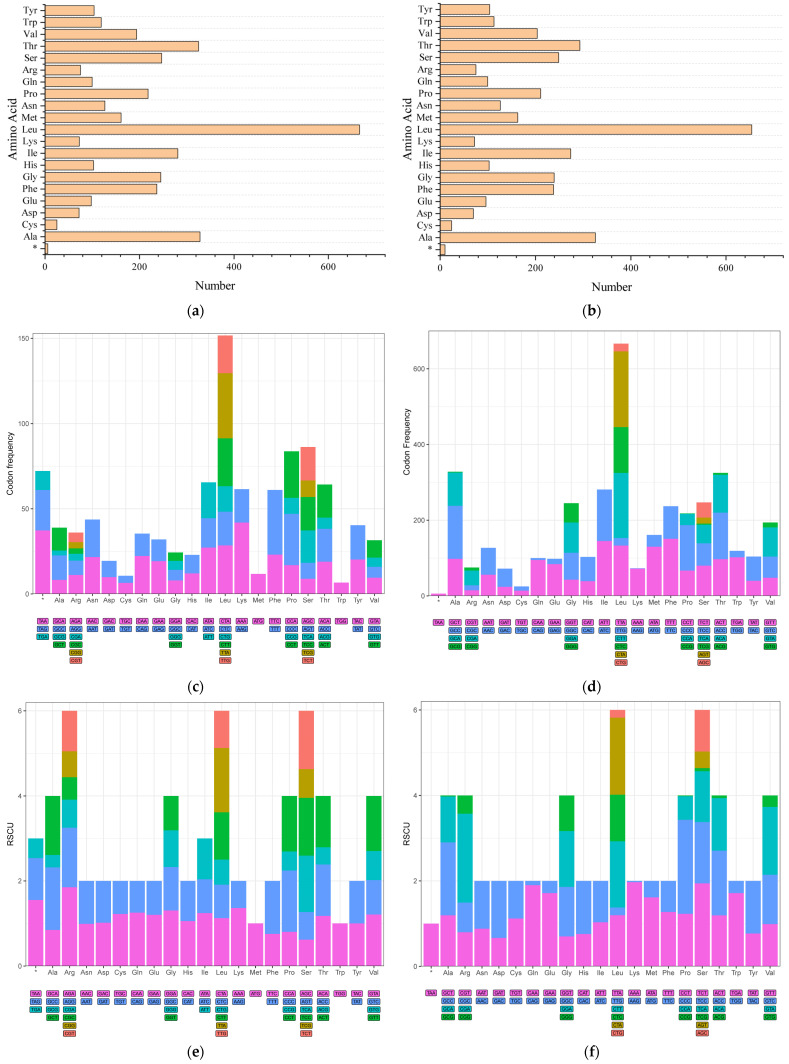 Figure 6
- —the National Key R&D Program of China
- —Qingdao Science and Technology Benefiting the People Demonstration Project
- —the Central Public-interest Scientific Institution Basal Research Fund, YSFRI, CAFS
Peer Reviews
No public reviews on file for this paper yet. If you reviewed it on a platform where reviews are public (OpenReview, ICLR, NeurIPS, ICML), you can paste yours below so the community can read it here.
Videos
No videos yet. Explain this paper in a talk, walkthrough, or lecture? Add one.
Taxonomy
TopicsGenomics and Phylogenetic Studies · Ichthyology and Marine Biology · Genetic diversity and population structure
1. Introduction
The typical vertebrate mitochondrial DNA (mtDNA) is a double-stranded, circular molecule, 15–20 kb in length, usually containing 13 protein-coding genes (PCGs), 2 rRNA genes, 22 tRNA genes, and 2 main non-coding regions: the control region (D-loop) and the origin of light-strand replication (O_L_) [1]. Fish mitochondrial genomes are generally highly conserved in structure, particularly in gene order, which is a key reason for the widespread use of mtDNA as a molecular marker in fish systematics (e.g., for population identification, phylogeography, evolution, and phylogenetic reconstruction) [2,3,4,5]. While advancements in sequencing technology and the expansion of genomic databases have led to increased reporting of mitochondrial gene rearrangements in fishes [6,7], these events remain relatively rare across the group. Although such rearrangements have now been documented in at least 34 teleost families, they collectively represent a small proportion of known species diversity and are often concentrated within specific evolutionary lineages, such as the order Anguilliformes, Notothenioidei and the genus Parupeneus [7,8,9,10]. Mitochondrial gene rearrangements can harbor significant phylogenetic information, as demonstrated in numerous terrestrial vertebrates [11,12,13,14]. In contrast, reported cases in teleost fish remain limited and taxonomically restricted; consequently, studies utilizing gene rearrangements to investigate fish systematics and evolution are still relatively rare.
Mitochondria are central to cellular energy metabolism, producing ATP via the electron transport chain—a process dependent on all 13 protein-coding genes encoded in the mitochondrial DNA (mtDNA) [15]. Functional constraints on these mtDNA genes have been shown to influence adaptation across diverse environments, including those related to locomotion, climate, and elevation [16,17,18]. Of particular relevance to deep-sea colonization, the extreme conditions of high hydrostatic pressure, low temperature, and often limited oxygen availability impose strong selective pressures on energy metabolism [19]. Consequently, adaptive evolution in mitochondrial function has been considered as a key mechanism enabling survival in the deep sea, highlighting the critical link between mtDNA evolution and adaptation to abyssal environments [15].
The snailfish family (Liparidae; Teleostei: Scorpaeniformes: Cottoidei) exhibits extremely high species diversity, comprising 32 genera and over 520 species, making it one of the most rapidly speciating lineages of marine fishes [20,21,22]. Snailfishes are globally distributed, inhabiting depths from the intertidal to the hadal zone in temperate and cold regions, primarily concentrated in the North Pacific, North Atlantic, and polar seas. They are also found in deep-sea bottoms of tropical and subtropical regions near the equator [23,24,25,26]. The two most diverse genera, Careproctus and Paraliparis, are distributed in both Hemispheres, while the genus Liparis is restricted to the Northern Hemisphere [26]. North Pacific waters, particularly near Alaska, harbor an extraordinary diversity of Liparidae, with over 85 species described or known but awaiting formal description [27,28,29]. The discovery and description of new species and new geographic records are ongoing [30,31,32,33,34,35]. However, due to high morphological similarity, phenotypic plasticity, rapid evolutionary rates, broad distributions, and difficulties in obtaining deep-sea samples, taxonomic research on Liparidae has progressed slowly, and the phylogenetic relationships of many species remain controversial [26].
Currently, complete mitochondrial genome data are publicly available for only 13 liparid species [36,37,38], representing merely 2.5% of the family’s diversity, indicating a significant data gap. Liparis chefuensis and Liparis tanakae both belong to the genus Liparis. The former is endemic to the Yellow Sea residing in areas shallower than 30 m [39], while the latter is the only dominant liparid species in Chinese waters residing around 100–121 m [40], making both significant for regional biodiversity studies. However, the lack of complete and accurate mitochondrial genome sequences for these species has impeded phylogenetic and evolutionary studies of Liparidae. Therefore, it is necessary to sequence and analyze their complete mitochondrial genomes to supplement and improve the family’s genomic database.
In summary, this study aims to:
- Sequence, assemble, and annotate the complete mitochondrial genomes of L. chefuensis and L. tanakae, analyzing their structural characteristics (base composition, codon usage bias, tRNA structure);
- Construct phylogenetic trees based on mitochondrial PCGs from 15 Liparidae species to clarify their evolutionary relationships;
- Investigate tRNA rearrangement in the mitochondrial genomes of the genus Liparis, explore their association with phylogeny and habitat depth, and analyze potential formation mechanisms and functional impacts.
Our results provide essential data for the biological research of L. chefuensis and L. tanakae, re-examine liparid phylogenetic relationships, and offer new insights into the deep-sea adaptation mechanisms within the family.
2. Materials and Methods
2.1. Sample Collection, DNA Extraction, and Quality Assessment
Liparis chefuensis was collected from the intertidal zone of the Yellow River Estuary in July 2022 at a depth of 4 m and Liparis tanakae was collected during an autumn survey cruise in the Yellow Sea in September 2021 at a depth of about 110 m. Due to logistical constraints during the research cruise, samples were temporarily stored at −20 °C for the 5–7 day transit period. Upon return, muscle tissue was immediately dissected for DNA extraction.
Genomic DNA was extracted using a TIANamp Marine Animal DNA Kit (Tiangen, Beijing, China). DNA integrity and quality were assessed by 1% agarose gel electrophoresis, and concentration was detected using a Nano-300 nano spectrophotometer (Allsheng, Hangzhou, China).
2.2. Library Construction, Sequencing, and Data Filtering
Libraries were constructed and sequenced on the DNBSEQ platform (MGI, Shenzhen, China). Briefly, DNA was sheared by ultrasonication into 300–400 bp fragments, end-repaired, and ligated to adapters. Following PCR amplification and circularization of the products, libraries were sequenced. Library construction and sequencing were performed by the BGI Genomics Co., Ltd. (Shenzhen, China).
Raw sequencing data with about 45X average depth were processed with SOAPnuke (v1.5.3) [41] to remove adapter sequences, reads shorter than 150 bp, reads with polyX length exceeding 50 bp, reads with N content exceeding 1%, and other low-quality reads, yielding clean data for subsequent assembly.
2.3. Mitochondrial Genome Assembly and Annotation
De novo assembly of the mitochondrial genome was performed using Novoplasty (v4.3.5) [42], with K-mer set to 33 and using the mitochondrial COI gene sequence of L. chefuensis and L. tanakae as a seed (a common choice given its high conservation and utility for anchoring vertebrate mitogenome assemblies). Annotation and visualization of the mitochondrial genome were conducted on MitoFish (v2025.06) [43] using the vertebrate mitochondrial genetic code.
MEGA X (v10.2) [44] was used for base composition statistics and base bias calculation, where GC-skew = (G − C)/(G + C) and AT-skew = (A − T)/(A + T). EMBOSS (v6.6.0) [45] was used for codon usage bias analysis of the whole genome, tRNAs, rRNAs, the control region, and protein-coding genes.
MITOS2 (v2.1.10) [46] was used for annotation and secondary structure prediction of mitochondrial tRNAs, and visualization was performed using VARNA (v3-93) [47].
2.4. Phylogenetic Analysis
Complete mitochondrial genome sequences and annotation files for 13 additional Liparidae species were downloaded from NCBI (Table 1). To ensure consistent and accurate annotation, all downloaded sequences were re-annotated using MitoFish (v2025.06) [43] with the vertebrate mitochondrial genetic code and compared against the original annotations. The 13 PCG sequences for each species were extracted, stop codons were removed, and the genes were concatenated per species to create a dataset for phylogenetic analysis. MAFFT (v7.487) [48] was used for sequence alignment of the concatenated PCGs dataset. IQ-Tree (v2.4.0) [49] was used to construct the ML tree with a codon position partition scheme, automatically selecting the best-fit evolutionary model (GTR + F + I + G4), with parameters -bb 1000 and -alrt 1000 for 1000 ultrafast bootstrap replicates to assess branch support and SH-like aLRT test for branch reliability, respectively. PAUP* (v4.0a169) and MrModeltest2 (v.2.4) were used to find the best model for BI analysis. MrBayes (v3.2.7a) [50] was used to construct the BI tree under the best model GTR + I + G, running 2 independent MCMC chains for 107 generations, sampling every 1000 generations, discarding the first 25% as burn-in, ensuring the average standard deviation of split frequencies was <0.01. Cottus dzungaricus was selected as the outgroup, that belongs to the suborder Cottoidei, and includes the family Liparidae.
3. Results
3.1. Mitochondrial Genome Sequencing and Assembly
Sequencing of L. chefuensis yielded 40,080,591 clean reads, with a Q20 of 97.92%. The final assembled mitochondrial genome was 18,870 bp in length (GenBank accession: PX718959), containing 37 genes: 13 PCGs, 22 tRNA genes, 2 rRNA genes (12S rRNA and 16S rRNA), and 2 main non-coding regions (D-loop and O_L_) (Figure 1A).
Sequencing of L. tanakae yielded 48,034,225 clean reads, with a Q20 of 98.18%. The final assembled mitochondrial genome was 17,485 bp in length (GenBank accession: PX718960), containing 38 genes: 13 PCGs, 23 tRNA genes, 2 rRNA genes, and 2 main non-coding regions. Compared to the typical vertebrate mitochondrial genome, it possesses one extra tRNA gene, which is a novel structural feature (Figure 1B).
3.2. Phylogenetic Analysis
The ML and BI trees based on 13 PCGs from 15 Liparidae species showed congruent topologies (Figure 2). Species of the genus Liparis formed a monophyletic clade, while species of Pseudoliparis, Crystallichthys, and Careproctus together formed a sister clade. Within the Liparis clade, the subgenus Lyoliparis (represented by L. tessellatus) clustered with L. punctulatus and L. chefuensis, while species of the subgenus Careliparis formed a distinct cluster.
Although some internal nodes received moderate support (Bootstrap < 95%, Posterior Probability < 0.95), the consistent topology between ML and BI analyses suggests the current subgeneric classification of L. chefuensis may require re-evaluation.
3.3. Mitochondrial Genome Structure Comparison and tRNA Rearrangement
Comparative analysis revealed tRNA gene rearrangements in the tRNA gene cluster region between ND2 and COI in all eight studied Liparis species, displaying three distinct patterns (Figure 3):
- Pattern 1 (Pink branch): Found in shallow-water species (<30 m: L. chefuensis, L. punctulatus, L. tessellatus), with the order tRNA^Trp^-tRNA^Tyr^-tRNA^Ala^-tRNA^Asn^-tRNA^Cys^ (WYANC);
- Pattern 2 (Red branch): Found in deep-water Careliparis species (>100 m: L. agassizii, L. bathyarcticus, L. ochotensis, L. gibbus), with the order tRNA^Trp^-tRNA^Asn^-tRNA^Cys^-tRNA^Tyr^-tRNA^Ala^-tRNA^Cys^ (WNCYAC);
- Pattern 3 (Purple branch): Unique to the deep-water Careliparis species L. tanakae (100–121 m), with the order tRNA^Trp^-tRNA^Asn^-tRNA^Cys^-tRNA^Tyr^-tRNA^Ala^-tRNA^Ala^ (WNCYAA);
- Typical Pattern (Black branch): Genera outside Liparis (Pseudoliparis, Crystallichthys, Careproctus) retained the classic vertebrate tRNA^Trp^-tRNA^Ala^-tRNA^Asn^-tRNA^Cys^-tRNA^Tyr^ (WANCY) arrangement.
Based on the Tandem Duplication and Random Loss (TDRL) model, these patterns can be plausibly explained (Figure 3): The ancestral WANCY cluster likely underwent one or two tandem duplications, followed by random loss of specific genes, giving rise to the observed arrangements. For instance, Pattern 1 could arise from a single duplication followed by loss of the ANC, W, and Y copies. Pattern 2 might result from a single duplication with loss of A, W, N, and Y copies. The complex Pattern 3 in L. tanakae may require two duplications followed by loss of A, W, NCYW, and NCY copies.
3.4. tRNA Structure Analysis
The 22 tRNAs of L. chefuensis had a total length of 1549 bp (66–74 bp per tRNA) and exhibited typical cloverleaf secondary structure (Figure 4). Non-Watson-Crick pairs included 29 G-U and 9 A-C pairs.
The 23 tRNAs of L. tanakae had a total length of 1612 bp (63–74 bp per tRNA) and also formed typical cloverleaf structures (Figure 5). Notably, they contained significantly more non-standard pairs: 44 G-U and 25 A-C pairs.
3.5. General Mitochondrial Genome Features
Detailed structural features and nucleotide composition for L. chefuensis and L. tanakae are provided in Table 2, Table 3, Table 4 and Table 5. Both genomes showed negative GC-skew and positive AT-skew, and an A + T content higher than G + C content, consistent with typical vertebrate mitochondrial genomes.
3.6. Codon Usage Bias
Except for COXI (start GTG), all PCGs in both species used ATG as the start codon. Stop codon usage varied, with incomplete stop codons (T- or TA-) likely completed to TAA via polyadenylation [51].
Relative Synonymous Codon Usage (RSCU) analysis indicated a preference for A/T-ending codons and an avoidance of G/C-ending codons in both species (Figure 6). Leucine, Alanine, and Threonine were the most abundant amino acids.
4. Discussion
4.1. Phylogenetic Relationships and Taxonomic Implications
Our phylogenetic analysis provides new insights into liparid systematics. The distinct clustering of Liparis species separate from Pseudoliparis, Crystallichthys, and Careproctus is consistent with some previous studies using COI, RAD-seq, or morphology [18,52,53,54,55]. However, our results place L. chefuensis within the Lyoliparis clade, contradicting its previous classification in Careliparis [26]. This discrepancy may stem from past misidentification, potentially due to the sympatric distribution and morphological similarity between L. chefuensis and L. tanakae in the Yellow Sea. Morphometric data support this reclassification: the fin ray counts of L. chefuensis (dorsal 36–38, anal 29–31, pectoral 34–36 [40]) differ significantly from the characteristics ranges of Careliparis (dorsal 39–48, anal 31–37, pectoral 35–46 [55]) and do not fully align with Lyoliparis either. Therefore, the subgeneric placement of L. chefuensis warrants further investigation using additional molecular markers (e.g., nuclear genes) and detailed morphological re-examination.
4.2. tRNA Gene Rearrangements: A Putative Adaptive Innovation
While mitochondrial gene order is generally conserved in fishes, rearrangements are increasingly being documented, often in specific clusters like the one between ND2 and COI [4,10,12,13,56,57,58,59,60,61,62,63]. We identified a novel and phylogenetically correlated rearrangement of the WANCY tRNA cluster in Liparis. We hypothesize that the shift from the WYANC pattern observed in shallow-water species to the WNCYAC pattern found in deep-water species represents an important genomic innovation potentially link to adaptation to the deep-sea environment.
4.2.1. Phylogenetic Signal of Rearrangements
Mitochondrial gene rearrangements often contain phylogenetic information. The rearrangement patterns are highly consistent with the phylogenetic relationships within the genus Liparis: the subgenus Lyoliparis and its closely related species branch exhibit the WYANC arrangement, the subgenus Careliparis exhibits the WNCYA + A/C arrangement, while the three genera Pseudoliparis, Crystallichthys, and Careproctus conform to the typical vertebrate WANCY arrangement. Both the rearrangement pattern and the PCGs phylogenetic tree demonstrate the close relationship between L. chefuensis and the subgenus Lyoliparis, correcting the previous taxonomic placement within the subgenus Careliparis.
The perfect congruence between rearrangement patterns and the major phylogenetic clades within Liparis underscores the utility of mitochondrial gene order as a phylogenetic marker. The shared derived state (WNCYAC) unites the deep-water Careliparis species, while the distinct state (WYANC) characterizes the shallow-water clade. This provides independent evidence for the reclassification of L. chefuensis. However, caution is needed, as convergent rearrangements can occur [64], and more data from related taxa are essential.
4.2.2. Correlation with Habitat Depth and Putative Function
The biological function and significance of mitochondrial gene rearrangement phenomena remain unclear but may be related to the action of natural selection in specific habitats [12,52]. The gene rearrangement phenomenon in the genus Liparis might provide insights for related research: The genus Liparis is generally considered to comprise shallow-water fishes, but different subgenera exhibit significant differences in habitat depth: the subgenus Liparis (e.g., L. montagui and L. liparis [65]) are mostly distributed in shallow waters from 0–100 m [52]; whereas the subgenus Careliparis species tend towards deep-sea life, with most distributed in the mesopelagic zone at 400–800 m (e.g., L. bathyarcticus primarily inhabits 400–647 m [55], L. ochotensis has a depth limit of 761 m [66], L. gibbus has a depth limit of 647 m [39]), and a few in the 100–400 m transition zone (e.g., L. agassizii and L. tanakae have depth limits around 100–121 m [39]). These deep-water Careliparis species exhibit the derived WNCYAC rearrangement pattern. Conversely, species inhabiting depths shallower than 30 m (e.g., the subgenus Lyoliparis species L. tessellatus, L. punctulatus [39], and L. chefuensis [40]) all possess the WYANC arrangement.
Thus, we can see that, the correlation between rearrangement patterns and habitat depth is striking. Deep-sea conditions (high pressure, low temperature, hypoxia, low energy) impose extreme demands on energy metabolism. Mitochondria, as cellular power plants, are central to meeting these demands. We hypothesize that the derived gene arrangements (WNCYAC, WNCYAA) in deep-water Liparis species may confer a putative selective advantage by optimizing mitochondrial function. This optimization could occur through increased transcriptional efficiency, enhanced RNA stability, or altered interactions with nuclear-encoded factors, ultimately boosting energy production under extreme conditions. It is crucial to note that this correlation, while compelling, does not establish causality. The proposed adaptive significance of the tRNA rearrangements remains a hypothesis requiring functional validation.
4.2.3. The Unique Case of Liparis tanakae
According to the TDRL model, the formation process of the gene rearrangement in L. tanakae is species specific: compared to gene rearrangements in other Liparidae species, L. tanakae might have undergone one additional gene cluster duplication, resulting in the unique WNCYAA rearrangement pattern. This might be related to its unique adaptation to the Yellow Sea environment, making it the only dominant species of Liparidae in the Yellow Sea region.
Furthermore, the tRNA secondary structures of L. chefuensis contained 29 G-U pairs and 9 A-C non-standard pairs. L. tanakae had even more, with 44 G-U pairs and 25 A-C pairs. Although G-U pairs are non-standard, their stability is higher than other non-Watson-Crick pairs and they might represent intermediate states of compensatory mutations, playing an important role in maintaining RNA structure and function [55,56]. The elevated number of non-standard pairs in the tRNAs of L. tanakae suggests that its mitochondrial tRNAs have undergone notable structural changes during evolution. Such structural changes could potentially influence tRNA stability and might thereby contribute to adaptive capacity in complex marine environments.
This unique genomic structure, coupled with its exceptionally high number of tRNA non-standard base pairs (which may affect stability and function), might reflect a specialized or transitional adaptive state.
A limitation of this study is the lack of data from the nominal subgenus Liparis, typically comprising shallow-water species. Obtaining their mitochondrial genomes is crucial for robustly testing the hypothesis that WYANC is the ancestral shallow-water state.
5. Conclusions
We present the first complete mitochondrial genomes for Liparis chefuensis and Liparis tanakae. Phylogenomic analysis supports the reassignment of L. chefuensis to the subgenus Lyoliparis. Most significantly, we discovered phylogenetically correlated tRNA gene rearrangements within Liparis that are strongly associated with habitat depth. We propose the hypothesis that these rearrangements are not merely neutral markers but may represent genomic adaptations that enhance mitochondrial function, may facilitate the colonization of the deep sea.
This study provides fundamental genetic resources for snailfish research and opens new avenues for investigating the role of mitogenomic architecture in extreme environment adaptation. Future work should focus on: (1) Filling taxonomic gaps, especially sequencing the subgenus Liparis; (2) Broadening taxonomic sampling to test the generality of the depth-rearrangement correlation; (3) Elucidating the molecular mechanisms driving these rearrangements; (4) Employing integrated multi-omics approaches (comparative genomics, transcriptomics, proteomics) and physiological assays to directly test the functional consequences of these rearrangements on mitochondrial performance; and (5) future studies could incorporate comparative analyses of non-coding regions (e.g., the D-loop) to elucidate the mechanisms and evolutionary implications of the substantial size variation observed in liparid mitogenomes.
The reference list from the paper itself. Each links out to its DOI / PubMed record.
- 1Bibb M.J. Van Etten R.A. Wright C.T. Walberg M.W. Clayton D.A. Sequence and gene organization of mouse mitochondrial DNA Cell 19812616718010.1016/0092-8674(81)90300-77332926 · doi ↗ · pubmed ↗
- 2Bartlett S.E. Davidson W.S. Identification of Thunnus tuna species by the polymerase chain reaction and direct sequence analysis of their mitochondrial cytochrome b genes J. Fish. Res. Board Canada 19914830931710.1139/f 91-043 · doi ↗
- 3Dunz A.R. Schliewen U.K. Molecular phylogeny and revised classification of the haplotilapiine cichlid fishes formerly referred to as “Tilapia”Mol. Phylogenet. Evol.201368648010.1016/j.ympev.2013.03.01523542002 · doi ↗ · pubmed ↗
- 4Mabuchi K. Miya M. Satoh T.P. Westneat M.W. Nishida M. Gene rearrangements and evolution of t RNA pseudogenes in the mitochondrial genome of the parrotfish (Teleostei: Perciformes: Scaridae)J. Mol. Evol.20045928729710.1007/s 00239-004-2621-z 15553084 · doi ↗ · pubmed ↗
- 5Alvarenga M. D’Elia A.K.P. Rocha G. Arantes C.A. Henning F. de Vasconcelos A.T.R. Solé-Cava A.M. Mitochondrial genome structure and composition in 70 fishes: A key resource for fisheries management in the South Atlantic BMC Genom.20242521510.1186/s 12864-024-10035-5PMC 1089809438413941 · doi ↗ · pubmed ↗
- 6Zhang J.Y. Zhang L.P. Yu D.N. Storey K.B. Zheng R.Q. Complete mitochondrial genomes of Nanorana taihangnica and N. yunnanensis (Anura: Dicroglossidae) with novel gene arrangements and phylogenetic relationship of Dicroglossidae BMC Evol. Biol.2018182610.1186/s 12862-018-1140-229486721 PMC 6389187 · doi ↗ · pubmed ↗
- 7Papetti C. Babbucci M. Dettai A. Basso A. Lucassen M. Harms L. Bonillo C. Heindler F.M. Patarnello T. Negrisolo E. Not frozen in the ice: Large and dynamic rearrangements in the mitochondrial genomes of the Antarctic fish Genome Biol. Evol.202113 evab 01710.1093/gbe/evab 01733570582 PMC 7936035 · doi ↗ · pubmed ↗
- 8Luo Z.S. Yi M. Yang X.D. Wen H. Jiang C.P. He X.B. Lin H.D. Yan Y.R. Mitochondrial genome analysis reveals phylogenetic insights and gene rearrangements in Parupeneus (Syngnathiformes: Mullidae)Front. Mar. Sci.202411139557910.3389/fmars.2024.1395579 · doi ↗