COFACTOR-residential: Hourly electricity and heating data from residential buildings in Norway
Åse Lekang Sørensen, Synne Krekling Lien, Harald Taxt Walnum

TL;DR
This paper presents three datasets containing hourly electricity and heating data from residential buildings in Norway, useful for energy analysis and modeling.
Contribution
The novelty lies in providing detailed, structured energy data from various residential building types in Norway, collected through collaboration with operators and users.
Findings
The datasets include energy use data from apartment blocks, cabins, and single-family houses with detailed building information.
Data is organized into human-readable files with time series durations ranging from months to years.
The data supports a range of energy-related tasks like forecasting, load profiling, and energy system analysis.
Abstract
This data descriptor describes three datasets with hourly residential energy use data and building information data from apartments, cabins and single-family houses. The first dataset contains 29 files with energy use data from 29 apartment block condominiums, with hourly time series of both electricity and delivered heat. The second dataset includes 20 files from Risvollan borettslag in Trondheim, covering heating and electricity use at the level of entire apartment blocks and heating centrals, as well as sub-metered electricity data from 1058 individual apartments. The third dataset consists of 194 files with electricity smart meter data from single-family houses, cabins, and apartments equipped with Sikom home energy management systems. The energy use data have been collected in co-operation with distribution system operators and utility providers, directly from building owners as…
Genes, proteins, chemicals, diseases, species, mutations and cell lines named across the full text — each resolved to its canonical identifier and authoritative record.
Click any figure to enlarge with its caption.
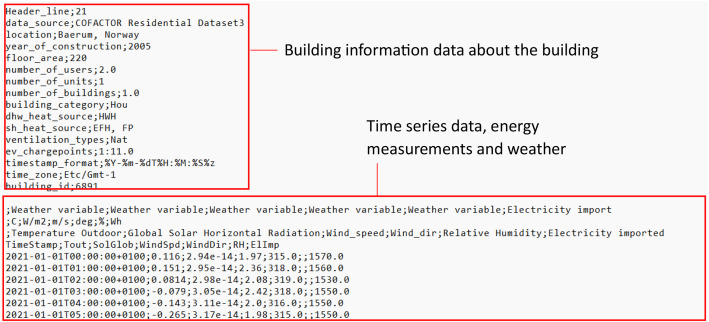 Figure 1
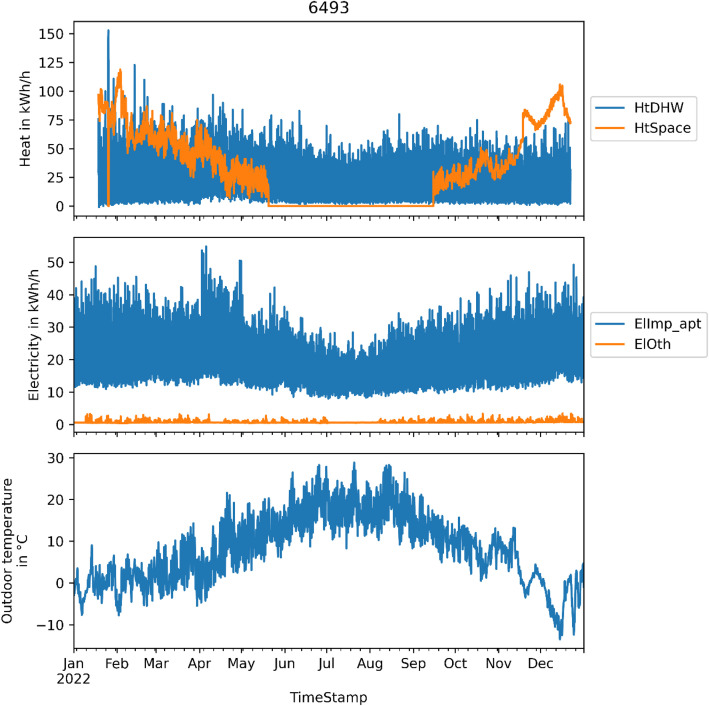 Figure 2
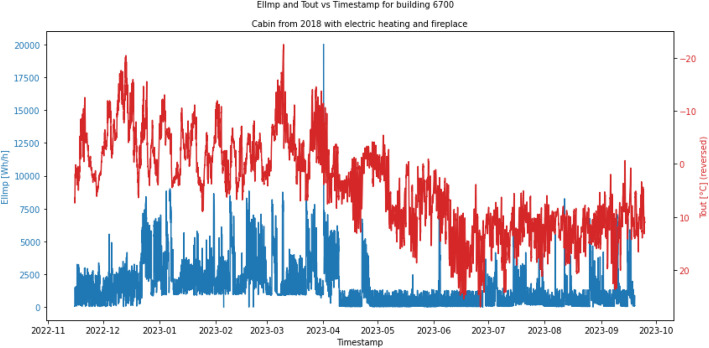 Figure 3
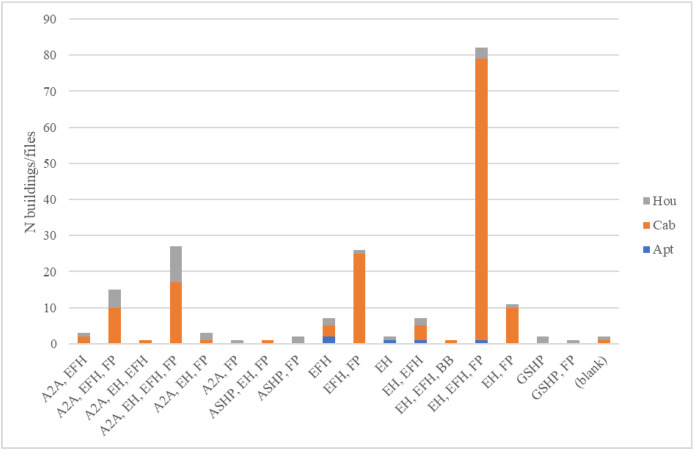 Figure 4
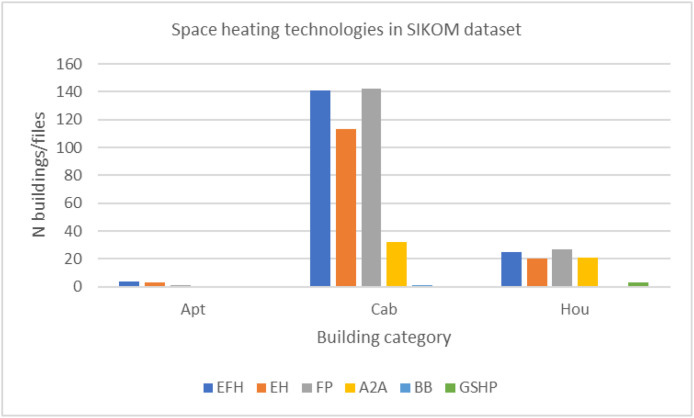 Figure 5
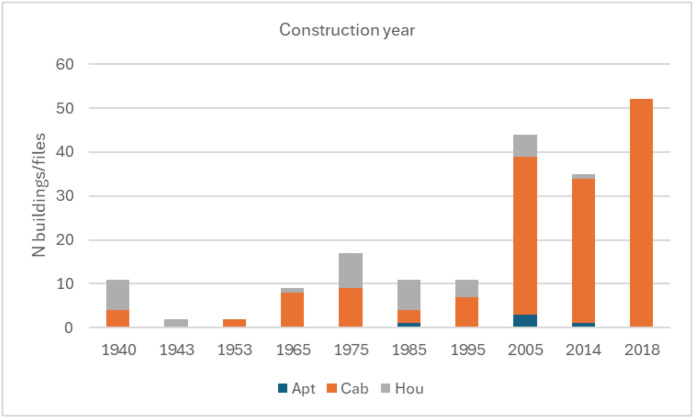 Figure 6
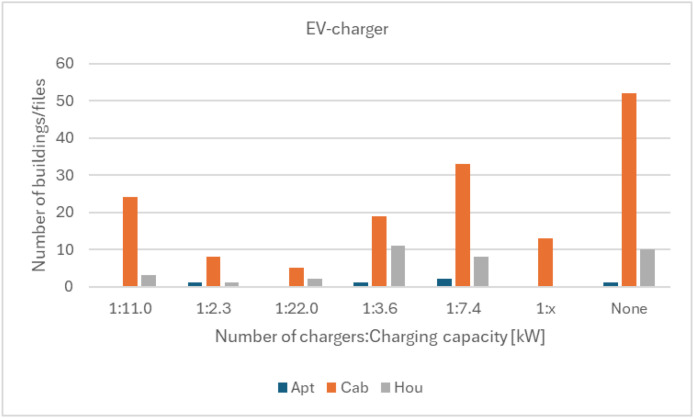 Figure 7
Peer Reviews
No public reviews on file for this paper yet. If you reviewed it on a platform where reviews are public (OpenReview, ICLR, NeurIPS, ICML), you can paste yours below so the community can read it here.
Videos
No videos yet. Explain this paper in a talk, walkthrough, or lecture? Add one.
Taxonomy
TopicsIntegrated Energy Systems Optimization · Building Energy and Comfort Optimization · Geothermal Energy Systems and Applications
Specifications TableSubjectEngineering & Materials scienceSpecific subject areaHourly energy use measurements and building information data from residential buildings (single family houses, apartments, apartment blocks and cabins).Type of data*Table; Processed human readable comma-separated (;) .txt files; readme (.txt). Decimal separator: “.”.Dataset 1: 29 human readable comma-separated .txt files. Hourly energy use data (heating and electricity) and building information data for condominiums of apartment blocks connected to 29 different heating centrals, with one file per heating central.Dataset 2: 20 human readable comma-separated .txt files. Hourly energy use data (heating and electricity) and building information data for full apartment blocks and heating centrals as well as individual apartment electricity meters from 1058 apartments in Risvollan borettslag, a large condominium in Trondheim, Norway.Dataset 3: 194 human readable comma-separated .txt files. Hourly electricity use data and building information data from 194 individual single-family houses, cabins and apartments collected through their Sikom home energy management systems.Data collectionDataset 1: Data was collected through 3rd parties. Data from main electricity meters (AMS) were collected from the local distribution system operator (DSO), Elvia AS. Data from energy meters in district heating substations were collected from the local district heating company, Hafslund Celcio AS. Heat energy meters for DHW energy use were collected through the energy management system of the technical contractor delivering the system. Additional information about the buildings and their energy systems was collected through communication with the building owners and from public registers.Dataset 2: Information about the energy system and buildings was collected from the housing cooperative. Data from main electricity meters (AMS) were collected from the local DSO, Tensio AS. Data from heating meters were collected through the energy management system of the housing cooperative. Information about number of residents and age groups was collected from the national registry in Norway.Dataset 3: Data collected from user surveys and energy management system data from individual units (cabins, apartments and single-family houses) from Sikom Connect AS, and their equipment, from several locations in Norway. Data was cleaned through outlier detection and exclusion of buildings with not enough data.General: Weather data has been downloaded for the locations from MET Norway.*Data source location**Dataset 1:**Institution: Apartment blocksCity/Town/Region: Oslo and BærumCountry: NorwayExplanation: Location given at sub-municipal level to preserve building anonymity.**Dataset 2:Institution: Apartment blocks/apartments from Risvollan BorettslagCity/Town/Region: TrondheimCountry: Norway Latitude and longitude: 59° 58′ 13.7″ North, 10° 53′ 50.0″ EastDataset 3:**Institution: Individual cabins, apartments and single-family housesCity/Town/Region: Several locations.Country: NorwayExplanation: Location given at municipal level to preserve user anonymity.Data accessibilityRepository name: data.sintef.no / COFACTORDOI Dataset 1: https://doi.org/10.60609/3ab7-ez93DOI Dataset 2: https://doi.org/10.60609/qhpe-2e71DOI Dataset 3: https://doi.org/10.60609/yd3z-e630Direct URL to data: https://data.sintef.no/product/dp-b750d103-a434–45c2-ba5e-1af13f0a866fRelated research articleS. K. Lien, H. T. Walnum, and I. Sartori, ‘Estimating heating energy for domestic hot water from total heating measurements in apartment buildings: Comparison of methods for disaggregation and daily load profile estimation in a Norwegian case study.’, Submitted to Energy, 2025. [1]
Value of the Data
1
- •This open data product consists of three different datasets with a total of 243 txt-files with hourly time series weather and energy use data from 2800 residential units with a total of approximately 250 000 m^2^ of heated floor area from Norway from both cabins, single-family houses, apartments and apartment blocks. The time series data have hourly resolution and a duration up to 4 years of data per building collected through a thorough approach in co-operation with building owners, energy providers and Sikom. The energy use data constitute novel primary data that have not previously been published and comprise both sub-metered energy use from residential buildings and smart meter data from Norwegian cabins, a data type that is currently lacking in the literature. The dataset can improve the knowledge on how residential buildings use energy. The dataset contains open, structured, and documented time series data compatible with common analysis tools (Python/R/Excel).
- •The datasets can be used by law makers, grid operators, regulators and energy planners in Norway and the Nordic countries to generate yearly and typical daily load profiles for different types of residential buildings with uncertainty and weather dependencies. These load profiles can be used to evaluate current methods and normative values in building simulation methods, such as in the standard NS3031 supplied by Standards Norway. Such load profiles can also be used in scenario analysis of how changes in the climate, the composition of buildings in an area, the energy efficiency of buildings and/or the heating type of buildings would affect the future energy use, electricity demand and peak load of an area. In addition, dataset 2 contains sub-meters for 1058 single apartments from apartment buildings in the same area which can be used to investigate different methods for the calculation of the coincidence factor and the diversity factor of apartments.
- •Researchers, PhD candidates, and students in the field of energy and building research can use this data to train, test, and validate data-driven models for heat load disaggregation in buildings with district or electric heating. Disaggregation, or non-intrusive load monitoring (NILM), separates a building’s total energy use into end-use components without additional sub-meters. Dataset 1 and Dataset 2 from this product were used in [1] to explore DHW energy disaggregation and investigate the best methods to generate typical load profiles for DHW, and the published datasets can be used as a benchmark to explore more methods for this task. Validated disaggregation models can reveal how individual loads and technologies contribute to total energy use and peak demand in buildings while typical load profiles can improve dimensioning of DHW systems in buildings, as well as be used for energy area planning.
- •The datasets can provide insights on how residential buildings contribute to peak loads in the grid and their demand-side flexibility potential, which can be beneficial to researchers, grid-planners, DSOs and energy agencies. Dataset 2 was used in several research articles on these topics including evaluation of the heating system [2], electricity use [3], simulation of photovoltaic (PV) electricity generation [4], building renovation [5], domestic hot water (DHW) use [6], Electric Vehicle (EV) charging [7,8,9], and energy flexibility potential [10,11]. The current dataset can be used to replicate and validate these studies and perform alternative analysis on the peak loads of buildings and their sub-metered loads, as they contain sub-metered data for heating, domestic hot water heating, space heating, hot water heaters and EV-charging.
- •In addition to energy use data, the datasets contain building information data (meta data) on each building or unit, including building category (apartment, apartment block, single-family house), heating system, size, and number of occupants. The datasets can be used to train classification algorithms to identify building characteristics when meta data is unavailable, reducing manual effort in future research data collection. The building information data can also be used to analyse how these parameters affect the hourly and yearly energy use of buildings which can be of interest to researchers in the field of building energy efficiency and energy sufficiency, as well as DSOs, energy planners and public agents, such as the Norwegian Water Resources and Energy Directorate.
Background
2
Detailed energy use data from buildings are essential for understanding energy use patterns, improving energy efficiency, reducing peak loads and for long term planning of the energy system. With sub-metered energy and labelled energy use data from residential buildings it is possible to explore how different loads contribute to the total heating load in residential buildings [1], as well as how residential buildings use energy and how they can contribute with demand side-flexibility [10,11]. This data descriptor presents three residential energy use datasets collected within the COFACTOR project [12] and the Research Centre on Zero Emission Neighbourhoods in Smart Cities (FME ZEN) [13]. Each dataset includes human-readable txt files with a consistent structure containing building information, hourly electricity and heating energy use, and corresponding weather data, spanning up to four years per building. The first dataset covers 29 apartment blocks with hourly electricity and delivered heat data. The second includes 20 files from Risvollan borettslag in Trondheim, comprising heating and electricity data for entire blocks and heating centrals, plus sub-metered electricity data from 1058 individual apartments. The third contains 194 files with smart meter data from single-family houses, cabins, and apartments equipped with Sikom home energy management systems.
Data Description
3
This manuscript is a data descriptor of a data product with three different datasets. Each of the datasets consist of several human readable comma-separated .txt files with residential building energy use data, including building information data, energy time series data and weather data from residential buildings in Norway. All the txt-files in the three different datasets follow the same structure. The time series data have a duration between 1–4 years per building with hourly resolution. The three datasets are summarized as follows:
- Dataset 1: 29 files. Energy use data (heating and electricity) for condominiums of apartment blocks connected to 29 different heating centrals, with one file per heating central.
- Dataset 2: 20 files. Energy use data (heating and electricity) for full apartment blocks and heating centrals as well as individual apartment electricity meters from 1058 apartments in Risvollan borettslag, a large condominium in Trondheim, Norway.
- Dataset 3: 194 files. Smart meter data from 194 individual single-family houses, cabins and apartments collected through their Sikom home energy management systems.
Table 1 contains an overview of the datasets and the files in the datasets. The datasets and files are more thoroughly described later in this data descriptor.Table 1. Characteristics of apartment buildings in the COFACTOR dataset.Table 1 dummy alt textIDsDescription/ LocationN FilesLocationB. catYear of const-ructionHeatingFloor areaN buildingsN unitsData periodDataset 16470–64734 heating centrals with a total of 12 apartment blocks in Bærum4BærumApt1953/ 1954/1957GSHP+EB+EFH or EB+EHW+EFH20 321122522019–20226474–64785 apartment blocks in the North-East of Oslo5OsloApt1974ASHP+EHW+ EH+EFH19 13752422019–20226479–649517 apartment blocks in the east of Oslo (1 file per block)17OsloApt1966DH56 648175782019–202264997 apartment blocks in the north of Oslo connected to 1 heating central1OsloApt1945GSHP+EB+EHW17 62273552019–20236892–68932 apartment blocks in the north of Oslo (1 file per block)2OsloApt2018/2019DH+EFH13 52321552020–2023Dataset 26449–6468Large condominium with several heating stations and buildings20TrondheimApt1972DH+EFH93 707-10582018–2022Dataset 36698–68915 apartments (1 file each)5NorwayApt1985–2014See own section.507-5Variable between 2021 and 2023154 cabins (1 file each)154NorwayCab1940–201820 21815415435 houses (1 file each)35NorwayHou1940–20146 7293535N=number of. B.cat = Building category. Apt = Apartment or apartment block. Cab = Cabin. Hou = Single-family house.ASHP = air source heat pump, DH = district heating, GSHP = ground source heat pump, EB = electric boiler, EFH = electric floor heating, EHW = electric hot water heater.
Contributions and clarifications
3.1
The datasets presented in this data descriptor provide novel energy use data from several residential buildings and units in Norway, including apartments, single family houses, and cabins. The energy use datasets are combined with complementary building and energy system information data. Comparable open datasets that combine hourly main meter data for electricity and heating with sub metered data, as well as energy use data from Norwegian cabins, are scarce. The structure of the datasets are similar to the structure of the datasets described in [14] and [15] and due to this, the sub-chapter on file-structure may have several similarities with these data descriptors. Although the overall file structure is similar across the three data descriptors, the datasets all contain primary energy use data that originate from different data owners, cover different building categories (public buildings, schools, and residential buildings), were collected at different times, and were supported by different research projects. The energy use data from the datasets constitute primary data collected directly from, or in collaboration with, the building owners for datasets 1 and 2, and from the home energy management provider Sikom for dataset 3, with explicit permission from the homeowners. Prior to the publication of the datasets described in the Data Descriptor, these data were private and not publicly available.
The level of raw data that can be made publicly available differs between the datasets due to data ownership agreements and GDPR considerations. For datasets 1 and 2, the raw data originally consisted of energy use measurements at the individual apartment level. However, in accordance with legal considerations in the energy companies, and in agreement with building owners, only data aggregated to the level of full apartment buildings could be released, in order to prevent re-identification of individual residential units. For dataset 3, raw energy use data were collected with explicit consent from homeowners for anonymized publication for research purposes. To protect their privacy, building information data have been anonymized, for example by resetting the location in from postal code to municipality. The published datasets therefore represent the highest possible level of raw data that can be shared while remaining compliant with GDPR and data owner agreements.
Repository
3.2
The data are stored in a repository organized as an open access Data Product in the data.sintef.no data platform (https://data.sintef.no/). A direct link to the repository is here: https://data.sintef.no/product/dp-b750d103-a434–45c2-ba5e-1af13f0a866f
The Data Product is called “COFACTOR” and contains a description of the datasets and a link to each of them, also called “Data features”. A summary of the different datasets/data features are given in Table 2. The files are human-readable, and the data product also contain a script with python code for reading the .txt files that may be used by others to efficiently read the files into data frames if using python. Due to GDPR considerations and data sharing agreements with the data providers, it is not possible to share all internal data processing code.Table 2. Overview of the datasets and structure within the COFACTOR data product.Table 2 dummy alt textReferenceData feature nameFilesEnergy data availableDataset 1COFACTOR-Residential Dataset 1Zip-folder with 29 .txt-files + README.txt.Apartment blocks with some sub-meters in Oslo and Bærum.Dataset 2COFACTOR-Residential Dataset 2Zip-folder with 20 .txt-files + README.txt.Apartment blocks with main meters for heating and single meters per apartment in TrondheimDataset 3COFACTOR-Residential Dataset 3Zip-folder with 194 .txt-files + README.txt.Main meters from 194 individual single-family houses, cabins and apartments.CodePython code for reading treASURE-files (building files with building information data and energy use data)1 .py file for reading the .txt files with building information data and time series data to data frames.-SurveyDataset 3: Anonymized survey and responses1 .csv file with survey questions and answers.-
The Data Features/datasets each have their own websites within the data product. Each of the datasets contain a dataset description as well as two files:
- 1)COFACTOR_Res_DatasetX_files.zip: A zip-folder for Dataset X containing several txt files, one per building or heating central. Each file contains building information data and hourly time series data. The txt files are named “uniqueID” to preserve anonymity and a unique ID.
- 2)README.txt: Description of dataset, txt-files and abbreviations in the txt files.
File structure
3.3
All files in the zip-folder within each of the datasets are txt-files and follow the same structure as shown in Fig. 1. Each of the txt files consist of two main parts; the first lines contain building information data, while the second part consist of the building time series data. The building data contains information about the buildings including the type of building, its size, and number of units for apartment blocks. The time series data contains 4 rows of headers, including the long name, unit, description and short name. The time series index contains timestamps formatted as %Y- %m- %dT %H: %M: %S%z and comply with ISO 8601. The timestamps are given in local normal time: CET (UTC+01:00). The time series is left-labelled, meaning that a timestamp such as 2018–01–01T00:00:00 + 01:00 represents the use during the hour 00:00–01:00. The actual local time zone of the location is “Europe/Oslo”.Fig. 1. Example of the txt-file outline. The files in all of the datasets consists of one part with building information data and one part with time series data.Fig 1 dummy alt text
Table 3 describes all the available building information data parameters, descriptions and abbreviations available in the txt-files.Table 3. Characteristics of apartment buildings in the COFACTOR dataset.Table 3 dummy alt textBuilding information data parameterDescriptionData typeExampleHeader_lineFirst line of measurements (for reading the txt)Int39locationLocation of the buildingStrTrondheim, Norwayyear_of_constructionYear of constructionInt1975floor_areaFloor area in square metersInt130number_of_unitsNumber of units in the building, e.g. the number of apartments in the building.Int1number_of_usersNumber of users (residents)Int2number_of_buildingsNumber of buildings on the lotInt1building_categoryBuilding category abbreviation. Apartment block or apartment: ‘Apt’Single-family house: ‘Hou’Cabin: ‘Cab’Str‘Hou’notesAny notes/additional information about the building and energy dataStr‘Description’dhw_heat_sourceType(s) of heating technology for hot water heating. See table below for available options.Str'HWH'sh_heat_sourceType(s) of heating technology for space heating. See table below for available options.Str‘A2A, EH, EFH, FP’pvPhotovoltaic system inverter capacity (kW)Str or float‘None’ or ‘10.4’timestamp_formatFormat for the timestamp in the time seriesStr‘ %Y- %m- %dT %H: %M: %S%z’time_zoneTime zoneStr‘Etc/Gmt-1′building_idId of the buildingStr‘6730′data_sourceDescription of the data sourceStr‘COFACTOR Residential Dataset3’ev_chargepointsNumber of chargers and their capacityInt:Float1:3.6ventilation_typesVentilation types. Nat = Natural ventilation, Mech = Mechanic exhaust, CAV_fxd = Constant Air Volume fixedStr“Nat”
For heating of space heating (sh_heat_source) or domestic hot water (dhw_heat_source), the following options for heating technologies are available for the buildings, as given in Table 4. The buildings can use one or more heating appliances for each heating purpose.Table 4. Abbreviations of heating types for the different energy services in the file building information data.Table 4 dummy alt textOption nameOption descriptionAvailable for energy servicesA2AAir to air heat pumpSHASHPAir source heat pumpSH, DHWDHDistrict heatingSH, DHWEBElectric boilerSH, DHWEFHElectric floor heaterSHEHElectric heaterSHFPFireplaceSHGSHPGround source heat pumpSH, DHWHWHHot water heaterDHWSH = Space heating, DHW = domestic hot water heating.
Each .txt-file contain time-series data which has several columns, including energy main meters, energy sub-meters and weather data. Available column names, their descriptions and units are given in Table 5.Table 5. Time series column names.Table 5 dummy alt textColumn nameDescriptionMeasurement categoryUnitTimeStampTime stamp in local UTC timeTimeTimeToutTemperature OutdoorWeather variableCSolGlobGlobal Solar Horizontal RadiationWeather variableW/m^2^WindSpdWind speedWeather variablem/sWindDirWind directionWeather variabledegRHRelative humidityWeather variable%ElAuxAuxiliary electricity useElectricity useWhElBoilElectricity for electric boilersElectricity useWhElEVElectricity for EV-chargersElectricity useWhElHPElectricity for heat pumpsElectricity useWhElHWHElectricity for electric hot water heatersElectricity useWhElHtElectricity for electric heatersElectricity useWhElImpElectricity imported to the building.Electricity Import (main meter)WhElImp_aptElectricity imported, sum of AMS meters of apartments.Electricity ImportWhElMixElectricity for mixed purposes (heating and other)Electricity useWhElMix_expElectricity exported from a meter with mixed purposesElectricity exportWhElOthElectricity for other purposesElectricity useWhElPlugElectricity plug loadsElectricity useWhHtDHHeating from district heatingHeat use (main meter)WhHtDHWHeating energy for Domestic Hot WaterHeat useWhHtHPHeat from heat pumpsHeat productionWhHtSpaceHeating energy for space heating.Heat useWhHtTotTotal heating energy. HtTot = HtSpace + HtDHWHeat use (sometimes main meter)Wh
Experimental Design, Materialsl and Methods
4
All of the three datasets and files contain building information data as well as time series data from weather and energy use. This section describes the scope of the data collection, the data collection process for different datasets and some insights into the data within each dataset. The collection process for each dataset is described further in the sections below. For most of the buildings, the type, calibration, and accuracy of sub-meters vary and are not documented. Main electricity meters and district heating meters’ calibration and accuracy are regulated by law. Generally, the processing of the data from the different data sources includes the selection of suitable buildings and meters to fit the study scope, relabelling of meters, unit conversions, combining weather data with energy use data, resetting timestamps to UTC, converting files to standard file formats, as well as simple data cleaning as described in the following section. These steps were performed using R (v3.x) and Python (v3.11). The energy use data are recorded at native equidistant hourly intervals by the underlying metering infrastructure, in accordance with Norwegian main meter requirements and have not been resampled or otherwise temporally processed.
Scope of data collection
4.1
The datasets were collected through the COFACTOR project and FME ZEN, to provide new knowledge on the energy use patterns of Norwegian residential buildings. In COFACTOR, the data are used to provide new and updated coincidence factors and standard load profiles for different building categories, as well as to suggest a methodology for estimating the peak load of buildings. In FME ZEN, the data was analysed to understand the energy profiles and electricity flexibility potential in Norwegian apartment buildings with electric vehicle charging.
Weather data
4.2
Each building file includes time series data for both weather and energy use. Meteorological weather data has been obtained for the geographical locations of the buildings from the MET Nordic dataset provided by the Norwegian Meteorological Institute [16]. The building locations are identified using zip codes, and the geographical coordinates are then sourced from a database created by Erik Bolstad (https://www.erikbolstad.no/postnummer-koordinatar/).
Table 6 Weather data parameters and corresponding name in source database.Table 6presents the collected weather data, listing both the dataset names and their corresponding names in the MET Nordic dataset.Table 6 dummy alt textNameExplanationUnitMET Nordic nameCommentToutTemperature OutdoorCair_temperature_2m-SolGlobGlobal Solar Horizontal RadiationW/m^2^integral_of_surface_downwelling_shortwave_flux_in_air_wrt_timeShifted backwards by one hour to align with “left label”.WindSpdWind speedm/swind_speed_10m-WindDirWind directiondegwind_direction_10m-RHRelative humidity%relative_humidity_2m
DATASET 1: hourly electricity and heating data from apartment buildings
4.3
Dataset 1 consist of hourly electricity use and heating energy use data from apartment blocks in 29 locations in Oslo and Bærum with one file per heating central/location. The data in Dataset 1 was collected from 8 different housing associations which includes in total 43 apartment blocks and 2330 apartments. More details about the different files and apartment blocks are given in Table 7. The data was collected in co-operation with Dråpe Entreprenør AS, the local DSO Elvia AS, the local district heating provider Hafslund Celsio AS and the building owners/housing associationsTable 7Overview of the files in Dataset 1 including Building IDs with most relevant building information data.Table 7 dummy alt textIDLocYear of const-ructionFloor areaN unitsN build-ingsSH Heat SourceDHW Heat SourceEnergy columns6470Bærum195411,01114312GSHP, EB, EFHGSHP, HWHElOth’, ‘ElHt’, ‘ElImp’, ‘ElImp_apt’647119573096363EB, EFHHWHElMix’, ‘ElOth’, ‘ElHt’, ‘ElImp’, ‘ElImp_apt'647219572064242EB, EFHHWHElHt’, ‘ElPlug’, ‘ElOth’, ‘ElEV’, ‘ElImp’, ‘ElImp_apt'647319534150493GSHP, EB, EFHGSHP, HWHElOth’, ‘ElEV’, ‘ElHt’, ‘ElImp’, ‘ElImp_apt'6474NE Oslo19743163401EH, EFHASHP, HWHElMix’, ‘ElImp’, ‘ElImp_apt'647519744191531EH, EFHASHP, HWHElMix’, ‘ElImp’, ‘ElImp_apt'647619745457692EH, EFHASHP, HWHElMix’, ‘ElImp’, ‘ElImp_apt'647719744033511EH, EFHASHP, HWHElMix’, ‘ElImp’, ‘ElImp_apt'647819742293291EH, EFHASHP, HWHElMix_exp’, ‘ElMix’, ‘ElEV’, ‘ElImp’, ‘ElImp_apt'6479E Oslo19662304241DHDHElOth’, ‘ElImp’, ‘HtDH’, ‘HtSpace’, ‘HtDHW’, ‘ElImp_apt'64802880301DHDHElOth’, ‘ElImp’, ‘HtDH’, ‘HtSpace’, ‘HtDHW’, ‘ElImp_apt'64812304241DHDHElOth’, ‘ElImp’, ‘HtDH’, ‘HtSpace’, ‘HtDHW’, ‘ElImp_apt'64822880301DHDHElOth’, ‘ElEV’, ‘ElImp’, ‘HtDH’, ‘HtSpace’, ‘HtDHW’, ‘ElImp_apt'64832880301DHDHElOth’, ‘ElImp’, ‘HtDH’, ‘HtSpace’, ‘HtDHW’, ‘ElImp_apt'64842880301DHDHElOth’, ‘ElImp’, ‘HtDH’, ‘HtSpace’, ‘HtDHW’, ‘ElImp_apt'64852880301DHDHElOth’, ‘ElImp’, ‘HtDH’, ‘HtSpace’, ‘HtDHW’, ‘ElImp_apt'64862880301DHDHElOth’, ‘ElImp’, ‘HtDH’, ‘HtSpace’, ‘HtDHW’, ‘ElImp_apt'64872880301DHDHElEV’, ‘ElOth’, ‘ElImp’, ‘HtDH’, ‘HtSpace’, ‘HtDHW’, ‘ElImp_apt'64882880301DHDHElOth’, ‘ElImp’, ‘HtDH’, ‘HtSpace’, ‘HtDHW’, ‘ElImp_apt'64895000501DHDHElOth’, ‘ElImp’, ‘HtDH’, ‘HtSpace’, ‘HtDHW’, ‘ElImp_apt'64903000301DHDHElOth’, ‘ElImp’, ‘HtDH’, ‘HtSpace’, ‘HtDHW’, ‘ElImp_apt'64915000501DHDHElOth’, ‘ElImp’, ‘HtDH’, ‘HtSpace’, ‘HtDHW’, ‘ElImp_apt'64923000301DHDHElAux’, ‘ElOth’, ‘ElImp’, ‘HtDH’, ‘HtSpace’, ‘HtDHW’, ‘ElImp_apt'64935000501DHDHElOth’, ‘ElImp’, ‘HtDH’, ‘HtSpace’, ‘HtDHW’, ‘ElImp_apt'64943000301DHDHElOth’, ‘ElImp’, ‘HtDH’, ‘HtSpace’, ‘HtDHW’, ‘ElImp_apt'64955000501DHDHElOth’, ‘ElImp’, ‘HtDH’, ‘HtSpace’, ‘HtDHW’, ‘ElImp_apt'6499N Oslo194517,6223557GSHP, EBGSHP, EB, HWHElOth’, ‘ElMix’, ‘ElImp’, ‘HtDHW’, ‘HtSpace’, ‘ElBoil’, ‘HtTot’, ‘ElHWH’, ‘ElHP’, ‘HtHP’, ‘ElImp_apt'6892Oslo20196926771DH, EFHDHHtDH’, ‘ElImp’, ‘ElImp_apt'689320186597781DH, EFHDHElOth’, ‘ElAux’, ‘ElImp’, ‘ElImp_apt'
All the locations (except ID 6474–6478) have centralized space heating and domestic hot water (DHW) production, making it possible to fully distinguish between heating and electric specific energy use in these apartment blocks. The exceptions from this are the apartments with electric floor heating (EFH) in their bathrooms, which is common in Norway even in apartment blocks with a central heating system. Here, the electricity for EFH is included in the apartment electricity use. The apartment blocks with IDs 6474–6478 have centralized DHW production, but the space heating demand is covered by electricity behind the apartment meters, making it impossible to exactly distinguish the electricity use for space heating from other electricity use in these apartments with the current set up.
Hourly electricity use measurements and fuse sizes were collected for all the apartment blocks, including separate electricity use meters for common areas and individual apartments, from the local DSO. The meters are from Aidon, and the data has hourly resolution. For privacy reasons, individual apartment electricity measurements were aggregated to total electricity for all the apartments served by the same heating centrals. This sum is labelled “ElImp_apt” in the files. The files also contain electricity use meters for the common areas in the apartment blocks which were labelled based on communication with the apartment block owners and manual interpretation of the data, including fuse size and energy use pattern.
For the apartment blocks with centralized electricity-based heating systems, the heating centrals are equipped with separate meters from the DSO that measure the electricity use for heating (“ElHt”). Users of the dataset should be beware that the seasonal coefficient of performance (SCOP) or efficiency of these electric heating centrals are unknown.
The file with ID 6499 has been treated differently than the other files as this apartment condominium had several additional heating energy meters installed by the building owner. These meters are less accurate than the meters installed by the DSO and DH companies. Also, the system of building 6499 is quite complex, with 8 ground source heat pumps with hot gas heat exchangers, an electric boiler and an oil boiler. Due to the placement of these heating energy meters, the “HtSpace” and “HtDHW” is calculated as combinations of multiple meters, which may be a source of errors. These measurements should therefore be used with care. If any of the datapoints in the combined meters were missing, the corresponding datapoints in the combined meters were also set as missing (NaN), This avoids the possibility of misleading values in combined meters. Except for the aggregation and combination of the heating sub-meters in 6499, the data from the sub- and main meters of Dataset 1 have not been cleaned.
For the buildings with district heating, district heating measurement data were collected from the local district heating company. In addition, for buildings 6479–6495 separate meters for DHW energy use (“HtDHW”) are installed. For these buildings sthe space heating energy use (“HtSpace”) is estimated by subtracting “HtDHW” from the total imported heating energy use from district heating (“HtDH”).
The measurement resolution of all energy use data collected from the electricity smart meters available in Dataset 1 are 1 Wh, while the data from the heating energy meters and electric sub-meters are 1 kWh.
Fig. 2 shows energy use data from one selected apartment block (6493). The top plot shows heating energy use, split in space heating energy use (“HtSpace”) and energy use for heating of domestic hot water (“HtDHW”). The space heating system is turned off in the summer. The middle plot shows the electricity use of the same building for the same time period, for the apartments (“ElApt”) and for the common areas (“ElOth”). The outdoor temperature is shown in the bottom plot.Fig. 2. Example plot of heating and electricity energy use data for the apartment block with ID 6493.Fig 2: dummy alt text
DATASET 2: hourly electricity data from 1058 individual apartments and hourly heating data from 20 heating districts
4.4
Dataset 2 contains energy use data collected from Risvollan Borettslag which is a large housing association in Trondheim with 1058 apartments in 121 low-rise buildings. The buildings were constructed in 1972 and consist of apartments with 1 to 4 bedrooms and 53 to 107 m^2^ floor area (average 88.6 m^2^). In average, there are 1.8 residents per household. The buildings are connected to the local district heating network. District heating is used for both space heating and domestic hot water heating. The dataset is used in several research articles further describing the heating system [2], electricity use [3], simulation of photovoltaic (PV) electricity generation [4], building renovation [5], domestic hot water (DHW) use [6], Electric Vehicle (EV) charging [7,8,9], and energy flexibility potential [10,11], but has previously not been published.
Dataset 2 consist of 20 txt-files. Each of the files represent the apartment blocks connected to each of the 20 heating substations in the housing association. Each of the files contain building information data about the buildings connected to each central as well as energy use data which consist of total hourly electricity use for the apartments combined (“ElImp_Apt”), the total electricity use for the apartment blocks (“ElImp”), as well as individual meters for the electricity use in each apartment (“ElImp_X” where X refer to an anonymized apartment ID). 13 of the 20 files contain hourly measurements of energy use from district heating (“HtDH”) . In addition, the energy use data in some of the file contain sub-metered energy use for electric vehicle charging (“ElEV”), energy use for heating of domestic hot water heating (“HtDHW”) and electricity use for common areas (“ElOth”).
The following tables includes information about:
- •Table 8: Building (file) IDs, number of buildings, floor area for the apartments, number of apartments, the start and end date of available data series, as well as the resolution steps for the district heating (HtDH) meter.Table 8. Overview of the files in Dataset 2 including Building/file IDs, number of buildings, floor area for the apartments, number of apartments, the start and end date of available data series, as well as the resolution steps for the HtDH meter. (Dataset 2).Table 8 dummy alt textBuilding IDsBuildings (n)Floor area [m^2^]Units (n)Data series (start date, end date)Resol. steps heatingElImp_aptElOthElEVElImpHtDHHtDHWkWh6449544084914.02.201831.12.202202.01.201831.12.202231.12.201731.12.202214.02.201831.12.2022NANANA6450431143431.12.201931.12.202231.12.201731.12.2022NA31.12.201931.12.2022NANANA6451652585631.12.202031.12.202208.02.201831.12.202208.02.201831.12.202231.12.202031.12.202231.12.201702.01.2023NA106452953956731.12.201931.12.202208.02.201831.12.202212.02.201831.12.202231.12.201931.12.2022NANANA6453849385531.12.201831.12.202208.02.201831.12.202208.02.201831.12.202231.12.201831.12.2022NANANA64541067267131.12.202031.12.202216.10.201831.12.202216.10.201831.12.202231.12.202031.12.2022NANANA6455857836531.12.202031.12.202231.12.201731.12.2022NA31.12.202031.12.2022NANANA6456547585631.12.201931.12.202219.04.201831.12.2022NA31.12.201931.12.202231.12.201702.01.2023NA106457747585031.12.202131.12.202231.12.201731.12.202231.12.201731.12.202231.12.202131.12.202229.06.202002.01.2023NA106458537904431.12.201931.12.202231.12.201731.12.2022NA31.12.201931.12.202231.12.201702.01.2023NA106459630813311.12.201831.12.202231.12.201731.12.202231.12.201731.12.202211.12.201831.12.202229.06.202002.01.2023NA106460869337331.12.201931.12.202231.12.201731.12.202231.12.201731.12.202231.12.201931.12.2022NANANA6461546625431.12.202031.12.202231.12.201731.12.2022NA31.12.202031.12.202231.12.201702.01.2023NA106462541974527.02.201831.12.202231.12.201731.12.202231.12.201731.12.202227.02.201831.12.202231.12.201702.01.2023NA106463636804331.12.201831.12.202231.12.201731.12.2022NA31.12.201831.12.202231.12.201702.01.2023NA106464648876213.12.201831.12.202231.12.201731.12.2022NA13.12.201831.12.202231.12.201702.01.2023NA106465545075431.12.202031.12.202225.01.201831.12.2022NA31.12.202031.12.202231.12.201702.01.2023NA106466441494804.11.201831.12.202223.01.201831.12.2022NA04.11.201831.12.202231.12.201702.01.2023NA106467561397431.12.201931.12.202223.10.201831.12.202230.11.201831.12.202231.12.201931.12.202231.12.201702.01.202320.09.201802.01.2023106468425442531.10.201831.12.202226.02.201831.12.202226.02.201831.12.202231.10.201831.12.202229.06.202002.01.2023NA10TOTAL12193,707105820 IDs20 IDs11 IDs20 IDs13 IDs1 ID
- •Table 9: Building information data per file/Building ID, including number of users, floor area, number of apartment units and buildings.Table 9. Building information data per Building ID, including number of users, floor area, number of apartment units and buildings. (Dataset 2).Table 9 dummy alt textBuilding IDFloor area [m^2^]N unitsN buildingsN users644944084951076450311434473645152585661376452539567912764534938558118645467267110182645557836581416456475856512964574758507106645837904459964593081336806460693373816664614662545124646241974551076463368043698646448876261156465450754511764664149484100646761397451396468254425456
- •Table 10: Distribution of different type of apartments, floor area, and number of bedrooms per file/Building ID.Table 10. Distribution of different type of apartments, floor area, and number of bedrooms per Building ID. (Dataset 2).Table 10 dummy alt textBuilding ID groupsOne-bedroom apt (52.9 m^2^ floor area)Two-bedroom apt (83.5 m^2^ floor area)Three-bedroom apt (104.8 m^2^ floor area)Four-bedroom apt (107.2 m^2^ floor area)Total apt (n)Bedrooms (n)6449, 6450207515832076451, 6452, 645352161028178422645414525711906455, 6456, 645740261014171411645816244441046459, 6460, 6461322290161604106462, 6463, 646444327041503346465, 6466, 6467, 646844706621201466262173556671058
- •Table 11: Floor area for garages per file/Building ID.Table 11. Floor area for garages per Building ID. (Dataset 2).Table 11 dummy alt textBuilding IDGarages in basements (n) (floor area (m^2^))64492 (1903)64522 (1087)64531 (906)64512 (1359)64542 (1632)64565 (3442)64604 (2716)64591 (362)64623 (2809)64671 (1087)64681 (453)24 (16,397)
- •Table 12: Number of residents and age group in the heating districts, from [17].Table 12. Number of residents and age group in the heating districts. (Dataset 2).Table 12 dummy alt textBuildingIDsAge group (number of residents (female, male))Residents (n)< 1010 - 1920 - 2930 - 3940 - 4950 - 5960 - 6970 - 79> 80644913(4, 9)10 (6, 4)18(7, 11)17(9, 8)13(7, 6)11(6, 5)9(5, 4)14(8, 6)2(1, 1)107(53, 54)64509(4, 5)10(5, 5)4(4, 0)16(8, 8)10(3, 7)7(3, 4)7(3, 4)6(3, 3)4(3, 1)73(36, 37)645126(14, 12)11(7, 4)14(10, 4)19(9, 10)27(14, 13)8(4, 4)15(10, 5)14(7, 7)3(2, 1)137(77, 60)64529(8, 1)14(6, 8)14(10, 4)14(6, 8)17(9, 8)21(6, 15)11(6, 5)18(10, 8)9(6, 3)127(67, 60)645314(8, 6)12(4, 8)11(4, 7)15(8, 7)15(7, 8)13(6, 7)11(6, 5)17(10, 7)10(6, 4)118(59, 59)645425(14, 11)26(10, 16)17(9, 8)29(15, 14)23(10, 13)27(15, 12)14(9, 5)9(7, 2)12(5, 7)182(94, 88)645515(10, 5)24(14, 10)12(7, 5)24(14, 10)26(14, 12)22(13, 9)10(6, 4)7(4, 3)1(1, 0)141()645614(7, 7)14(4, 10)9(6, 3)9(5, 4)14(7, 7)20(14, 6)13(6, 7)13(7, 6)0(0, 0)106(56, 50)645720(11, 9)11(4, 7)25(14, 11)24(11, 13)16(10, 6)14(7, 7)8(5, 3)10(6, 4)1(1, 0)129(69, 60)645816(10, 6)10(4, 6)8(2, 6)12(8, 4)8(3, 5)13(7, 6)12(9, 3)13(6, 7)7(4, 3)99(53, 46)645918(7, 11)3(2, 1)12(9, 3)15(8, 7)5(2, 3)4(2, 2)9(5, 4)10(5, 5)4(2, 2)80(42, 38)646018(7, 11)14(9, 5)24(14, 10)22(10, 12)27(15, 12)18(8, 10)17(11, 6)20(11, 9)6(2, 4)166(87, 79)646118(8, 10)17(7, 10)18(9, 9)24(14, 10)21(11, 10)10(5, 5)8(5, 3)6(4, 2)2(2, 0)124(65, 59)646218(8, 10)10(5, 5)14(4, 10)18(12, 6)12(6, 6)14(9, 5)9(6, 3)8(4, 4)4(3, 1)107(57, 50)646311(5, 6)13(5, 8)12(5, 7)18(9, 9)6(5, 1)16(8, 8)14(9, 5)5(4, 1)3(2, 1)98(52, 46)646414(7, 7)2(1, 1)22(9, 13)15(7, 8)10(3, 7)19(15, 4)16(12, 4)9(5, 4)8(5, 3)115(64, 51)646517(6, 11)13(2, 11)11(6, 5)17(7, 10)17(10, 7)19(7, 12)14(8, 6)8(4, 4)1(1, 0)117(51, 66)646610(4, 6)5(3, 2)9(4, 5)16(7, 9)14(8, 6)21(12, 9)13(6, 7)12(7, 5)0(0, 0)100(51, 49)646715(9, 6)12(10, 2)19(9, 10)22(11, 11)18(10, 8)11(7, 4)19(11, 8)17(11, 6)6(3, 3)139(81, 58)64688(3, 5)8(4, 4)1(1, 0)8(4, 4)4(2, 2)11(6, 5)4(3, 1)8(3, 5)4(2, 2)56(28, 28)Total308(154, 154)239(112, 127)274(143, 131)354(182, 172)303(156, 147)299(160, 139)233(141, 92)224(126, 98)87(51, 36)2321(1225, 1096)
Building information data for each file (provided in the txt-files and described in Table 8, Table 9, Table 10, and Table 11) was collected from the housing cooperative Risvollan and their energy management system contractors. The electricity use data from the individual apartments are anonymized due to privacy reasons, and the exact address and size of each apartment is therefore unknown. Energy use data in the txt-files was collected from the local DSO (electricity use data from smart meters) and the energy management system of the housing cooperative (heating energy use data).
The quality of electricity use data from smart meters is regulated by law and is generally of high quality. All energy use measurements from smart meters are raw data. Some of the electricity smart meters still had missing data periods, and those hours were set to NaN in the files.
The measurement resolution of the electricity use meters including ElImp, ElImp_X, ElImp_apt, ElEV and ElOth is 1 Wh. The measurement resolution of the heating meters (HtDH and HtDHW) differed between the buildings is 10 kWh.
For the 20 substations, the meters for district heating energy use had a resolution of 10 kWh per hour for 13 of the buildings, whereas the remaining 7 substations recorded this energy use data at a coarser resolution of 100 kWh per hour. A measurement resolution of “10″ (kWh), means that the meter only registers energy use events when the accumulated energy use surpasses multiples of 10 kWh. Consequently, the hourly energy use between each 10 kWh of energy use becomes 0, causing “jumps” in the energy use. Based on the evaluation of measurement resolution and data quality, all the 7 substations with 100 kWh resolution were excluded from the final dataset.
DATASET 3: hourly electricity data and survey responses from about 35 houses and 150 cabins with smart electricity management
4.5
Dataset 3 contains 194 files with building information data and smart meter data from 194 individual single-family houses, cabins and apartments collected in co-operation with Sikom AS and from their home energy management system. Sikom Connect AS is a Norwegian company specializing in smart control solutions for heating, electricity, and security in homes and cabins.
Sikom customers were invited to share their hourly, total electricity use data, and to participate in a survey about their residential units for research purposes - voluntarily and anonymously. The questionnaire was developed by researchers at SINTEF and distributed digitally by Sikom to its customers. The survey was sent to all Sikom customers equipped with Sikom energy use meters. No preselection of participants was performed. The survey invited the customers to share their data and collected information on building characteristics, including building type, floor area, construction period, and implemented energy efficiency measures, as well as household size. In addition, respondents reported on their heating systems for space heating and domestic hot water, ventilation type, use of solid fuel heating, and the presence and characteristics of electric vehicle charging and rooftop photovoltaic systems. The questions were primarily closed-ended with predefined answer categories, supplemented by optional free text fields where additional detail was needed. The questions given in the survey are given in Table 13. The questions were designed to be direct and unambiguous, focusing on factual characteristics rather than subjective assessments in order to minimize response bias. Due to GDPR considerations, Sikom was responsible for distributing the questionnaire, collecting responses, linking survey answers to the corresponding energy use data, and anonymizing the dataset prior to transfer to the authors of this data descriptor. Relevant information from the survey responses were subsequently extracted and used to populate the building information in each building file in dataset 3. A summary of the building information data statistics from the 194 files are given Table 9. The original questionnaire was developed in Norwegian and is published in the data repository described in the Data Description section.Table 13. Translated questions from the Sikom user survey and types of answers given by the respondents.Table 13 dummy alt textType of answer2. What is the postal code of the property?Numerical3. What is the property type?5 options4. What is the area of the property?Numerical5. How many people live in the property?1–9+6. What is the construction year of the property?10 options7. Have energy efficiency measures been implemented?9 options (multiple)8. How is the property heated?8c. Is the fireplace used for heating?4 options9. What heating sources are used for heating domestic hot water?5 options10. How is your property ventilated?4 options11. How do you charge your car at your property?3 options11bWhat is the maximum power your electric car charges with at your property? (choose the closest option)5 options11c. Do you control the charging of your electric car? (e.g., plug in the afternoon but charging starts at night)3 options11d If you have an electric car: What kind of car do you have? (model and year of the car(s) used most frequently)Free text12. Are solar panels installed and connected to your electricity meter?Yes/no21b If yes: What is the installed capacity in kW?Numerical13. Do you use Sikom's options for controlling energy use?3 options14. Is there any other information you think is relevant to the energy use in your property?Free text
239 Sikom customers volunteered to share their electricity use data and filled in the survey. However, 45 buildings were excluded due to limited data available (see considerations below), yielding a total of 194 building files (5 apartments, 154 cabins and 35 houses) in dataset 3.
The duration of the time series data within each files varies between a few months to two years. Each of the 194 files in Dataset 3 contain data from one electricity meter “ElImp”, which shows the hourly imported electricity use to the building. The measurement resolution of these electricity use meters is 10 Wh.
As the Sikom electricity meters are not used for billing purposes, and thereby not under the same quality regulations as DSO meters, the electricity data has been slightly cleaned. The following cleaning process has been applied:
- For timestamps where more than 50 % of all meters/files has a value of exactly 0, it was assumed that something was wrong with the energy collection system, and all metering points were set to NaN for these time steps.
- The core purpose of the project where the data was collected, was to evaluate typical energy use patterns and peak loads of residential buildings. It was considered that a minimum amount of data was required to evaluate this. 2000 hours corresponds to approximately 3 months. Buildings with less than 2000 valid measurement points were hence excluded.
Fig. 3 shows an example of data plotted for one of the buildings, ID 6700. This is a cabin from 2018 with electric heating and a fireplace at 146 m^2^ and with an EV-charger. The building has about 10 months of energy use data. The figure shows that there is variable electricity use during the year, with variation in energy use both dependent on the season/outdoor temperature as well as intermittent occupancy.Fig. 3. Tout and ElImp plotted against the TimeStamp for building 6700 which is a cabin from 2018 with electric heating and a fireplace.Fig 3 dummy alt text
The following figures includes the following information about the buildings in Dataset 3:
- •Table 14: Average, maximum and minimum floor area in the residential units, split by building type.Table 14. Average, maximum and minimum floor area given in the building information data for the Sikom buildings in Dataset 3 per building category.Table 14 dummy alt textAptCabHouAverage [m^2^]101131192Max [m^2^]200902350Min [m^2^]505065
- •Figure 4: Heating appliance combinations present in the residential units, split by building type.Fig. 4. Space heating appliance combinations given in the building information data for the Sikom buildings in Dataset 3 per building category.Fig 4 dummy alt text
- •Figure 5: Space heating appliances present in the residential units, split by building type.Fig. 5. Space heating technologies given in the building information data for space heating the Sikom buildings in Dataset 3 per building category.Fig 5 dummy alt text
- •Figure 6: Given construction year for the units split by building type.Fig. 6. Construction year given in the building information data for the Sikom buildings in Dataset 3 per building category.Fig 6 dummy alt text
- •Figure 7*: EV-charging information split per building type.*Fig. 7EV-charging information in the building information data for the Sikom buildings in Dataset 3 per building category.Fig 7 dummy alt text
While the files in dataset 3 contain electricity use data from several apartments, households and cabins, the costumers are not necessarily representative for Norwegian residential units. Given the building area statistics [18] one can assume that average apartments in Norway are approximately 70 m^2^ and average single-family houses are about 155 m^2^. New cabins are on average 99 m^2^ which is assumed to be bigger than the average cabin size of the cabin stock [19]. The buildings in Dataset 3 are on average bigger than the average residential units in Norway, as shown in Table 14. Fig. 6 also shows that most of the buildings are quite new compared to the general building stock of Norway, with most being built after 2005.
Limitations
Users should exercise caution when down sampling the dataset, as missing data points may occur. Data from smart meters and district heating meters are generally reliable, as they comply with strict billing regulations. However, sub-meter data, while valuable, can vary in quality and should be validated before research use. In some cases, specific periods of sub-meter data may need to be discarded due to measurement errors [20].
For Dataset 1, the placement of heating energy meters means that HtSpace and HtDHW are derived from multiple meters, which introduces potential uncertainty. These measurements should therefore be interpreted with care.
The building information data in the files from Dataset 3 was collected from self-reports through user surveys and may contain inconsistencies due to differences in how respondents interpret the questions. The survey was conducted in Norwegian and the anonymized, non-linked responses and the full survey can be found in the data product for COFACTOR. Dataset 3 are not necessarily representative of the Norwegian cabin stock.
Overall, the datasets include mostly raw measurements, except for some exceptions described in the previous section, and each file should be inspected to confirm data quality and suitability for the intended analysis.
Ethics Statement
The authors have read and follow the ethical requirements for publication in Data in Brief and confirming that the current work does not involve human subjects, animal experiments, or any data collected from social media platforms.
Credit Author Statement
For this data descriptor: Åse Lekang Sørensen: Writing - Original Draft, Data Curation, Validation, Project administration, Writing Review and editing**, Synne Krekling Lien:** Data Curation, Writing - Original Draft, Writing - Review & Editing. Harald Taxt Walnum: Data Curation, Writing - Original Draft**,** Writing - Review & Editing.
For the related research article: Synne Krekling Lien: Conceptualization, Data curation, Formal analysis, Investigation, Methodology, Software, Validation, Visualization, Writing – original draft, Writing – review & editing. Harald Taxt Walnum: Conceptualization, Data curation, Formal analysis, Investigation, Methodology, Software, Validation, Visualization, Writing – original draft, Writing – review & editing. Igor Sartori: Conceptualization, Methodology, Validation, Writing – original draft, Writing – review & editing.
The reference list from the paper itself. Each links out to its DOI / PubMed record.
- 1SørensenÅ.L.Lindberg K.B.Walnum H.T.Sartori I.Aakenes U.R.Andresen I.Heat analysis for energy management in neighbourhoods: case study of a large housing cooperative in Norway IOP Conference Series: Materials Science and Engineering 201910.1088/1757-899X/609/5/052009 · doi ↗
- 2SørensenÅ.L.Sartori I.Lindberg K.B.Andresen I.Electricity analysis for energy management in neighbourhoods: case study of a large housing cooperative in Norway Journal of Physics: Conference Series, EPFL 2019 IOP Publishing Lausanne, Switzerland 01205710.1088/1742-6596/1343/1/012057 · doi ↗
- 3SørensenÅ.L.Sartori I.Lindberg K.B.Andresen I.Analysing electricity demand in neighbourhoods with electricity generation from solar power systems: a case study of a large housing cooperative in Norway IOP Conference Series: Earth and Environmental Science, IOP Conference Series 201910.1088/1755-1315/352/1/012008 · doi ↗
- 4Walnum H.T.Bagle M.SørensenÅ.L.Fufa S.M.Cost optimal investment in energy efficiency measures and energy supply system in a neighbourhood in Norway E 3S Web Conf. Volume 246, Cold Climate HVAC & Energy 2021202110.1051/e 3sconf/202124605005 · doi ↗
- 5SørensenÅ.L.Walnum H.T.Sartori I.Andresen I.Energy flexibility potential of domestic hot water systems in apartment buildings E 3S Web Conf. Volume 246, Cold Climate HVAC & Energy 2021202110.1051/e 3sconf/202124611005 · doi ↗
- 6SørensenÅ.L.Lindberg K.B.Sartori I.Andresen I.Analysis of residential EV energy flexibility potential based on real-world charging reports and smart meter data Energy Build.241202111092310.1016/j.enbuild.2021.110923 · doi ↗
- 7SørensenÅ.L.Lindberg K.B.Sartori I.Andresen I.Residential electric vehicle charging datasets from apartment buildings Data Br.36202110.1016/j.dib.2021.107105 PMC 813470534026988 · doi ↗ · pubmed ↗
- 8SørensenÅ.L.Westad M.C.Delgado B.M.Byskov K.Stochastic load profile generator for residential EV charging E 3S Web Conf.36220221810.1051/e 3sconf/202236203005 Build Sim Nordic 2022 · doi ↗