Subtype-Dependent Expression Patterns of Core Hippo Pathway Components in Thymic Epithelial Tumors (TETs): An RT-qPCR Study
Lisa Elm, Nadja Gerlitz, Jens Neumann, Georgia Levidou

TL;DR
This study finds that different types of thymic tumors show distinct patterns in the expression of key Hippo pathway genes, suggesting potential biomarkers for classification.
Contribution
The study identifies subtype-specific expression patterns of Hippo pathway components in thymic epithelial tumors using RT-qPCR.
Findings
YAP1 and TEAD4 are upregulated in specific TET subtypes, particularly in type A and B3 thymomas and thymic carcinoma.
Upstream Hippo kinases like MST1 and LATS1 are reduced in thymic carcinoma compared to other subtypes.
SAV1 is elevated in type A and B3 TETs, while MOB1A remains near baseline across subtypes.
Abstract
Background/Objectives: Thymic epithelial tumors (TETs) are rare, histologically heterogeneous neoplasms lacking robust molecular biomarkers. Hippo pathway dysregulation—driving YAP/TEAD-dependent transcription—has been implicated across cancers, but transcript-level data in TETs are limited. Methods: We profiled 26 (23 TETs and three normal thymus) formalin-fixed and paraffin-embedded (FFPE) specimens by SYBR real-time quantitative polymerase chain reaction (RT-qPCR) across World Health Organization (WHO) subtypes, focusing on core Hippo components YAP1, TEAD4, MST1, SAV1, LATS1, and MOB1A. Expression was normalized to the geometric mean of HPRT1 and TBP and reported as log2 fold change (log2FC) using the 2−ΔΔCq method relative to the pooled normal. Group differences were compared using non-parametric tests. Results: Median log2FC values showed subtype-dependent upregulation of…
Genes, proteins, chemicals, diseases, species, mutations and cell lines named across the full text — each resolved to its canonical identifier and authoritative record.
Click any figure to enlarge with its caption.
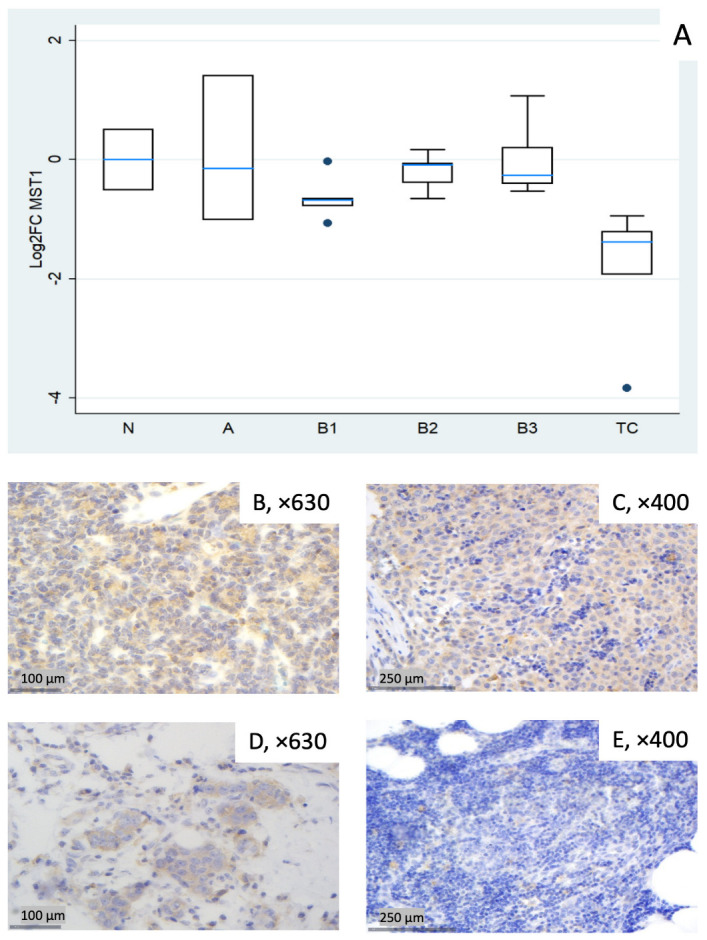 Figure 1
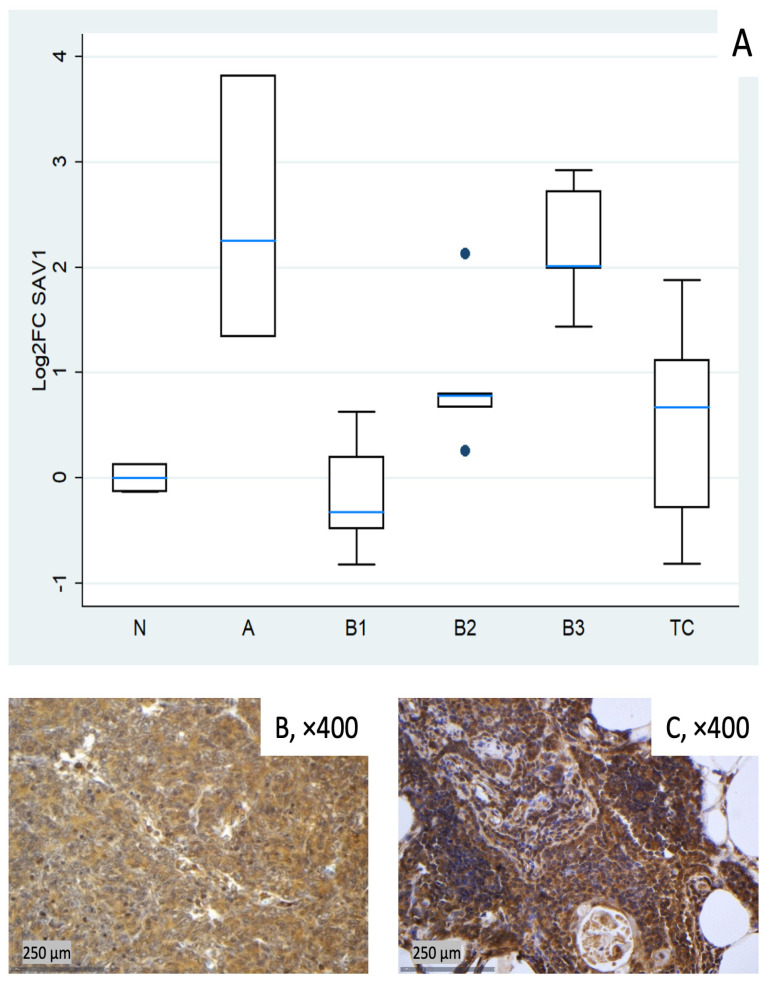 Figure 2
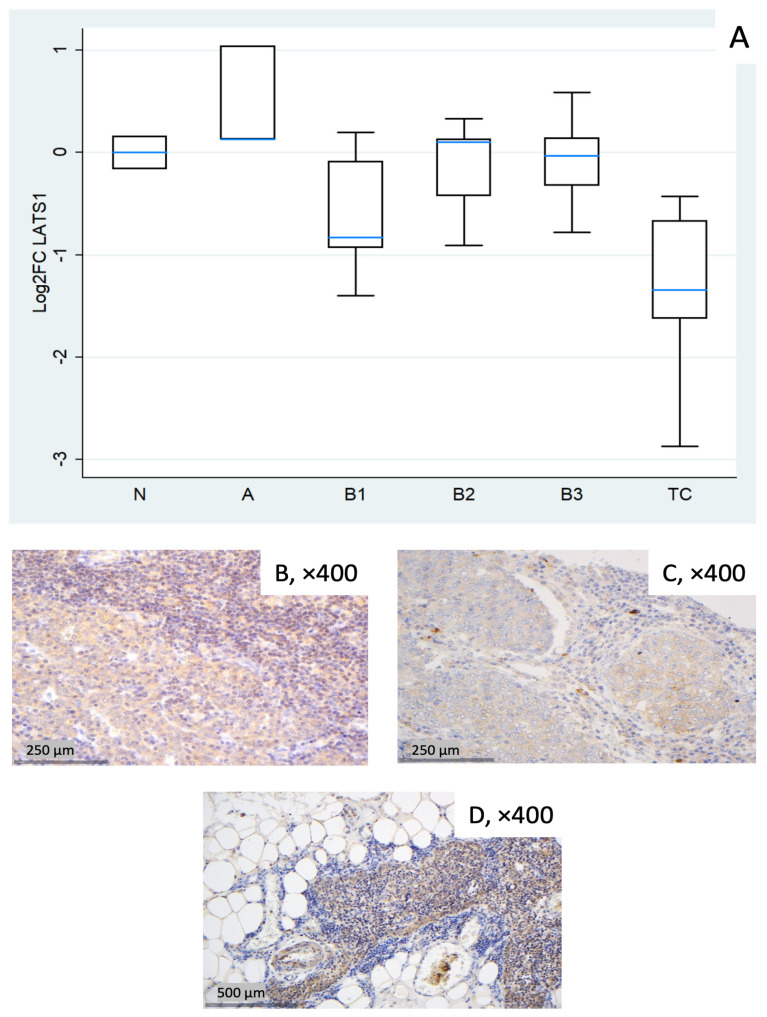 Figure 3
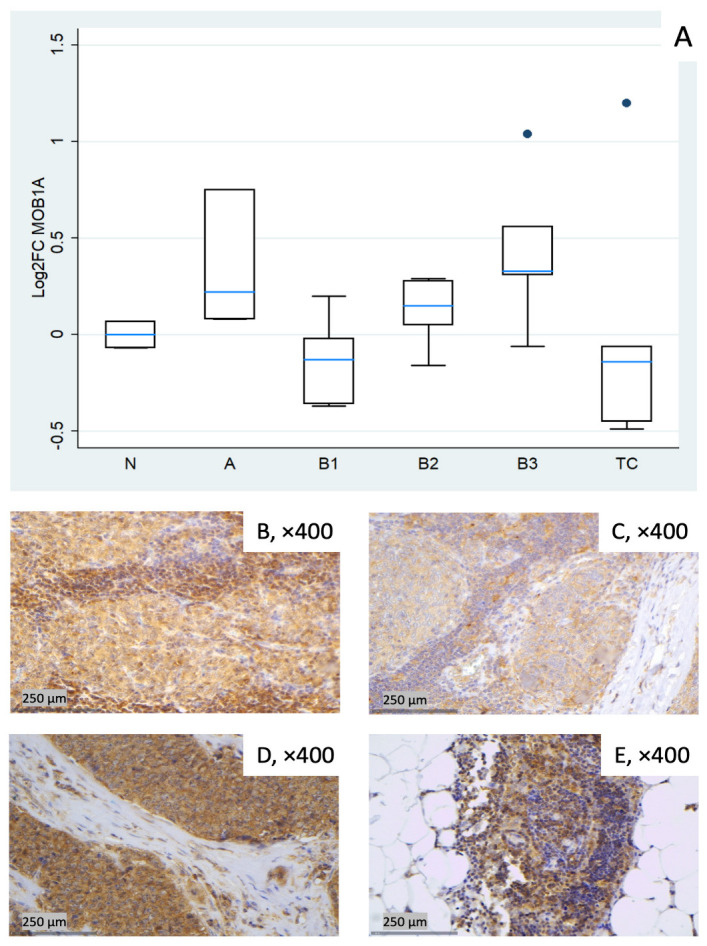 Figure 4
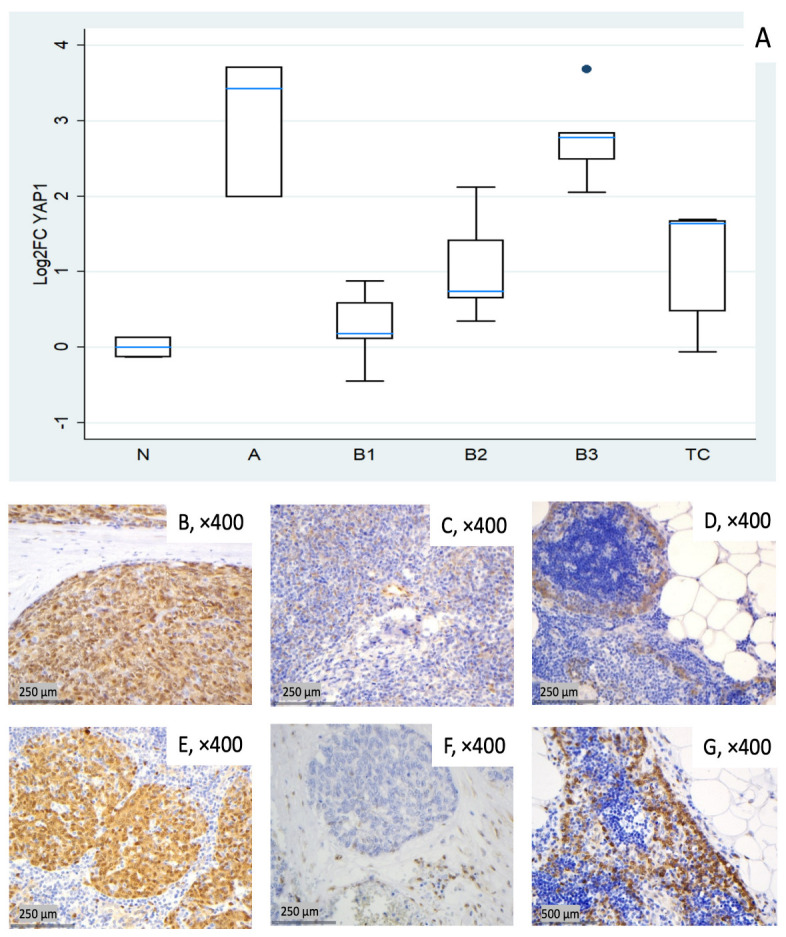 Figure 5
 Figure 6
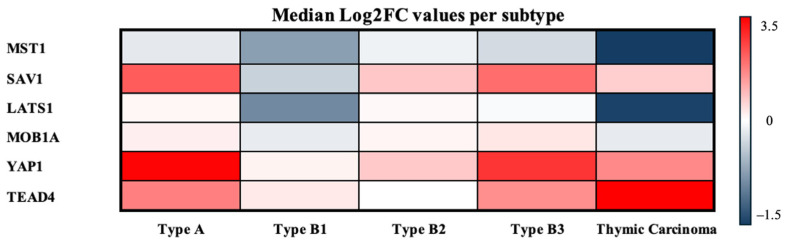 Figure 7
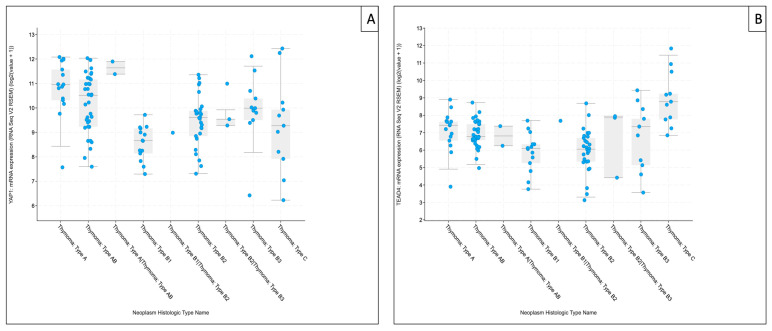 Figure 8
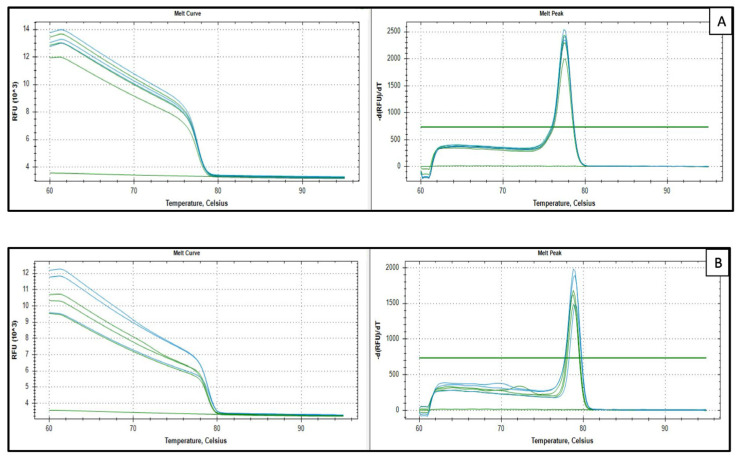 Figure 9
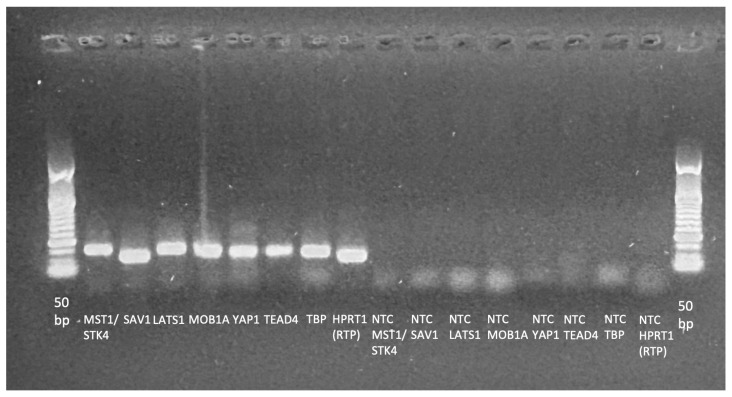 Figure 10
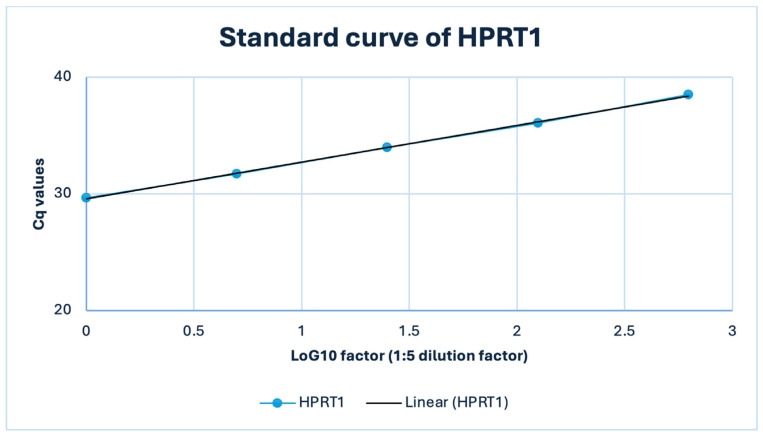 Figure 11
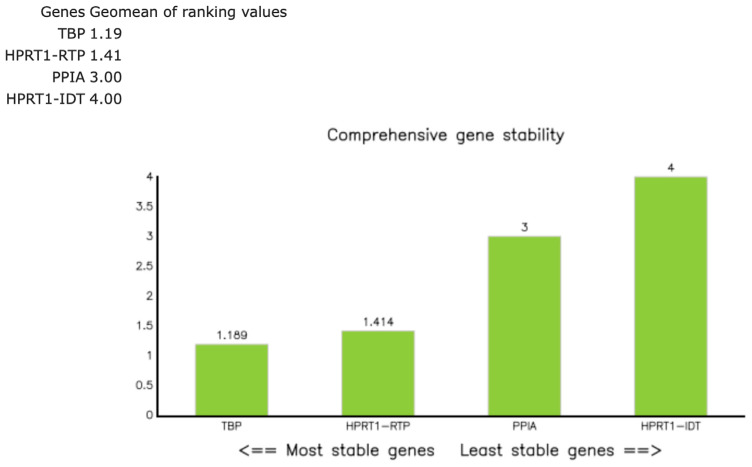 Figure 12
Peer Reviews
No public reviews on file for this paper yet. If you reviewed it on a platform where reviews are public (OpenReview, ICLR, NeurIPS, ICML), you can paste yours below so the community can read it here.
Videos
No videos yet. Explain this paper in a talk, walkthrough, or lecture? Add one.
Taxonomy
TopicsHippo pathway signaling and YAP/TAZ · Myasthenia Gravis and Thymoma · Connective Tissue Growth Factor Research
1. Introduction
Thymic epithelial tumors (TETs) are uncommon neoplasms arising from thymic epithelial cells, with heterogeneous clinical courses [1]. Although they comprise only 0.2–1.5% of all malignancies, they are the most frequent tumors of the anterior mediastinum [2]. Histology alone does not reliably predict biological behavior—particularly given that clinical aggressiveness spans from thymoma type A/AB through B1–B3 to thymic carcinoma (TC)—making risk stratification and the separation of indolent from aggressive disease challenging and underscoring the need for robust molecular biomarkers to improve diagnosis and prognosis [2,3].
A detailed understanding of the molecular basis of cancer is fundamental to designing effective, individualized therapies [4]. Among signaling circuits that drive tumorigenesis when deregulated, the Hippo pathway centrally regulates tissue and organ growth during development. Its disruption promotes malignancy by coupling unchecked proliferation with impaired apoptosis—two canonical cancer hallmarks [4]. In normal tissues, Hippo signaling acts as a growth-suppressive kinase cascade that constrains transcriptional programs driving proliferation. When the pathway is active (“Hippo on”), upstream kinases mammalian STE20-like kinase 1/2 (MST1/STK4; MST2/STK3) and the scaffold Salvador family WW domain-containing protein 1 (SAV1) promote activation of large tumor suppressor kinase 1/2 (LATS1/2) (with MOB kinase activator 1A/B (MOB1A/B) as cofactors). This leads to phosphorylation of Yes-associated protein 1 (YAP1) and transcriptional co-activator with PDZ-binding motif (TAZ/WWTR1) and their cytoplasmic retention and/or proteasomal degradation [2]. When Hippo signaling is inactive (“Hippo off”), dephosphorylated YAP1/TAZ translocate to the nucleus and bind TEA domain transcription factors 1–4 (TEAD1–4) to induce target genes involved in cell-cycle progression, survival, and tissue remodeling [2].
Hippo dysregulation arises from both genetic and non-genetic mechanisms and contributes to tumor development across entities—including glioma, breast, liver, lung, prostate, colorectal, and gastric cancers [5,6,7]. Importantly, diverse upstream disturbances appear to converge on a shared downstream output, activation of the transcriptional co-effectors YAP1 and TAZ, which, through TEAD1–4, reprogram gene expression linked to tumor progression, metastasis, immune modulation, metabolic adaptation, and therapy resistance [4,6]. Humans encode four TEAD paralogs (TEAD1–4) that partner with YAP1/TAZ. Therapeutic efforts have therefore sought to interfere with YAP/TAZ–TEAD complex formation [6].
Prior work on Hippo signaling in TETs remains limited. Although key studies implicate this pathway, uncertainties persist regarding subtype-resolved expression patterns and their clinical relevance [2,8]. Moreover, Hippo activity appears context dependent, with reports across cancers noting differences related to subcellular localization (nuclear vs. cytoplasmic) and tumor type, highlighting the need for careful, subtype-aware analyses [2,6,8].
Building on our prior immunohistochemical (IHC) survey of TETs—which demonstrated widespread expression of core and upstream Hippo components and, notably, associated cytoplasmic TEAD4 with poorer overall survival [2]—we focused on a transcript-level characterization of the Hippo pathway in a subset of the original cohort. Specifically, we profiled quantitative real-time polymerase chain reaction (RT-qPCR) expression of the pathway’s output and control tiers—YAP1, TEAD4, and the upstream regulators MST1, SAV1, LATS1, and MOB1A—across histological subtypes, using pooled normal thymus as reference. Our primary aim was to describe the messenger RNA (mRNA) expression patterns of these core Hippo components across TET subtypes relative to normal thymus and to assess whether transcript-level differences qualitatively mirror and extend the protein-level alterations observed previously. We sought to define subtype-associated mRNA expression patterns of core Hippo components that may strengthen the molecular framework to improve our understanding of the molecular background of TETs that could support future molecular stratification of indolent vs. aggressive TETs.
2. Materials and Methods
2.1. Study Design and Ethical Considerations
This retrospective, anonymized study was conducted in accordance with the Declaration of Helsinki (institutional review board (IRB) statement IRB-2024-07 dated 5 April 2024).
2.2. Case Selection and Tissue Processing
This study includes 26 archival FFPE samples, comprising 23 thymic epithelial tumors (TETs) and three samples of non-neoplastic thymus (N1–N3), diagnosed between 2013 and 2023 in the Department of Pathology, Nuremberg Clinic (Nuremberg, Germany). The median age at diagnosis was 59 years (range 36–77 years), with a slight male predominance. Clinical and pathological characteristics refer to the 23 TET patients and are summarized in Table 1.
This collection of cases derives from a larger group of IHC-characterized cohort of 77 cases from our previous investigation [2]. The selection of cases to be included in the present investigation was based on block quality and available tissue, comprising normal thymus (N) (n = 3), thymoma type A (n = 3), thymoma B1–B3 (n = 5 each), and TC (n = 5). For each selected paraffin-embedded block, 5–10 sections of 5 µm thickness were prepared.
2.3. RNA Extraction and Nucleic Acid Quantification
Total RNA was isolated using the Maxwell^®^ RSC FFPE RNA Kit (Promega, Madison, WI, USA) following the manufacturer’s instructions, including a deparaffinization step and DNase I treatment. Because thymic tissue can harbor a physiologically high genomic DNA (gDNA) burden, RNA and residual DNA concentrations were quantified fluorometrically to guide downstream primer strategies (Qubit™, Thermo Fisher Scientific, Waltham, MA, USA). Spectrophotometric purity (A260/280) was assessed with a NanoDrop™ Lite (Thermo Fisher Scientific, Waltham, MA, USA; Table S1), with an expected ratio of 1.8–2.0. As RNA integrity number (RIN) and DV200 metrics are of limited utility for highly fragmented FFPE-derived RNA, functional integrity was assessed indirectly by consistent amplification of short amplicons of reference genes and by passing of the kit-provided internal control (IC) in all analyzed samples (Section 2.4).
2.4. One-Step RT-qPCR Workflow
Reverse transcription (RT) and qPCR were performed in a single-tube, two-phase protocol using the QuantiNova^®^ SYBR^®^ Green RT-PCR Kit (QIAGEN, Hilden, Germany, Cat. No. 208154) on a CFX96™ Real-Time PCR Detection System (Bio-Rad, Hercules, CA, USA), following the manufacturer’s instructions. Total nucleic acid input was titrated in pilot reactions (10–100 ng per 20 µL). A total of 50 ng per 20 µL provided consistent amplification, linear response, and acceptable replicate dispersion and was used for all analytical runs.
Reactions (20 µL) contained 10 µL 2× SYBR^®^ Green RT-PCR Master Mix, 0.2 µL QN SYBR^®^ Green RT-Mix, 2 µL 10× primer mix (0.5 µM each primer), 2 µL RNA template (50 ng) and 5.8 µL nuclease-free water, or an optional additional 1 µL QN IC RNA and 4.8 µL nuclease-free water. Cycling consisted of RT at 50 °C for 10 min, polymerase activation at 95 °C for 2 min, followed by 40 cycles of 95 °C for 5 s and 60 °C for 10 s. The melt curve analysis (65–95 °C; 0.2 °C increments for 5 s) was used to confirm single-product amplification. Cq values were calculated with CFX Manager™ Dx version 3.1 (Bio-Rad, Hercules, CA, USA), using a constant baseline and threshold across plates.
To ensure inter-run comparability in the absence of a pooled inter-run calibrator, two representative FFPE samples were re-analyzed in triplicate for selected targets (YAP1, MOB1A, TATA-box binding protein (TBP), and Hypoxanthine-guanine phosphoribosyl transferase 1 [HPRT1, RealTimePrimers.com (RTP)]) after scheduled replacement of the CFX96™ instrument (after sample 21) and across reagent lot changes, accepting an inter-run/instrument variation of ≤0.5–1 Cq (Tables S2–S4). In addition, potential plate effects were assessed using reference-gene Cq distributions, with HPRT1 (RTP) and TBP showing strong cross-run correlation (Spearman’s rho = 0.88 and 0.89 for blocks 1 and 2; both p < 0.001) and no relevant inter-run deviations (Kruskal–Wallis, all p > 0.10; Table S3).
SAV1 and LATS1 were quantified in a subsequent run (block 2) due to reagent resupply, using the same reference genes (HPRT1 (RTP) and TBP) and the same ΔΔCq normalization to the median of normal thymus samples (N1 and N3) as for all other targets.
Each plate included no-template controls (NTC) for every assay and no-reverse-transcriptase controls (NRT) for every sample. NTCs were required to show no amplification or only late signals (Cq ≥ 37.5 within 40 cycles), and NRTs were required to be negative to exclude gDNA contribution. Assay specificity was confirmed by single-peak melt curves and single bands at expected amplicon sizes on agarose gels. Minor primer–dimer peaks at ~72 °C were occasionally observed for TEAD4 (3/17 plates) and YAP1 (1/17 plates) in NTCs only at very late Cq values (Cq ≥ 37.5) and were considered negligible for quantification. Representative melt curves and gel images are shown in Figure A1 and Figure A2. Full melt-curve sets are provided in Supplementary Figure S1.
An internal amplification control was included once per sample (QuantiNova Internal Control RNA (QN IC RNA); QuantiNova^®^ LNA^®^ PCR Reference Assay, QIAGEN, Hilden, Germany; Ref. No. 249920) to monitor RT/amplification performance and potential inhibition [9]. Runs were considered acceptable for ΔCq (sample − IC) < 2 (Table S5). No separate pooled positive calibrator was included; inter-run performance was monitored via the kit-provided IC and predefined quality criteria (QC) (Section 2.8), and expression values were normalized to validated reference genes (Section 2.6).
For MOB1A, the initial measurement of the normal thymus sample N1 failed quality control (all three technical replicates were invalid) and was therefore re-analyzed on an additional plate. The repeat Cq values were normalized using the same reference genes (HPRT1 (RTP) and TBP), and N1 was retained as calibrator for MOB1A in combination with N3.
2.5. Primer Design, Procurement, and Assay Validation
Primers targeted core Hippo-pathway genes. PrimeTime™ qPCR Primers for MST1/STK4 (Hs.PT.58.20785666), SAV1 (Hs.PT.58.45488696), LATS1 (Hs.PT.58.40644872), MOB1A (Hs.PT.58.40138473), YAP1 (Hs.PT.58.22607088), TEAD4 (Hs.PT.58.23238289), TBP (Hs.PT.58.20792004), peptidyl-prolyl isomerase A (PPIA; Hs.PT.39a.22214851), and HPRT1 (Hs.PT.58.20881146) were obtained from Integrated DNA Technologies (IDT™, Coralville, IA, USA). HPRT1 was also sourced from RealTimePrimers.com (Elkin Parks, PA, USA; VHPS-4263).
Amplicon lengths were 94–141 bp (FFPE-compatible). In-silico specificity (NCBI BLAST, web version) ensured transcript coverage and excluded pseudogene/gDNA matches. Despite DNase I treatment, low-level gDNA carryover was detectable in some NRT controls during early validation; therefore, assays were designed or replaced to span exon–exon junctions. Notably, SAV1 (IDT™; Hs.PT.58.45727297) and PPIA showed sporadic NRT signals in a subset of specimens. SAV1 was replaced by an alternative exon–exon assay (IDT™; Hs.PT.58.45488696), and PPIA was excluded from normalization (Section 3.3). In-run validation required a single melt curve peak and the absence of NRT signals.
Two different TAZ/WWTR1 primers from IDT™ (Hs.PT.58.1944253 and Hs.PT.58.19363927) were initially included in the qPCR panel, but their SYBR Green assay showed low expression levels, recurrent primer–dimer amplification and/or non-specific amplification in NTCs and NRT controls. Because robust quantification could not be ensured, TAZ qPCR data were excluded from further analyses. LATS1 (IDT™; Hs.PT.58.39498320) was also replaced because of non-specific amplification (Table S6 and Figure S1).
Details of the primer design, including forward and reverse primer sequence, amplicon size, exon location, and RefSeq number, are listed in the Supplementary Table S6.
PCR efficiency was assessed by 1:5 serial dilution of a representative FFPE-derived complementary DNA (cDNA) sample (50–0.4 ng input; Table S7), demonstrating log-linear amplification within the working range, and a representative HPRT1 (RTP) dilution series showed a linear relationship between Cq and log_10_ template amount (R^2^ = 1.00) with an apparent efficiency of ~107% (E = 2.07; Figure A3). Because FFPE-based dilution series can yield apparent efficiencies > 100% due to matrix/template-related artefacts rather than true reaction kinetics, assay-specific efficiency correction was not applied, and relative expression was calculated using the comparative 2^−ΔΔCq^ method assuming approximately similar amplification behavior across assays (E ≈ 2) [10,11,12,13,14].
2.6. Reference Gene Strategy and Stability Assessment
Candidate reference genes included HPRT1 (RTP), HPRT1 (IDT™), TBP, and PPIA, selected based on prior use in thymic tissues/FFPE qPCR and reported stability in relative expression analyses [15,16,17]. These candidates were assayed across all 26 samples (Tables S8 and S9). Expression stability was evaluated with RefFinder (composite of geNorm, NormFinder, BestKeeper, and ΔCq approaches) [18]. The a priori criterion was the lowest composite rank across groups, with composite values ≤ 1.5 considered indicative of good stability and values > 2–3 suggesting suboptimal reference genes. RefFinder identified HPRT1 ([RTP]; composite rank 1.41) and TBP (1.19) as the most stable reference genes (Figure A4; Table S10), and their geometric mean was used for normalization. HPRT1 (IDT™) ranked lower (4.00), and PPIA (3.00) was excluded due to sporadic gDNA-related amplification (Section 2.5).
To mitigate run-specific variation in downstream ΔΔCq/log_2_FC estimates, the pooled median of the two normal thymus samples (N1/N3) served as the common calibrator across runs (Section 2.7).
2.7. Quantification and Data Processing
Primary data were Cq values from technical triplicates. Outlier handling followed Section 2.8. Relative expression was computed as 2^−ΔΔCq^ (reported as FC), normalizing to the geometric mean of HPRT1 (RTP) and TBP. For visualization and statistical analyses, values were additionally expressed as log_2_FC (Tables S11 and S12). Calculations were performed in Excel (Microsoft, Redmond, WA, USA; version 16.100.3). The calibrator was defined as the median of the two histologically normal thymus samples (N1 and N3), which showed low variability in Hippo pathway gene expression (log_2_FC near 0), whereas the third non-neoplastic sample (N2) was excluded due to benign cystic histology with sparse thymic parenchyma/reduced epithelial content and atypically high ΔCq values indicating a divergent expression profile.
2.8. Replicates and Quality Criteria
All reactions were run in technical triplicate and assessed for intra-assay variability (Tables S13 and S14). Triplicates with all three Cq values within ≤ 0.5 Cq were considered technically consistent (“gold standard”). For FFPE-derived RNA, a total spread of up to 0.8 Cq was accepted (“FFPE accepted”). Any replicate deviating by > 0.5 Cq from the mean of the two most consistent replicates was defined as a technical outlier and excluded from mean and standard deviation (SD) calculations. Reactions without two consistent replicates (ΔCq > 0.8) were classified as invalid and repeated. Biological replication was provided by independent tissue specimens per diagnostic group (N, A, B1, B2, B3, and TC).
2.9. Statistics
Log_2_FC expression values were tested for normality. Group comparisons were tested using non-parametric tests (Mann–Whitney U test or Kruskal–Wallis ANOVA as appropriate) with correction for multiple comparisons (Benjamini–Hochberg false discovery rate). Correlations were assessed by Spearman’s correlation coefficient. The significance level was α = 0.05 (two-sided). Analyses were performed using STATA software 11.0 (STATA/SE, StataCorp LP, College Station, TX, USA).
2.10. Immunohistochemical (IHC) Data
A subset of previously generated IHC data from the same cohort was used only for qualitative contextualization of RT-qPCR findings. IHC staining and scoring were performed as described in our prior study [2]. Key conditions are summarized in Table S15.
2.11. Reporting Standards
Methods and reporting adhere to the core recommendations of the original Minimum Information for Publication of Quantitative Real-Time PCR Experiments (MIQE) guidelines (2009) [10] and were further designed in alignment with key MIQE 2.0 updates [19], with detailed assay information and raw data provided in the Supplementary Materials.
3. Results
3.1. Relative Expression of Hippo Pathway Genes
Relative expression levels of six Hippo pathway genes (MST1, SAV1, LATS1, MOB1A, YAP1, and TEAD4) are presented for descriptive and statistical reporting as log_2_FC relative to the median of normal thymus samples (N1 and N3) as the calibrator (2^−ΔΔCq^). An FC of 1.0 (log_2_FC = 0) corresponds to the expression level in normal thymic tissue, with expression levels normalized to the housekeeping genes HPRT1 (RTP) and TBP. For readability, the corresponding approximate FCs (~x-fold) derived from the log_2_FC values are shown in parentheses where appropriate. For each gene, median log_2_FC values were determined for TET subtypes (A, B1–B3, and TC) and are reported descriptively, highlighting inter-subtype differences and, where evident, intra-group heterogeneity. Individual sample values are visualized as boxplots to illustrate the distribution within each subtype.
The analyzed targets are presented in Hippo pathway order, from upstream kinases and scaffolding components (MST1, SAV1, LATS1, and MOB1A) to the transcriptional coactivator (YAP1) and its nuclear effector (TEAD4).
For overview and visual context, representative (illustrative) IHC micrographs are shown for each target (Figure 1, Figure 2, Figure 3, Figure 4, Figure 5 and Figure 6). To aid interpretation of transcript–protein relationships, we provide a cohort-level summary of IHC subcellular localization in Figure S2. As expected, MST1, SAV1, LATS1, and MOB1A showed exclusively cytoplasmic staining, whereas YAP1, active YAP1 (AYAP) and TEAD4 displayed variable nuclear positivity in addition to cytoplasmic staining.
3.1.1. Relative Expression of MST1
MST1 showed broadly lower transcript levels across subtypes, most pronounced in TC (median log_2_FC = −1.38, corresponding to ~0.4-fold relative to normal thymus, Mann–Whitney U test, TC vs. all other groups (N, A, B1–B3), p = 0.002) and in B1 (median log_2_FC = −0.68, ~0.6-fold). Type A displayed notable dispersion (roughly log_2_FC −1.0 to +1.4 across cases), yielding a slightly negative median overall. B2 and B3 were modestly below normal (Figure 1A). A Kruskal–Wallis test restricted to tumor subtypes confirmed a statistically significant differential expression of MST1 among different World Health Organization (WHO) histological subtypes (p = 0.012). Representative IHC micrographs (Figure 1B–E) depict the observed range of cytoplasmic MST1 staining and show partial overlap with the mRNA distribution in Figure 1A.
3.1.2. Relative Expression of SAV1
SAV1 tended to be clearly elevated in type A thymomas (median log_2_FC = +2.25, ~5-fold) and in B3 (log_2_FC = +2.01, ~4-fold), with modest increases in B2 and TC (around median log_2_FC +0.7). B1 centered around baseline with low dispersion (Figure 2A). These differences among different histological TET subtypes were proven to be statistically significant (Kruskal–Wallis, p = 0.004). Representative IHC images (Figure 2B,C) demonstrate the spectrum of cytoplasmic SAV1 protein expression across the cohort and qualitatively correspond to the mRNA distribution shown in Figure 2A.
3.1.3. Relative Expression of LATS1
LATS1 showed a marked reduction in TC (median log_2_FC = −1.34, ~0.4-fold; Mann–Whitney U test: TC vs. all other groups (N, A, B1–B3), p = 0.008). B1 showed a mild decrease (median log_2_FC = −0.83, ~0.6-fold) with wide dispersion, whereas types A, B2, and B3 were near baseline on median (Figure 3A). The Kruskal–Wallis test confirmed a statistically significant differential expression of LATS1 among different WHO histological subtypes (p = 0.036). Representative IHC panels (Figure 3B–D) highlight inter-case variability in cytoplasmic LATS1 staining and partly reflect the RT-qPCR distribution in Figure 3A.
3.1.4. Relative Expression of MOB1A
MOB1A remained largely stable across TET subtypes (Kruskal–Wallis, p = 0.09). Modest increases were observed in type A (median log_2_FC = +0.22) and in B3 (median log_2_FC = +0.33), while slight decreases were observed in B1 (median log_2_FC = −0.13) and TC (median log_2_FC = −0.14). B2 clustered near baseline with low-to-moderate dispersion (Figure 4A). Representative IHC images (Figure 4B–E) illustrate the range of cytoplasmic MOB1A protein expression observed in the cohort and show variable correspondence with the mRNA distribution in Figure 4A.
3.1.5. Relative Expression of YAP1
In this cohort, YAP1 expression tended to be elevated across all tumor subtypes. Type A thymomas (median log_2_FC = +3.43, ~11-fold) and B3 thymomas (median log_2_FC = +2.78, ~7-fold) showed the highest median values, followed by TC (median log_2_FC = +1.64, ~3-fold). B1 and B2 showed lower medians (median log_2_FC 0.18 to 0.74) but marked inter-sample variability, ranging from near baseline to moderately elevated expression (Figure 5A). Kruskal–Wallis confirmed the statistically significant differential expression among TET subtypes (p = 0.003). Representative IHC images (Figure 5B–G) demonstrate the spectrum of cytoplasmic YAP1 protein expression across the cohort, consistent with the mRNA pattern shown in Figure 5A.
3.1.6. Relative Expression of TEAD4
TEAD4 showed pronounced upregulation in TC (median log_2_FC = +3.49, ~11-fold; Mann–Whitney U test: TC vs. all other groups (N, A, B1–B3), p = 0.004) and clear increases in type A (median log_2_FC = +1.74, ~3- to 4-fold) and B3 (median log_2_FC = +1.55, ~3-fold). B1 remained close to baseline yet was dispersed (log_2_FC about −0.7 to +1.1), and B2 exhibited a widespread distribution with a near-zero median, indicating heterogeneity rather than a uniform shift (roughly log_2_FC −1.9 to +2.3 across cases, Figure 6A). These differences among different histological TET subtypes were proven to be statistically significant (Kruskal–Wallis, p = 0.015). Representative IHC panels (Figure 6B–E) highlight inter-case variability in TEAD4 staining and show qualitative agreement with the RT-qPCR distribution in Figure 6A.
3.2. Consolidated Overview of the Relative Expression Results of Hippo Pathway Genes
Table 2 summarizes the sample-wise fold changes (FCs) and corresponding log_2_FC values for the core Hippo pathway components, while Table 3 presents the subtype-specific median log_2_FC values.
To provide an integrated overview of these expression patterns across TET subtypes, the median log_2_FC values of all Hippo components were subsequently visualized in a heatmap (Figure 7).
3.3. Contextualization of Subtype-Associated Hippo Pathway Expression Using the Cancer Genome Atlas Thymoma (TCGA-THYM) RNA-Sequencing Data
To contextualize our exploratory RT-qPCR findings within an independent dataset, subtype-resolved mRNA expression patterns of selected Hippo pathway components were examined in The Cancer Genome Atlas Thymoma (TCGA-THYM) RNA-sequencing cohort via cBioPortal (study: Thymoma (TCGA, Firehose Legacy), accessed 20 January 2026, Figure S3) [20]. Due to platform- and normalization-related differences between RNA-sequencing and RT-qPCR, comparisons were limited to the directionality of subtype-associated trends.
Across the TCGA-THYM cohort, MST1 expression varied across histological subtypes but showed a comparatively heterogeneous distribution, with less consistent directional overlap with our FFPE-based RT-qPCR measurements. SAV1 displayed higher expression in type A thymomas and lower levels in B1 tumors, broadly matching the direction of change observed in our RT-qPCR series. LATS1 likewise exhibited subtype-dependent variation in TCGA-THYM, but concordance with our cohort was less pronounced than for downstream targets. MOB1A showed comparatively limited variation across subtypes, consistent with the largely stable expression pattern observed in our RT-qPCR dataset.
For downstream components, YAP1 tended to be higher in type A and B3 thymomas and remained higher than B1/B2 subtypes, mirroring the directionality observed in our RT-qPCR analysis. TEAD4 showed the clearest subtype-associated gradient in TCGA-THYM, with the highest median expression in TC and comparatively higher medians also in type A and type B3 thymomas, whereas B1/B2 subtypes exhibited lower median levels—aligning directionally with our cohort, despite marked within-subtype variability. For clarity and focus on these downstream effectors, TCGA-THYM expression plots for YAP1 and TEAD4 are shown in the main manuscript (Figure 8A,B), whereas corresponding analyses for upstream Hippo components (MST1, SAV1, LATS1, and MOB1A) are provided in Supplementary Figure S3.
4. Discussion
TETs are rare neoplasms of the anterior mediastinum with pronounced histological heterogeneity and a wide range of clinical behavior, making diagnostic and prognostic assessment based on histology alone challenging [1,2,3,21,22]. The Hippo signaling pathway, a central regulator of tissue growth and tumor progression, has emerged as relevant in TETs [2,8,23,24,25,26,27]. However, prior work has focused predominantly on IHC analyses [2,8], while systematic transcript-level data remain scarce and the functional implications of observed alterations are largely unclear [28]. Beyond IHC, integrative genomic and transcriptomic studies have defined molecular classes aligned with histology and outcome and highlighted substantial microenvironmental heterogeneity in TETs [29,30,31]. In this exploratory study, we profiled the mRNA expression of the core Hippo pathway components YAP1, TEAD4, MST1, SAV1, LATS1, and MOB1A in TETs using RT-qPCR across WHO subtypes and related these patterns to existing IHC data (Table S16) from the same cohort.
Taken together, based on the median log_2_FC values, our RT-qPCR data indicate subtype-associated differences in core Hippo gene expression, with upregulated YAP1 and TEAD4 transcripts in type A and B3 thymomas and in TCs, alongside reduced MST1 and LATS1 levels, which are most pronounced in carcinomas. In contrast, adaptor proteins display a divergent pattern, with SAV1 tending to be increased in type A and B3 thymomas, whereas MOB1A remains largely stable across subtypes. Collectively, these findings support a subtype-linked variation in Hippo-related transcriptional output rather than a uniform shift across TETs [31,32]. In other epithelial malignancies, pathway-focused analyses suggest that Hippo status is often better captured by coordinated YAP/TAZ–TEAD programs than by single-gene measurements, consistent with interpreting our RT-qPCR results primarily as subtype-associated transcriptional signatures [24,32,33]. The observed YAP1/TEAD4 pattern aligns with reports in other cancers (e.g., ovarian cancer, lung adenocarcinoma, urothelial carcinoma) linking YAP/TEAD activity to proliferation, epithelial–mesenchymal transition (EMT), stemness features, immune modulation, and adverse outcomes [33,34,35,36,37,38,39,40,41]. While TETs are genetically less complex than many other solid cancers [21,30,31], the convergence of our mRNA data with this broader literature supports the biological plausibility that enhanced YAP1–TEAD4 transcriptional output may also play a role in more aggressive behavior in a subset of TETs [36,42,43,44]. Lower MST1 and LATS1 transcript levels are compatible with their tumor-suppressive roles in the canonical Hippo cascade [45,46,47], while increased SAV1 may reflect compensatory regulation or context-dependent pathway rewiring rather than simple loss-of-function [23,47,48,49,50]. Overall, the combination of these kinase-module reductions with preserved or elevated SAV1 and largely stable MOB1A expression suggests a component-specific modulation of the Hippo kinase cassette at the transcript level in TETs, rather than a uniform downshift across all measured components [27,47,51,52].
This transcript signature partially mirrors our IHC findings and complements previous IHC studies of Hippo signaling in TETs [1,2,3,8]. Palamaris et al. reported widespread expression of YAP1, TAZ, LATS1, and TEAD4 in thymomas and TCs with complex nuclear–cytoplasmic localization patterns [8]. In a separate IHC cohort, we similarly observed strong expression of core and upstream Hippo components and linked high cytoplasmic TEAD4 to poorer overall survival [2]. In the present study, higher YAP1 transcript levels—most evident in type A and B3 thymomas—were broadly consistent with stronger YAP1/AYAP staining, whereas TEAD4 showed subtype-associated transcript elevation (particularly in TC) alongside predominantly strong cytoplasmic staining but highly variable nuclear positivity. Notably, individual tumors exhibited discordant TEAD4 transcript and staining patterns, supporting the concept that TEAD4 localization and nuclear engagement may be influenced by regulatory mechanisms beyond transcript abundance, including context-dependent YAP/TAZ–TEAD dynamics [32,35,51,52,53,54]. In contrast, MST1, SAV1, LATS1, and MOB1A showed only modest or heterogeneous transcript changes despite consistently intense cytoplasmic protein expression. Such transcript–protein discrepancies are expected for Hippo signaling, where functional pathway state is largely determined by post-transcriptional and post-translational control rather than simple on/off shifts in transcript abundance [22,45,51,52,53]. Several methodological aspects likely contribute to these transcript–protein discrepancies. Bulk RT-qPCR from FFPE tissue captures mixed cell populations, whereas IHC scoring was restricted to tumor cells. Differences in thymocyte/stromal admixture may therefore contribute to transcript–protein discrepancies and attenuate apparent subtype differences [53]. Single-cell and immune-profiling studies of TETs further underscore subtype-associated variability in epithelial and immune/stromal composition, reinforcing that bulk transcript measurements can be influenced by microenvironmental admixture [54,55,56]. Moreover, IHC is inherently semi-quantitative and, in our cohort, showed clear ceiling effects for several Hippo core components (e.g., MOB1A, SAV1, and LATS1). This narrow dynamic range is particularly relevant for protein-stable molecules whose levels are regulated predominantly beyond the transcript level [57,58,59]. In addition, IHC captures compartmental localization (nuclear vs. cytoplasmic), which may change independently of transcript abundance and further weaken sample-level mRNA–protein concordance. Biologically, discordance between transcript abundance and protein staining is expected for Hippo signaling because pathway state is primarily determined by phosphorylation, protein turnover, and subcellular localization rather than mRNA levels [47,60]. Upstream kinases and scaffold proteins may remain protein-stable and highly expressed, while their activity (or phosphorylation state) changes [47,60], whereas YAP/TAZ–TEAD output can be modulated by mechanotransduction [47], cell–cell contact [60,61], and feedback loops that do not necessarily scale with transcript abundance [62]. In addition, transcript isoform usage and differential mRNA/protein half-lives can decouple mRNA from IHC intensity [63,64]. Technically, FFPE-related RNA fragmentation, variable tumor cellularity, regional sampling differences between sections used for RT-qPCR vs. IHC, and antibody epitope performance can further contribute. Together, these considerations underscore that mRNA and protein provide complementary views and that transcript abundance alone is an incomplete proxy for pathway state, particularly for upstream regulators [23,47,57,58,59,65].
When viewed against the broader molecular landscape of TETs defined by large-scale sequencing efforts, our findings add a pathway-focused perspective rather than uncovering new driver events [28,30,31,66,67]. Integrated genomic analyses, such as the TCGA study by Radovich et al. and the more recent multiomics work by Möhrmann et al., indicate that TETs are characterized by relatively low mutational burdens. The TCGA analysis defined four molecular subtypes closely aligned with WHO histology and survival and highlighted the thymoma-enriched General Transcription Factor II-I (GTF2I) L424H mutation (particularly in type A/AB), alongside enrichment of HRAS/NRAS/TP53 alterations and increasing aneuploidy/genomic complexity in more aggressive tumors [30,31]. Within this framework, higher YAP1/TEAD4 transcript levels in type A, B3, and TC may reflect subtype-specific transcriptional programs superimposed on distinct genomic backgrounds rather than a shared “Hippo-on/Hippo-off” state. Recent multi-omic precision oncology cohorts further subdivide TCs into immune-infiltrated (“hot”) and immune-poor (“cold”) groups with different outcomes, suggesting that pathway signals, such as YAP/TEAD, should ultimately be interpreted together with immune context and broader molecular classes [30]. Additional independent genomic studies have similarly reported recurrent driver patterns and subtype-associated molecular profiles in TETs, supporting the view that pathway-associated signals should be interpreted within established molecular classes [29,68]. Accordingly, Hippo pathway-related alterations appear to represent one of several converging signaling alterations rather than a single dominant driver [30,31]. Our findings therefore fit with a model in which Hippo pathway changes modulate, rather than fully determine, the biological behavior of TETs and act in concert with other genomic and microenvironmental factors [50,69,70,71]. Consistent with this interpretation, subtype-level expression trends for YAP1 and TEAD4 observed in our RT-qPCR cohort showed similar directional patterns in the independent TCGA-THYM RNA-sequencing dataset, supporting cross-cohort contextualization of our exploratory findings.
The present work provides, to our knowledge, one of the first dedicated transcript-level analyses of core Hippo pathway components in TETs and integrates these data with previously established IHC patterns [2], but it has methodological limitations. First, analyses were performed on FFPE material, including archival blocks of up to ten years of age, which is associated with RNA fragmentation and pre-analytical variability [72,73]. Nonetheless, stable reference gene performance and concordant trends across related genes and subtypes argue against random artefacts and support the robustness of the main expression patterns. Second, the number of cases per histological subtype was limited, reducing statistical power, and underscoring the exploratory, hypothesis-generating nature of subtype-resolved comparisons. Although multiple-testing correction was applied, smaller effect sizes may have gone undetected and subtype-level estimates should be interpreted cautiously. In addition, bulk RT-qPCR does not resolve cellular heterogeneity. In TETs, variable admixture of thymocytes and stromal components can dilute tumor-epithelial transcripts and confound subtype comparisons, particularly when epithelial tumor cellularity differs across WHO subtypes. Third, despite careful assay design and run-to-run quality control, residual technical variability cannot be fully excluded, as is typical for FFPE-based transcript studies. Moreover, thymic tissue and TETs harbor high amounts of gDNA, which could not be completely removed even by repeated DNase treatment. We therefore used exon–exon spanning assays with partially larger amplicon length, which are suboptimal for FFPE but still showed reproducible, linear amplification [10,74]. Within these constraints, the recurrent upregulation of YAP1/TEAD4 and the reduction of MST1/LATS1 in more aggressive subtypes are likely to be robust and biologically meaningful, whereas subtle FCs should be interpreted cautiously.
Although this study offers an integrated transcript-level overview of Hippo pathway components in TETs, several questions remain open. A key next step will be to validate these expression patterns in larger, independently collected cohorts with comprehensive clinicopathological and outcome data. In parallel, functional studies in appropriate thymic epithelial model systems will be required to define how Hippo pathway alterations translate into cellular phenotypes and treatment responses [22,23,55]. Integrating RT-qPCR and IHC with higher-dimensional approaches, including whole-transcriptome profiling, genomic and epigenomic analyses, as well as single-cell or spatial methods to capture tumor–immune interactions, may further help place Hippo dysregulation within the broader molecular context of TETs and to identify co-operating pathways. Proteomic and phosphoproteomic approaches could help map Hippo pathway activity and phosphorylation patterns, thereby capturing post-translational regulation that may not be reflected at the mRNA level. Finally, as pharmacologic inhibitors targeting the YAP/TAZ–TEAD interface are entering early clinical development, our findings nominate Hippo-related candidates for further evaluation in TETs and provide a rationale for incorporating validated Hippo-related biomarkers into future biomarker-driven trials [2,75,76,77,78].
5. Conclusions
In conclusion, our study indicates subtype-dependent expression patterns of core Hippo pathway components in TETs rather than a uniform pattern across entities. Based on median log_2_FC values, YAP1 and TEAD4 transcript levels were higher in selected subtypes, notably type A and B3 thymomas and TCs. These transcript-level patterns co-occurred with lower MST1 and LATS1 transcript levels, particularly in TCs, whereas SAV1 and MOB1A showed more nuanced, component-specific variation. Integration with IHC highlights that Hippo pathway state is influenced by post-transcriptional/post-translational regulation, and that mRNA abundance only partially mirrors protein expression and localization. Given the exploratory nature of subtype-resolved analyses in this rare tumor entity, these findings nominate YAP1/TEAD4- and kinase-related readouts as candidates for independent validation in larger, ideally multi-center cohorts, with complementary spatial and functional approaches.
The reference list from the paper itself. Each links out to its DOI / PubMed record.
- 1Imbimbo M. Salfi G. Borgeaud M. Ottaviano M. Froesch P. Bouchaab H. Cafarotti S. Addeo A. Thymic epithelial tumors: What’s new and what’s next?ESMO Rare Cancers 2025410002410.1016/j.esmorc.2025.100024 · doi ↗
- 2Elm L. Gerlitz N. Hochholzer A. Papadopoulos T. Levidou G. Hippo Pathway Dysregulation in Thymic Epithelial Tumors (TE Ts): Associations with Clinicopathological Features and Patients’ Prognosis Int. J. Mol. Sci.202526593810.3390/ijms 2613593840649713 PMC 12250049 · doi ↗ · pubmed ↗
- 3von der Thüsen J. Thymic epithelial tumours: Histopathological classification and differential diagnosis Histopathology 20248419621510.1111/his.1509737994555 · doi ↗ · pubmed ↗
- 4Barron D.A. Kagey J.D. The role of the Hippo pathway in human disease and tumorigenesis Clin. Transl. Med.201432510.1186/2001-1326-3-2525097728 PMC 4112623 · doi ↗ · pubmed ↗
- 5Lo Sardo F. Strano S. Blandino G. YAP and TAZ in Lung Cancer: Oncogenic Role and Clinical Targeting Cancers 20181013710.3390/cancers 1005013729734788 PMC 5977110 · doi ↗ · pubmed ↗
- 6Pham T.H. Pahuja K.B. Hagenbeek T.J. Zbieg J. Noland C.L. Pham V.C. Yao X. Rose C.M. Browder K.C. Lee H.-J. Targeting the Hippo Pathway in Cancers via Ubiquitination Dependent TEAD Degradatione Life Sciences Publications, Ltd.Cambridge, UK 202410.7554/e Life.92450.2 · doi ↗
- 7Sanchez-Vega F. Mina M. Armenia J. Chatila W.K. Luna A. La K.C. Dimitriadoy S. Liu D.L. Kantheti H.S. Saghafinia S. Oncogenic Signaling Pathways in The Cancer Genome Atlas Cell 2018173321337.e 31010.1016/j.cell.2018.03.03529625050 PMC 6070353 · doi ↗ · pubmed ↗
- 8Palamaris K. Levidou G. Kordali K. Masaoutis C. Rontogianni D. Theocharis S. Searching for Novel Biomarkers in Thymic Epithelial Tumors: Immunohistochemical Evaluation of Hippo Pathway Components in a Cohort of Thymic Epithelial Tumors Biomedicines 202311187610.3390/biomedicines 1107187637509515 PMC 10377518 · doi ↗ · pubmed ↗