Development and optimization of electrophoretically deposited octacalcium phosphate–collagen film as bone analogues
Katrina J Staunton-Mann, Gengyao Wei, Thomas Kress, David J Barrett, Melinda J Duer, Ruth E Cameron, Serena M Best

TL;DR
Researchers created a bone-like material using octacalcium phosphate and collagen, mimicking the structure and composition of natural bone for potential use in bone grafts and disease models.
Contribution
A scalable method to produce biomimetic bone analogues with both mineral core and disordered surface similar to natural bone.
Findings
OCP-CIT synthesis under physiological conditions mimics the structural heterogeneity of natural bone mineral.
HyAc promotes collagen mineralization and enhances mineral-collagen proximity, emulating bone's interfacial organization.
Films composed of 74% apatitic orthophosphates were produced using electrophoretic deposition and dialysis.
Abstract
The hierarchical architecture of bone, characterized at the nanoscale, is defined by mineralized collagen fibrils with a disordered, hydrated, carboxylate-rich mineral surface, presenting a complexity often absent in conventional hydroxyapatite (HA) models. Here, we report the design of biomimetic octacalcium phosphate (OCP)–collagen films that reproduce both the crystalline mineral core and the citrate-rich disordered surface of native bone. Phase-pure OCP and citrate-incorporated OCP (OCP-CIT) were synthesized via pH-regulated hydrolysis of α-tricalcium phosphate (α-TCP) under physiological conditions, with citrate inducing structural heterogeneity analogous to natural bone mineral. Electrophoretic deposition facilitated the integration of these minerals into collagen films, aided by hyaluronic acid (HyAc), which stabilized colloidal suspensions by adjusting the zeta potential from −5…
Genes, proteins, chemicals, diseases, species, mutations and cell lines named across the full text — each resolved to its canonical identifier and authoritative record.
Click any figure to enlarge with its caption.
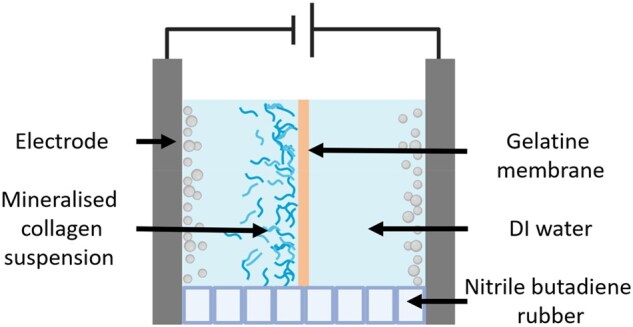 Figure 1
 Figure 2
 Figure 2
 Figure 2
 Figure 2
 Figure 2
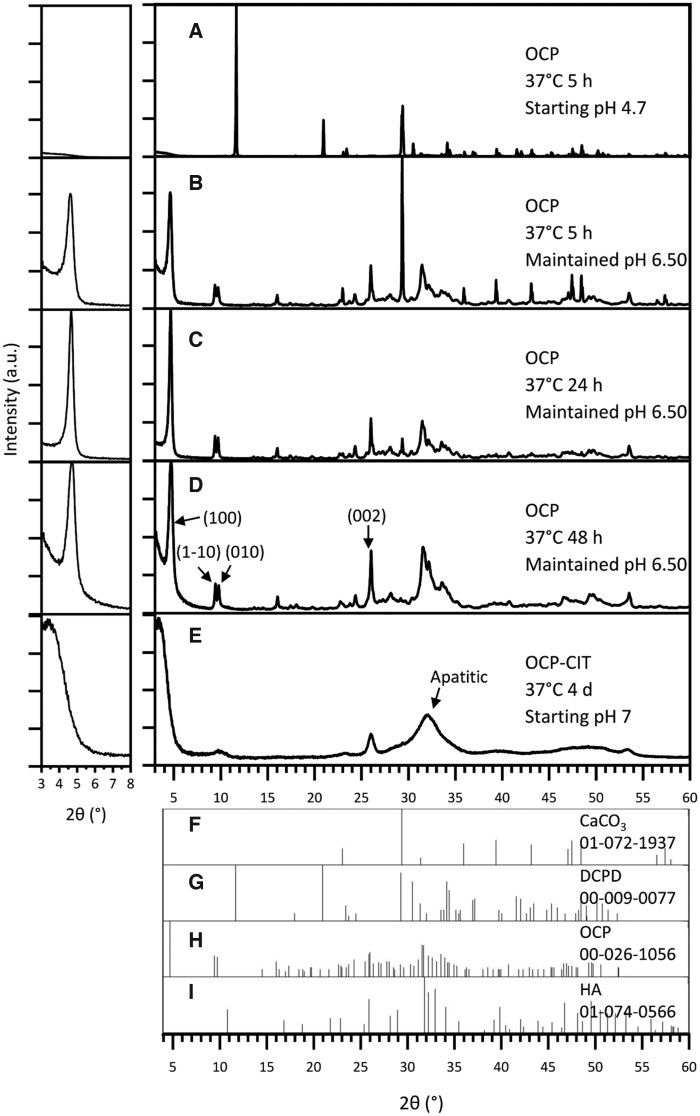 Figure 2
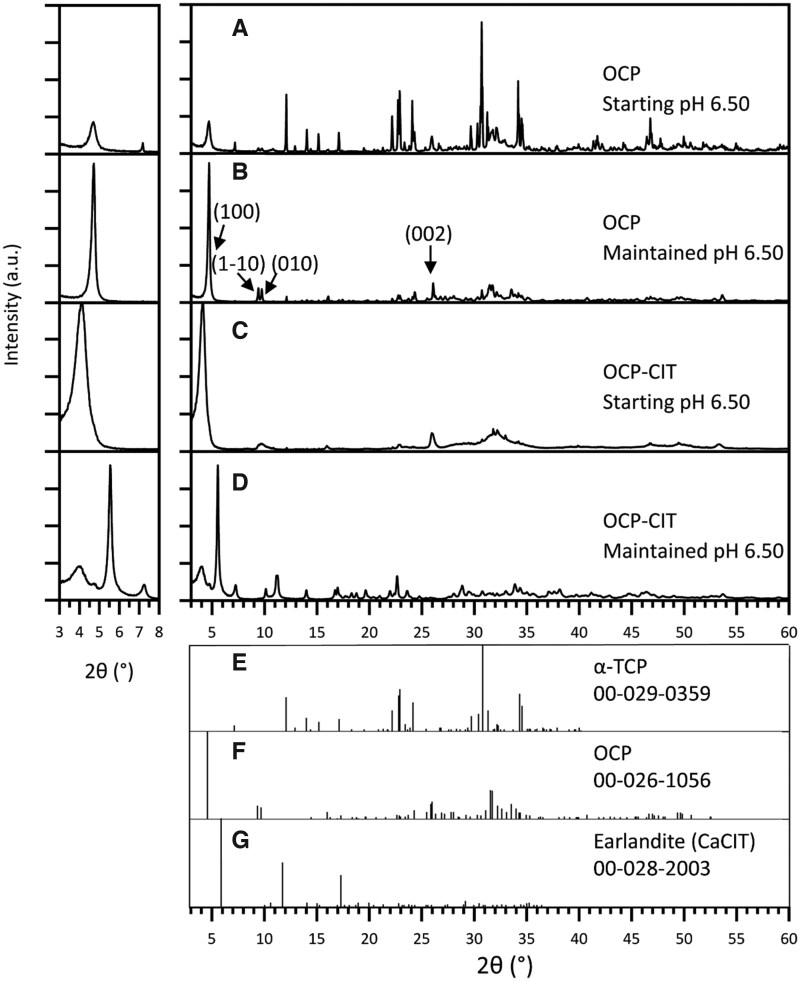 Figure 3
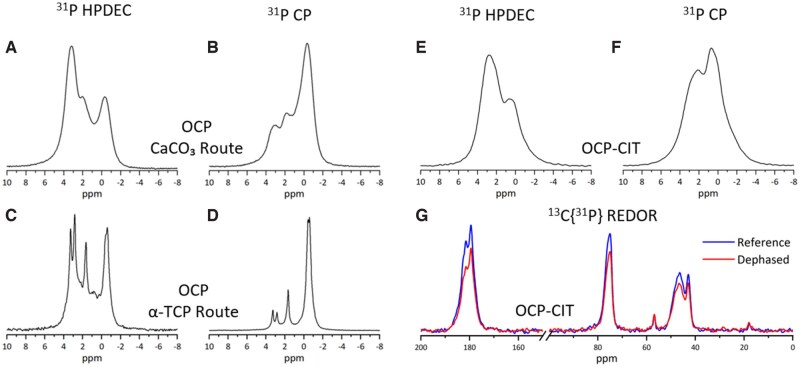 Figure 4
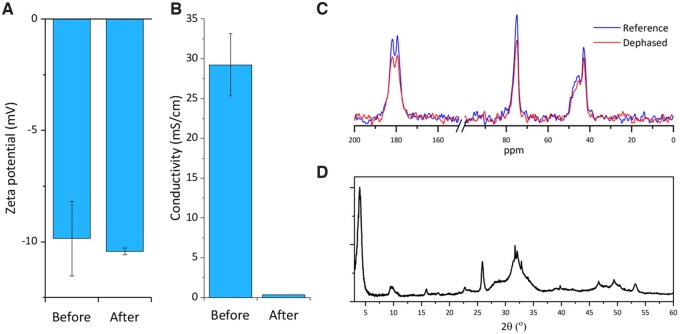 Figure 5
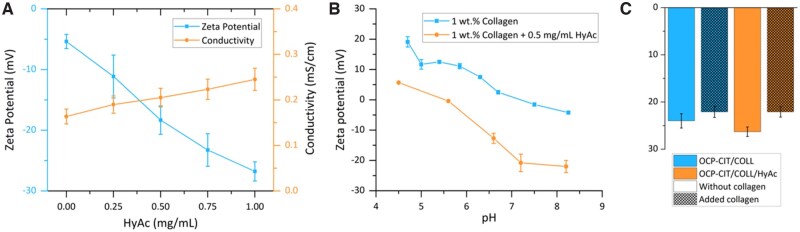 Figure 6
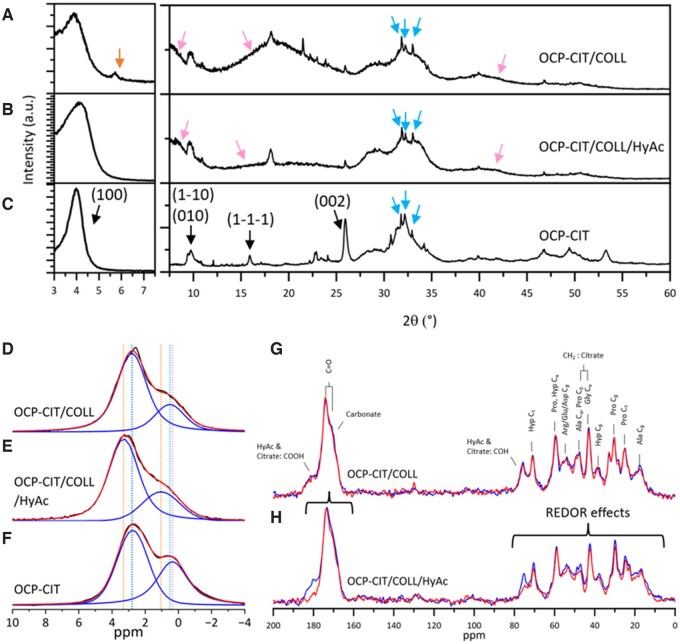 Figure 7
| Sample name | Materials in mineralization suspension | EPD preparation | |||||
|---|---|---|---|---|---|---|---|
| α-TCP | Collagen | Citrate | HyAc | Dialysis | HyAc | Collagen | |
| OCP-CIT/COLL | ✓ | ✓ | ✓ | x | ✓ | ✓ | ✓ |
| OCP-CIT/COLL/HyAc | ✓ | ✓ | ✓ | ✓ | ✓ | x | ✓ |
| Sample | Method | Time (h) | pH | 2 | FWHM |
|
|---|---|---|---|---|---|---|
| OCP | CaCO3 | 5 | M 6.5 | 4.64° | 0.34° | 19.03 |
| OCP | CaCO3 | 24 | M 6.5 | 4.67° | 0.26° | 18.93 |
| Sample | Method | Time (h) | pH | 2 | FWHM |
|
|---|---|---|---|---|---|---|
| OCP | α-TCP | 24 | S 6.5 | 4.67° | 0.32° | 18.92 |
| OCP | α-TCP | 24 | M 6.5 | 4.69° | 0.18° | 18.81 |
| OCP-CIT | α-TCP | 48 | S 6.5 | 4.05° | 0.74° | 21.79 |
| Mineralization conditions | Characterization results | ||||||
|---|---|---|---|---|---|---|---|
| Method | COLL | CIT | HyAc | Time (h) | pH | Phase assignment | 13C{31P} REDOR effects |
| CaCO3 | 5 | S 4.7 | DCPD | ||||
| CaCO3 | 5 | M 6.5 | OCP/minor CaCO3 | ||||
| CaCO3 | 24 | M 6.5 | OCP/minor CaCO3 | ||||
| CaCO3 | 48 | M 6.5 | OCP/minor HA | ||||
| CaCO3 | Y | 96 | S 7.0 | Nano-HA/minor OCP | |||
| α-TCP | 24 | M 6.5 | α-TCP/minor OCP | ||||
| α-TCP | 24 | S 6.5 | OCP/minor α-TCP | ||||
| α-TCP | Y | 48 | M 6.5 | CaCIT | |||
| α-TCP | Y | 48 | S 6.5 | OCP-CIT | Citrate–mineral | ||
| α-TCP | Y | Y | 96 | S 6.5 | OCP-CIT/minor HA-like | Minimal effects | |
| α-TCP | Y | Y | Y | 96 | S 6.5 | OCP-CIT/minor HA-like | Citrate–mineral & collagen–mineral |
- —Ernest Oppenheimer Studentship
Peer Reviews
No public reviews on file for this paper yet. If you reviewed it on a platform where reviews are public (OpenReview, ICLR, NeurIPS, ICML), you can paste yours below so the community can read it here.
Videos
No videos yet. Explain this paper in a talk, walkthrough, or lecture? Add one.
Taxonomy
TopicsBone Tissue Engineering Materials · Collagen: Extraction and Characterization · Polymer Surface Interaction Studies
Introduction
Bone is a complex hierarchical composite material with remarkable mechanical properties that arise from the intricate organization of its organic and inorganic components. At the nanoscale, bone consists of mineralized collagen fibrils in which nanoscopic calcium phosphate platelets are embedded both within and around the fibrils, forming an intimately integrated collagen–mineral interface [1]. This interface plays a crucial role in determining bone’s macroscopic mechanical properties, governing load transfer, toughness and resistance to fracture [2, 3]. Despite extensive research in biomaterials and bone tissue engineering, replicating the structure, composition and functionality of native bone in vitro remains a significant challenge. The development of accurate bone models would not only enhance our fundamental understanding of bone mineralization but also improve the design of bone graft materials and enable more physiologically relevant platforms for studying bone diseases.
Historically, hydroxyapatite (HA) has been the primary focus of bone biomimetics, given its chemical similarity to the mineral phase of bone. However, HA-based models fail to capture the full complexity of bone mineralization, particularly the carboxylate-rich, hydrated, disordered surface layer observed in natural bone. Recent advances in solid-state nuclear magnetic resonance (NMR) and electron microscopy have revealed that native bone mineral platelets possess an apatitic core surrounded by a disordered, hydrated, carboxylate-rich surface [4–12]. Citrate molecules, in particular, have been identified as key regulators of bone mineral properties, restricting the growth of calcium phosphate crystals and stabilizing the hydrated layer [5, 7, 13]. This understanding has led to the Duer bone mineral model [14], which proposes that bone mineral consists of alternating layers of ordered apatite and hydrated disordered regions enriched with citrate. To develop accurate in vitro bone models, it is therefore essential to replicate not only the apatitic core but also this hydrated, carboxylate-rich surface environment, a feature absent in conventional HA-based systems.
One promising approach to reproducing this structural complexity involves the use of octacalcium phosphate (OCP) and its carboxylate-substituted derivatives, such as citrate-incorporated OCP (OCP-CIT) [4]. OCP exhibits a layered structure with alternating apatitic and hydrated regions, making it an excellent analogue for the bone mineral model [15]. Moreover, OCP is a known precursor to HA, capable of undergoing epitaxial transformation under physiological conditions [16, 17]. However, some existing OCP synthesis methods are conducted at elevated temperatures [18], which are incompatible with the presence of collagen, as collagen denatures above 37°C. To enable the mineralization of collagen suspensions and the development of biomimetic bone models, OCP synthesis must therefore be adapted to physiological conditions.
Two synthesis routes have been explored in the literature for producing OCP and OCP-carboxylates: the reaction of calcium carbonate (CaCO_3_) with phosphoric acid [19] and α-tricalcium phosphate (α-TCP) [15, 20]. The presence of carbonate ions during OCP synthesis offered by the CaCO_3_ method may provide a route for carbonate substitutions, another key component of bone mineral. This method has primarily been conducted at 60°C, and lowering the synthesis temperature to 37°C can slow reaction kinetics and lead to the formation of undesired phases, such as dicalcium phosphate dihydrate (DCPD) and HA, unless pH is carefully controlled [21–23]. Conversely, the α-TCP hydrolysis method has been successfully implemented at 37°C [15, 20], but optimal pH conditions must be identified to ensure high phase purity and avoid the formation of unwanted byproducts such as calcium citrate.
Beyond synthesizing biomimetic minerals, a second critical challenge is integrating these minerals into collagen matrices to replicate the hierarchical structure of native bone. One promising approach to achieving this is electrophoretic deposition (EPD), a materials processing technique that enables the formation of dense, free-standing collagen films [24]. Unlike traditional vacuum-based methods, which risk collapsing the hydrated layers of OCP-CIT [4], EPD preserves the hydrated mineral surface, making it particularly well-suited for bone biomimetics [25]. However, successful EPD requires careful modulation of the mineral–collagen suspension properties, including zeta potential and conductivity, to ensure homogeneous deposition and prevent electrolysis-induced defects.
Hyaluronic acid (HyAc) emerges as a potential processing agent in this context. HyAc is a negatively charged glycosaminoglycan (GAG) present in the bone extracellular matrix (ECM), known to modulate mineralization [26], promote osteogenesis [27–29] and enhance cell response to biomaterials [27]. Previous studies have demonstrated that HyAc interacts with collagen fibrils through hydrogen bonding, altering their zeta potential and facilitating mineral nucleation and deposition [30, 31]. In collagen mineralization studies, polyanionic molecules such as poly-aspartic acid have been widely used to guide mineral infiltration into collagen fibrils, but the role of HyAc as a direct processing agent remains less explored. This study investigates whether HyAc can modulate the stability and charge of OCP-based collagen suspensions, thereby improving EPD efficiency and enhancing the formation of a biomimetic collagen–mineral interface.
This work aims to establish a unified approach that bridges fundamental mineral synthesis with applied biomaterial processing to develop an advanced bone-mimetic model. The study is structured around two key objectives: (1) Optimizing the synthesis routes of biomimetic OCP-based minerals under physiological conditions via pH control and synthesis time; (2) developing mineralized collagen films using EPD and establishing strategies to modulate the conductivity and zeta potential of mineralized collagen suspensions. We employ a suite of characterization techniques to verify phase purity, crystallinity and the successful incorporation of citrate in OCP. Notably, advanced NMR techniques allow us to shed light on the organization of the collagen–mineral–citrate interface of mineralized collagen films. By integrating biomimetic mineral synthesis with advanced materials processing, this work bridges the gap between fundamental chemistry and applied biomaterials research. The findings will advance bone grafting strategies, facilitate the development of bone disease models and contribute to the broader understanding of bone mineralization mechanisms.
Materials and methods
Reaction of CaCO3 with phosphoric acid
For the synthesis of OCP, CaCO_3_ (1.604 g) and orthophosphoric acid (0.6 mL) were added to deionized water (200 mL) with constant stirring at 500 rpm and maintained at 37°C in a water bath. The pH of the suspension was maintained at 6.5 by dropwise addition of 1 M hydrochloric acid. To synthesize OCP-CIT, citric acid (3.84 g) was dissolved in deionized water (200 mL) and the pH was adjusted to 7 using sodium hydroxide, prior to the addition of CaCO_3_ (1.604 g) and orthophosphoric acid (0.6 mL) to achieve a calcium-to-citrate concentration ratio of 1:1.25. After various synthesis times, the reaction product was gravity-filtered, washed with deionized water and air-dried.
Hydrolysis of α-TCP
For the synthesis of OCP, α-TCP (0.8 g, 8 g/L, Geistlich) was added to deionized water (100 mL) while stirring at 200 rpm and maintained at 37°C in a water bath for 24 h. For the synthesis of OCT-CIT, citric acid (2.643 g) was added to deionized water (55 mL) while stirring at 200 rpm and maintained at 37°C in a water bath, and the pH was adjusted to 5.52 using sodium hydroxide. α-TCP (0.836 g) was then added, and the suspension was left to stir for 48 h. Both reactions were conducted under two pH conditions: (1) initial pH adjustment to 6.50 and then uncontrolled; (2) a constant pH at 6.50 for the synthesis duration by dropwise addition of 1 M hydrochloric acid. The reaction product was gravity-filtered, washed with deionised water and air-dried.
Mineralizing collagen suspension
Two types of mineralized collagen film were produced, OCP-CIT/COLL and OCP-CIT/COLL/HyAc. The materials included within the mineralization suspension and steps taken for the preparation of EPD are outlined in Table 1 and detailed in subsequent sections.
Collagen suspension preparation
Collagen suspension (0.5 or 1 wt.%) was prepared by hydrating insoluble bovine dermal collagen (Devro) in 0.05 M acetic acid for 72 h at 4°C followed by homogenization using a blender. The homogenized slurry was dialyzed against deionized water for 48 h with 8 water changes and a suspension-to-water ratio of 1:20.
Collagen suspension mineralized with OCT-CIT
Citric acid (1.897 g) was added to collagen suspension (1 wt.%, 60 mL) under constant stirring at 37°C, and the pH was adjusted to 5.5 using sodium hydroxide. After stirring for 1 h, α-TCP powder (0.6 g, 10 g/L) was added to the collagen suspension and pH adjusted to 6.50 before stirring for 4 days. Following mineralization, the suspension was homogenized on ice (30 s). To adjust the conductivity and zeta potential of the suspension, HyAc sodium salt (streptococcus equi, 91%, Alfa Aesar, USA) was added to the suspension whilst stirring at 200 rpm for 1 h, reaching final concentrations of 0.25–1 mg/mL. It is worth noting that HyAc was only used as a processing agent for the subsequent EPD and not incorporated in the collagen–mineral interface due to the low temperature. The suspension was dialyzed against deionized water, causing swelling to 90 mL. About 0.5 wt.% collagen suspension (30 mL) was added to the dialyzed mineralized collagen, homogenized on ice (90 s) and centrifuged to allow the removal of excess water (30 mL), followed by homogenization on ice (30 s).
Collagen suspension mineralized with OCT-CIT and HyAc
Citric acid (1.897 g) was added to collagen suspension (1 wt.%, 60 mL) under constant stirring at 37°C, and the pH was adjusted to 5.5 using sodium hydroxide. After stirring for 1 h, HyAc sodium salt (0.03 g, 0.5 mg/mL) was added to the suspension to be incorporated in the collagen–mineral interface. After stirring for 1 h, α-TCP powder (0.6 g, 10 g/L) was added to the collagen suspension and pH adjusted to 6.50 before stirring for 4 days. Following mineralization, the suspension was homogenized on ice (30 s) and dialysed against deionized water. 0.5 wt.% collagen suspension (20 mL) was added to the dialysed mineralized collagen suspension whilst stirring and homogenized on ice (90 s).
EPD of mineralized collagen films
EPD was carried out in a custom-built EPD cell, as depicted in Figure 1, with a distance of 1.2 cm between 316 L stainless steel electrodes. A gelatine membrane (thickness = 85 µm) was suspended between nitrile butadiene rubber spacers at the centre of the EPD cell. The membrane was produced by air drying a 5 wt.% gelatine solution in a silicone mould. The gelatine solution was dialysed against deionized water before drying. A B2901A Source Meter Unit (Keysight Technologies) was connected to the electrodes as the voltage source. Equal volumes of mineralized collagen suspension and deionized water were pipetted into each compartment of the EPD cell. A voltage of 10 V was applied for 10 min after which the liquids were replenished, and the deposition was continued for another 10 min. Subsequently, the EPD cell was gently deconstructed and the collagen films deposited on the gelatine membrane were submerged in deionized water at 37°C for 1 h to remove the gelatine membrane. The released collagen films were gently rinsed with deionized water and air-dried.
Schematic of the EPD cell containing a suspended gelatine membrane separating the collagen suspension (cathode) and deionized water (anode).
X-ray diffraction
The minerals were ground in a pestle and mortar and mineralized collagen films were secured to sample holders using petroleum jelly for X-ray diffraction (XRD, Bruker D8 DAVINCI). XRD was carried out at an operating voltage of 40 kV, an X-ray wavelength of α1 = 1.54059744 Å, a current of 40 mA, a step size of 0.02° from 2θ = 3°–60° and a sample rotation speed of 30 rpm. Data were collected at constant sample length and the over-illumination error was corrected in DIFFRAC.EVA (Bruker) software. HighScore Plus (Malvern Panalytical, UK) was used to identify peaks in the XRD traces which were matched with the Inorganic Crystal Structure Database (ICSD) with reference patterns noted where appropriate. Rietveld refinement was applied to assess the phase purity of the samples.
Nuclear magnetic resonance
Solid-state NMR measurements were performed on a Bruker 400 MHz proton frequency (9.4 T) Avance spectrometer equipped with a standard double or triple resonance probe at frequencies of 400.3 MHz (^1^H), 162.1 MHz (^31^P) and 100.6 MHz (^13^C). Samples were packed in 4 mm zirconia rotors and rotated at a magic angle spinning (MAS) rate of 10 kHz at room temperature. The ^13^C measurements were referenced to methylene glycine signal at 43.1 ppm relative to tetramethylsilane at 0 ppm and ^31^P measurements were referenced to alendronate at 17.7 ppm, which corresponds to crystalline HA at 2.8 ppm relative to 85% phosphoric acid at 0 ppm. SPINAL64 decoupling was used during signal acquisition.
^31^P high power decoupling (HPDEC) was carried out at a ^31^P 90° pulse length of 3.5 µs with a 15 s recycle time.^31^P cross polarization (CP) was carried out at a ^1^H 90° pulse length of 2.5 µs, and the ^1^H–^31^P CP contact time was 2 ms with 5 s recycle delay.^13^C{^31^P} Rotational-Echo Double Resonance (REDOR) was carried out with 180° pulses of length 6.5 µs, 50 µs period and dephasing time of 2.9 ms for OCP-CIT samples and 9.9 ms for mineralized collagen samples. The power of the ^31^P pulses was set to zero in the reference spectrum.
Zeta potential and conductivity
Zeta potential and conductivity measurements were carried out using laser Doppler electrophoresis with a Zetasizer Nano-ZS (Malvern Instruments) at 25°C. Unless stated otherwise, values quoted were the average and standard deviation of 3 data sets for each sample. Conductivity measurements were undertaken using a Zetasizer Nano-ZS, with an accuracy of ±10%, which is higher than the standard deviation of the samples. Therefore, the errors were calculated using the manufacturer’s recommendations of ±10%.
Results
Synthesis of OCP and OCP-CIT minerals
The CaCO_3_ and α-TCP reaction methods were optimized to maximize phase purity of OCP and OCP-CIT before establishing the optimal method to produce these minerals at 37°C.
CaCO3 route
The synthesis of OCP at 37°C after 5 h resulted in the formation of DCPD when leaving the pH uncontrolled, as shown in Figure 2A. At this physiologically relevant temperature, DCPD formation was avoided by maintaining the pH at 6.50 for the duration of the synthesis. To improve the proportion of OCP in the samples, the synthesis time was increased from 5 h (Figure 2B, OCP % = 79.8 ± 2.8, N = 2) to 24 h (Figure 2C, OCP % = 89.6 ± 10.0, N = 2). Beyond this synthesis time, there were stronger reflections in the apatitic regions, suggesting potential transformation into HA (Figure 2D). To assess the crystallinity of OCP formation, the full-width half maximum (FWHM) of the OCP (1 0 0) reflection was measured, as shown in Table 2. This demonstrated a decrease in FWHM with increasing synthesis time, indicating an increase in crystallinity.
The XRD pattern of products from OCP (CaCO3 route) synthesis at 37°C, with noted pH conditions and synthesis time. With no pH adjustments, the synthesis temperature of 37°C resulted in DCPD formation (A). Maintaining the pH at 6.50 during synthesis resulted in OCP formation at 37°C, but the synthesis time required increased from 5 h (B) to 24 h (C) to ensure reaction completion. Beyond 24 h, HA contamination was observed (D). OCP-CIT formation was only observed after 4 days of hydrolysis, showing broad peaks (E). Due to OCP’s characteristic large (1 0 0) peak around 2θ = 4°, the pattern is shown on a magnified scale in the inset (left) for clarity. Reference patterns for CaCO3, DCPD, OCP and HA are shown in (F–I), respectively.
Continued.
Continued.
Continued.
Continued.
Continued.
The CaCO_3_ synthesis method was repeated in the presence of citrate with the aim of producing OCP-CIT, at 37°C for 1, 2 and 4 days, all with non-controlled pH. Before 4 days, very little, if any, precipitate was collected in the filter paper, suggesting the particles were too small. The XRD pattern of the samples collected on day 4 in Figure 2E shows broad peaks, indicating the formation of nanocrystalline HA. OCP and HA have similar crystal structures, resulting in overlapping reflections. However, the (1 −1 0) and (0 1 0) peaks align with the OCP XRD pattern, suggesting a minor OCP contribution.
α-TCP route
The hydrolysis of α-TCP to produce OCP and OCP-CIT was conducted under two pH conditions: a starting pH of 6.50 that was not controlled and a maintained pH of 6.50. The XRD patterns are shown in Figure 3. In the synthesis of OCP, this resulted in samples containing 35% OCP where the starting pH was 6.50 (Figure 3A) which increased to 89% when maintaining the pH at 6.50 throughout the synthesis (Figure 3B). The (1 0 0) reflection was also narrower when using a controlled pH, indicating greater crystallinity (Table 3).
The XRD patterns of products from an OCP and OCP-CIT (α-TCP) synthesis where the pH was either started at 6.50 or maintained at 6.50. In OCP syntheses, compared to the synthesis with a starting pH of 6.50 (A), the amount of unreacted α-TCP was greatly reduced when the pH was maintained at 6.50 (B). In OCP-CIT synthesis, the synthesis with a starting pH of 6.50 (C) produced OCP-CIT, whereas maintaining the pH at 6.50 (D) resulted in CaCIT contamination. In the non-controlled reactions, the final pH for OCP and OCP-CIT was 7.4 and 7–7.4, respectively. Due to OCP’s characteristic large (1 0 0) peak around 2θ = 4°, the pattern is shown on a magnified scale in the inset (left) for clarity. Reference patterns for α-TCP, OCP and CaCIT are shown in (E–G), respectively.
However, during the synthesis of OCP-CIT, using a starting pH of 6.50 produced an OCP-like phase in which the shifted reflection positions were consistent with citrate incorporation into the mineral structure (Figure 3C), whereas maintaining the pH led to contamination with calcium citrate (Figure 3D). The (1 0 0) peak shifted to a lower 2θ value than OCP, indicating an expanded lattice parameter, due to citrate incorporation within the crystal structure (Table 3). The broadening of the (1 0 0), (1 −1 0) and (0 1 0) peaks demonstrated a greater disorder in the OCP-CIT crystal structure compared to OCP. This disorder, and the significant difference compared to OCP, meant that the normal use of Rietveld analysis for these XRD patterns was not possible. The analysis required a well-defined phase including the locations of atoms within crystal structure. However, the presence of OCP peaks and lack of α-TCP peaks are consistent with OCP formation, although minor contributions from other phases, such as HA, cannot be entirely ruled out.
NMR assessment of synthesized minerals
The OCP produced via the CaCO_3_ and α-TCP routes was compared using NMR experiments to assess their phosphorus environments. The ^31^P HPDEC experiment magnetizes the ^31^P environments whilst high-power ^1^H decoupling removes the ^1^H–^31^P relaxation pathway. Hence, the signals in this experiment are directly proportional to the number of phosphorus atoms in each environment. The ^31^P CP experiment increases the signal from ^31^P by transferring the magnetization from ^1^H through their dipolar coupling over a range of contact times, with shorter contact times increasing the signal of ^31^P close to ^1^H. As shown by the ^31^P HPDEC and CP in Figure 4A–D, the α-TCP route produced OCP with significantly higher crystallinity than the CaCO_3_ route, as evidenced by the reduced peak broadness and greater signal resolution. Figure 4C displays some minor peaks not present in Figure 4D, which were due to a trace quantity of unreacted α-TCP. Therefore, the α-TCP route was selected for OCP-CIT synthesis and collagen mineralization.
NMR evaluation of synthesized OCP and OCP-CIT minerals. The 31P HPDEC (left) and 31P CP (right, 2 ms contact time) spectra of: (A, B) OCP (CaCO3 route) 37°C 24 h; (C, D) OCP (α-TCP route) with pH maintained at 6.50; (E, F) OCP-CIT (α-TCP route) with a starting pH of 6.50 and (G) the 13C{31P} REDOR experiment (reference = blue, dephased = red) of OCP-CIT (α-TCP route, dephasing time = 2.9 ms). the α-TCP produced OCP minerals with significantly higher crystallinity.
NMR also confirmed and established the impact of citrate incorporation within the OCP structure. The ^31^P HPDEC and CP spectra of OCP-CIT (Figure 4E and F) show broader ^31^P environments and fewer resolved peaks than those of OCP, indicating greater structural disorder and loss of lattice symmetry due to citrate incorporation. ^13^C{^31^P} REDOR experiments also confirmed citrate incorporation within the OCP structure (Figure 4G). The experimental results indicate ^13^C–^31^P dipolar coupling, which is inversely proportional to the internuclear distance. The dipolar coupling reduces the intensities of carbon atoms in close proximity to phosphorus atoms. The experiment includes two parts: the reference, where the dipolar coupling is not reintroduced, and the dephased, where the dipolar coupling is reintroduced, allowing dephasing via this mechanism. Therefore, reduced signals in the dephased spectra indicate ^13^C environments close to ^31^P. The signals from OCP-CIT showed a reduced dephased signal, confirming their incorporation within the mineral structure.
Optimizing mineralized collagen suspension for EPD
The zeta potential and conductivity of the mineralized collagen suspension were first established and modified to achieve the properties required for EPD to produce mineralized collagen films.
Effect of dialysis
Immediately after mineralizing collagen suspension with OCP-CIT (OCP-CIT/COLL), the suspension was unstable with a tendency to flocculate, due to low zeta potential and high conductivity. During EPD, these properties would result in inhomogeneous films, a slow deposition rate and high electrolysis rates at the electrodes, leading to bubble damage to the films. Dialysing the OCP-CIT/COLL suspension against DI water significantly reduced the conductivity of the suspension, whilst the zeta potential remained relatively unchanged, as shown in Figure 5A and B. Despite the strong diffusion gradient applied during dialysis, the citrate remained incorporated within the mineral, as evidenced by the lower signal intensity in dephased spectra compared to the reference spectra in the REDOR experiment shown in Figure 5C. Additionally, the crystal structure retained the OCP-like phase following dialysis, as shown in the XRD pattern in Figure 5D compared to Figure 3C. However, the position of the (1 0 0) peak shifted to a higher 2θ value after dialysis, associated with a smaller lattice parameter (22.43 Å before dialysis and 21.88 Å after dialysis) likely due to the loss of citrate molecules from the OCP unit cell.
The zeta potential (A) and conductivity (B) of OCP-CIT/COLL suspension before and after dialysis against DI water (N = 1 measured three times). (C) The 13C{31P} REDOR of OCP-CIT before and after dialysis against DI water with reference = blue and dephased = red. (D) The XRD pattern of OCP-CIT after dialysis.
Effect of HyAc
The addition of HyAc significantly reduced the zeta potential of OCP-CIT/COLL suspension with only small increases in conductivity, as shown in Figure 6A. A concentration of 0.5 mg/mL HyAc was found to significantly decrease the zeta potential of collagen suspensions across a range of pH values (Figure 6B). Accordingly, the presence of HyAc resulted in a collagen–HyAc suspension with a more negative overall charge during the mineralization process. The addition of HyAc (0.5 mg/mL) either before or after mineralization did not significantly alter the resultant zeta potential nor did the addition of collagen slurry to the mineralized collagen suspensions which improved the stability of the suspension (Figure 6C).
HyAc can stabilize mineralized collagen suspension. (A) The effect of HyAc as a processing agent on the zeta potential (blue) and conductivity (orange) of OCP-CIT/COLL suspension. (B) The zeta potential of collagen slurry (blue) and collagen slurry with HyAc (0.5 mg/mL, orange) over a range of pH. (C) The zeta potential of OCP-CIT/COLL (blue) and OCP-CIT/COLL/HyAc (orange) without (unshaded) and with (shaded) additional collagen slurry (N = 2 measured three times each).
Evaluation of bone model
The composition and collagen–mineral interface in these films were analysed using XRD and NMR techniques to establish the impact of HyAc during collagen mineralization and the success of bone model production. The XRD patterns in Figure 7A–C reveal some differences between the peaks in OCP-CIT mineral and the mineralized collagen films: slight shift in (1 0 0) reflections, broader (1 0 0) reflections in mineralized collagen films and reduced intensity of peaks at higher 2θ values. The (1 0 0) reflections were 3.91°, 4.10° and 4.05° for OCP-CIT/COLL film, OCP-CIT/COLL/HyAc film and OCP-CIT mineral, corresponding to lattice parameters of 22.6, 21.5 and 21.8 Å, respectively. The broad peaks in the films’ patterns were due to collagen. The reduced intensity is explained by the fixed knife edge used during XRD characterization of the mineralized collagen films, which reduced sample illumination at higher 2θ values. Generally, the XRD patterns showed no significant difference in crystal structure when HyAc was incorporated at the collagen–mineral interface. There were some minor phases also present in the mineralized collagen films: three peaks of HA and CaCIT contamination in the OCP-CIT/COLL films.
Mineralized collagen films contain bone-like collagen–mineral interfaces. XRD patterns of OCP-CIT/COLL film (A), OCP-CIT/COLL/HyAc film (B) and OCP-CIT mineral (C), where the reflections for OCP-CIT, HA, CaCIT and collagen were indicated by black, blue, orange and pink arrows, respectively. Due to OCP’s characteristic large (1 0 0) peak around 2θ = 4°, the pattern was split for clarity. 31P HPDEC spectra of OCP-CIT/COLL film (D), OCP-CIT/COLL/HyAc film (E) and OCP-CIT mineral (F), illustrating deconvolution into two fitted peaks (blue) and the overall fit (red). 13C{31P} REDOR of OCP-CIT/COLL film (G) and OCP-CIT/COLL/HyAc film (H), with the reference spectra in blue and dephased spectra in red. The regions showing REDOR effects are noted in (H).
The mineral component of the films was also analysed using ^31^P NMR experiments, which revealed information on phosphate environments. The ^31^P HPDEC of OCP-CIT/COLL and OCP-CIT/COLL/HyAc shown in Figure 7D and E were similar: a peak containing an upfield shoulder. In comparison, the OCP-CIT spectrum contained two peaks in its ^31^P HPDEC: a dominant peak attributed to apatitic orthophosphates and a smaller, upfield peak assigned to hydrated orthophosphates and hydrogen phosphates. Deconvolutions of the spectra revealed that in the OCP-CIT mineral, ∼58% of ^31^P environments were apatitic orthophosphates, which increased to ∼74% in mineralized collagen films. Therefore, the reduced upfield peak in the mineralized collagen film spectra is consistent with a greater proportion of apatitic orthophosphates and may indicate the presence of minor HA-like environments.
The collagen–mineral interface, crucial to the properties of bone, is as important as the components themselves. The impact of HyAc on the collagen–mineral interface was evaluated using ^13^C{^31^P} REDOR experiments, as shown in Figure 7G and H. The strongest peaks are from glycine, proline and hydroxyproline amino acids, which comprise the majority of collagen residues. The OCP-CIT/COLL film did not show significant REDOR effects in regions associated with collagen or even between HyAc or citrate and mineral. In contrast, the OCP-CIT/COLL/HyAc film showed strong REDOR effects across all chemical environments, including citrate, HyAc, carbonate, as well as all the amino acids related to collagen, indicating a close arrangement between mineral and collagen. This reflects the role of HyAc in promoting mineralization in very close proximity to collagen.
Scanning electron microscopy (SEM) imaging of the OCP-CIT/COLL/HyAc films (Supplementary Figure S1) revealed regions consistent with collagen-associated mineral alongside areas of extrafibrillar mineral on the film surface. While these images support the presence of mineralized collagen fibrillar features, higher-resolution imaging would be required to definitively confirm intrafibrillar mineralization.
Discussion
Synthesis of OCP and OCP-CIT minerals
The successful synthesis of phase-pure OCP and OCP-CIT under physiological conditions (37°C) highlights the critical role of pH control and reaction kinetics in directing mineral phase formation. A summary of all mineralization conditions, phase assignments and characterization outcomes is provided in Table 4. For the CaCO_3_ route, maintaining a pH of 6.50 and extending the synthesis time to 24 h were essential to avoid DCPD formation and ensure complete hydrolysis. These observations align with Monma’s findings, where alkaline pH and low temperatures favour OCP over DCPD [22]. However, attempts to synthesize OCP-CIT via this route exhibited broad XRD peaks, raising ambiguity in phase assignment. While the (1 −1 0) and (0 1 0) reflections aligned with OCP, the expanded (1 0 0) lattice parameter (∼26 Å vs. literature values of 20.5–21.99 Å [20, 23]) and peak broadening could reflect either citrate-induced disorder or, more likely, nanocrystalline HA formation [32]. Citrate’s strong chelation with calcium ions likely slowed reaction kinetics, stabilizing smaller crystallites and broadening XRD patterns [33, 34]. This aligns with Davies et al., who noted reduced crystallinity in OCP-CIT due to citrate incorporation [4, 20].
In contrast, the α-TCP route produced higher-purity OCP (89% phase purity) when pH was maintained at 6.50, likely due to enhanced α-TCP dissolution and calcium/phosphate ion availability [35]. However, maintaining pH during OCP-CIT synthesis led to CaCIT contamination, whereas starting at pH 6.50 without control yielded an OCP-like phase in which the shifted reflection positions were consistent with citrate incorporation into the mineral structure. This discrepancy arises from the interplay between citrate speciation and pH: higher pH promotes citrate deprotonation, increasing calcium citrate complexation [36]. The non-controlled synthesis’s final pH (7–7.4) likely favoured OCP-CIT nucleation over CaCIT, as thermodynamic driving forces for OCP increase with alkalinity [37]. NMR confirmed citrate incorporation via reduced ^31^P peak resolution in OCP-like phase and ^13^C{^31^P} REDOR dephasing, consistent with the literature [20]. Notably, the α-TCP route’s superior crystallinity (narrower XRD peaks and resolved NMR signals) and high purity were considered to be more suitable for collagen mineralization with the intended purpose of producing a bone model.
Optimizing mineralized collagen suspensions for EPD
To enable EPD of dense mineralized collagen films, suspension conductivity and zeta potential required careful modulation. Initial mineralized collagen suspensions exhibited high conductivity (∼30 mS/cm) due to residual ions, which dialysis effectively reduced to ∼0.01 mS/cm without citrate leaching, as confirmed by retained REDOR signals. However, the suspension zeta potential remained near collagen’s isoelectric point (pH 7–7.4), leading to suspension instability. The addition of HyAc proved pivotal: it lowered the zeta potential of the collagen suspension (from −5 mV to −25 mV at 0.5 mg/mL) likely through interactions with collagen via hydrogen bonding, enhancing fibril charge homogeneity [30]. Crucially, neither HyAc nor the dialysis procedure altered phase assignment but improved EPD efficiency by mitigating against electrolysis-induced film damage, enabling uniform film deposition.
Mineralized collagen films as bone analogues
Collagen–mineral interface and citrate’s dual role
The mineralized collagen films exhibited a structural transition from OCP-CIT to apatitic orthophosphates, as evidenced by ^31^P NMR (∼74% apatitic vs. 58% in OCP-CIT). This mirrors the Duer bone mineral model, where alternating OCP/HA layers form during maturation [4]. Collagen fibrils likely accelerated this transformation by providing nucleation sites, as observed in native bone [38]. However, citrate alone failed to establish a significant collagen–mineral interface in this work. Despite citrate’s theorized role in directing mineral deposition via electrostatic interactions, its high chelation capacity (CIT/Ca ratio ∼1.7) likely inhibited calcium ion availability, limiting intrafibrillar mineralization, consistent with studies showing mineral inhibition at CIT/Ca > 0.8 [39, 40].
Interestingly, despite XRD and NMR experiments indicating the presence of OCP-CIT, OCP-CIT/COLL did not show a significant interface between the citrate and mineral. Potentially, the citrate molecules had increased mobility, which reduced the REDOR effects [41]. Alternatively, a substantial proportion of citrate may have bound to the collagen fibrils, possibly due to its small size, enabling penetration into intrafibrillar spaces [42], and electrostatic interactions between the negatively charged citrate ions and positively charged regions on the collagen fibrils [43, 44].
Synergistic role of HyAc in collagen mineralization
The inclusion of HyAc with citrate during collagen mineralization proved transformative. REDOR experiments revealed strong ^13^C–^31^P coupling in OCP-CIT/COLL/HyAc films, indicating close proximity between both mineral and citrate, and mineral and collagen, consistent with intimate collagen-associated mineralization and suggestive of possible intrafibrillar mineral formation. HyAc’s anionic charge likely facilitated calcium ion binding near collagen fibrils, creating localized supersaturation and directing mineral nucleation towards collagen-associated domains [31]. This work agrees with the results from Shao et al., which found that an anionic polymer was required to facilitate intrafibrillar mineralization in the presence of citrate ions [45]. The synergy between citrate and HyAc mirrors the function of non-collagenous proteins like poly-aspartic acid in vivo, suggesting HyAc can serve as a biomimetic alternative.
Implications for bone biomimetics
The successful integration of OCP-CIT and collagen via EPD addresses a critical gap in bone analogue development. Conventional HA-based models lack the hydrated, citrate-rich surface layer essential for bone’s mechanical resilience. By replicating both the apatitic core (via OCP-CIT) and the disordered surface (via citrate and HyAc), this work advances towards a physiologically relevant bone model. Furthermore, the use of EPD under mild conditions preserves mineral hydration, a key advantage over vacuum-based methods.
Conclusion
This study successfully demonstrates the development of biomimetic OCP-CIT–collagen films as advanced bone analogues through the integration of pH-controlled mineral synthesis and EPD. By optimizing the hydrolysis of α-TCP under physiological conditions with precise pH regulation, OCP and OCP-CIT were synthesized, replicating bone’s hydrated, carboxylate-rich mineral interface. HyAc played a pivotal role in stabilizing mineralized collagen suspensions and promoting collagen mineralization. The resultant OCP-CIT/COLL/HyAc films exhibited a collagen–mineral architecture, dominated by apatitic orthophosphates, with citrate templating mineral nucleation and HyAc synergistically facilitating mineral–collagen interactions. While the films showed features of intrafibrillar mineralization, confirmation of such a hierarchical structure requires high-resolution imaging. This approach overcomes the limitations of HA-based models by emulating both the apatitic core and disordered surface of native bone minerals, offering a physiologically relevant platform for bone grafts and disease studies. Collectively, this work bridges fundamental chemistry and biomaterials engineering, providing a scalable film-based strategy to mimic bone’s complexity at the nanoscale and advance regenerative tissue research.
Supplementary Material
rbaf136_Supplementary_Data
The reference list from the paper itself. Each links out to its DOI / PubMed record.
- 1Weiner S , Wagner HD. The MATERIAL BONE: structure–mechanical function relations. Annu Rev Mater Sci 1998;28:271–98.
- 2Jäger I , Fratzl P. Mineralized collagen fibrils: a mechanical model with a staggered arrangement of mineral particles. Biophys J 2000;79:1737–46. 11023882 10.1016/S 0006-3495(00)76426-5PMC 1301068 · doi ↗ · pubmed ↗
- 3Kinney JH , Habelitz S, Marshall SJ, Marshall GW. The importance of intrafibrillar mineralization of collagen on the mechanical properties of dentin. J Dent Res 2003;82:957–61. 14630894 10.1177/154405910308201204 · doi ↗ · pubmed ↗
- 4Davies E , Müller KH, Wong WC, Pickard CJ, Reid DG, Skepper JN, Duer MJ. Citrate bridges between mineral platelets in bone. Proc Natl Acad Sci U S A 2014;111:E 1354–63. 24706850 10.1073/pnas.1315080111 PMC 3986129 · doi ↗ · pubmed ↗
- 5Nikel O , Laurencin D, Bonhomme C, Sroga GE, Besdo S, Lorenz A, Vashishth D. Solid state NMR investigation of intact human bone quality: balancing issues and insight into the structure at the organic–mineral. J Phys Chem C Nanomater Interfaces 2012;116:6320–31. 22822414 10.1021/jp 2125312 PMC 3399594 · doi ↗ · pubmed ↗
- 6Rai RK , Sinha N. Dehydration-induced structural changes in the collagen–hydroxyapatite interface in bone by high-resolution solid-state NMR spectroscopy. J Phys Chem C 2011;115:14219–27.
- 7Hu Y-Y , Rawal A, Schmidt-Rohr K. Strongly bound citrate stabilizes the apatite nanocrystals in bone. Proc Natl Acad Sci U S A 2010;107:22425–9. 21127269 10.1073/pnas.1009219107 PMC 3012505 · doi ↗ · pubmed ↗
- 8Wu Y , Ackerman JL, Kim H, Rey C, Barroug A, Glimcher MJ. Nuclear magnetic resonance spin‐spin relaxation of the crystals of bone, dental enamel, and synthetic hydroxyapatites. J Bone Miner Res 2002;17:472–80. 11874238 10.1359/jbmr.2002.17.3.472 · doi ↗ · pubmed ↗