The impact of time to diagnosis on health service use, cost, and quality of life for patients with juvenile idiopathic arthritis: a cost-utility analysis
Amy Von Huben, Diana M. Bond, Samantha Lain, Davinder Singh-Grewal, Ruth Colagiuri, Stephen Colagiuri, Natasha Nassar

TL;DR
Delays in diagnosing juvenile arthritis increase healthcare costs and reduce quality of life, but timely diagnosis saves money and improves outcomes.
Contribution
This study quantifies the economic and quality-of-life benefits of timely diagnosis of juvenile idiopathic arthritis.
Findings
Timely diagnosis within 6 months reduces healthcare costs by over $10,000 annually per child.
Early diagnosis improves health-related quality of life by 0.14 utility units.
Lifetime cost savings from timely diagnosis reach $208,458 per child.
Abstract
Timely referral and diagnosis of Juvenile Idiopathic Arthritis (JIA) by a pediatric rheumatologist ensures early intervention to minimize long-term joint damage and disability. This study aimed to quantify the impact of delays in diagnosis on health service use, health-related quality of life (HRQoL) and associated costs to the health system. A cost-utility analysis was conducted over a lifetime horizon from a health funder perspective in 2023 Australian dollars, comparing time from actively seeking treatment to formal diagnosis (< 6 months, 6 + months). Time to diagnosis, healthcare use, including medical investigations, health professional visits, hospitalizations and medications, was determined using The IMPACT Survey. Incremental costs were estimated by applying Australian government subsidy item costs (medications), schedule fees (medical services), and National Efficient Prices…
Genes, proteins, chemicals, diseases, species, mutations and cell lines named across the full text — each resolved to its canonical identifier and authoritative record.
Click any figure to enlarge with its caption.
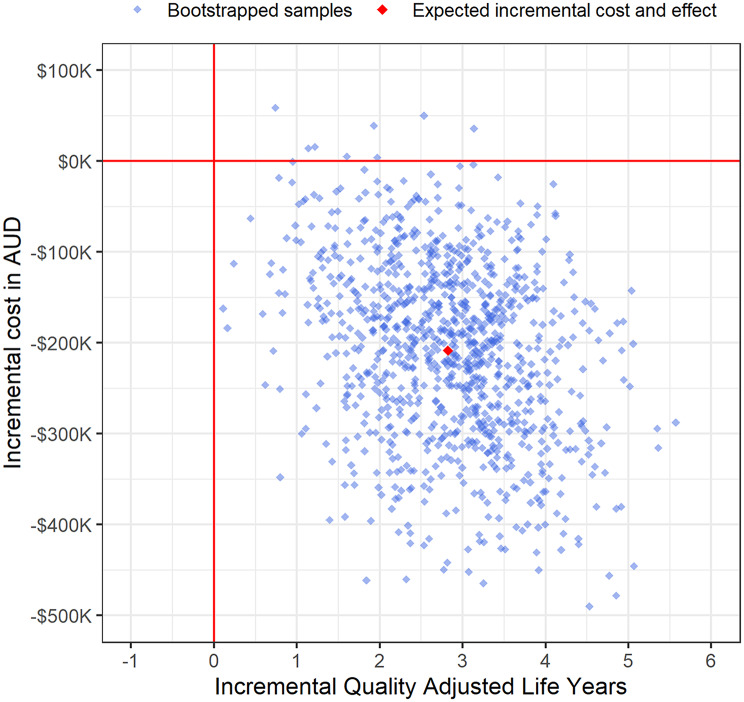 Figure 1
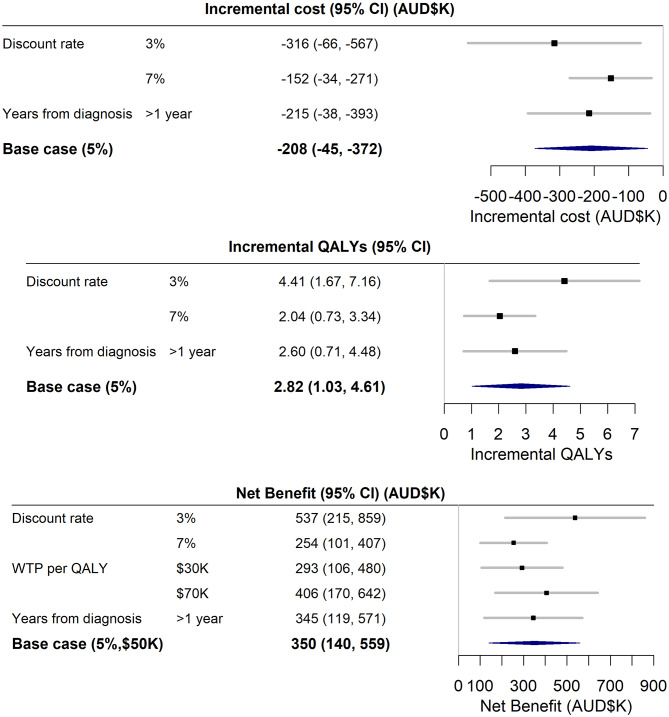 Figure 2
- —National Health and Medical Research Council MRFF Grant
- —philanthropic donation
- —NHMRC Investigator Grant
- —Financial Markets Foundation for Children
Peer Reviews
No public reviews on file for this paper yet. If you reviewed it on a platform where reviews are public (OpenReview, ICLR, NeurIPS, ICML), you can paste yours below so the community can read it here.
Videos
No videos yet. Explain this paper in a talk, walkthrough, or lecture? Add one.
Taxonomy
TopicsAutoimmune and Inflammatory Disorders Research · Adolescent and Pediatric Healthcare · Rheumatoid Arthritis Research and Therapies
Background
Juvenile Idiopathic Arthritis (JIA) is an inflammatory arthritis of unknown cause and onset before 16 years of age that persists for at least six weeks and comprises 80% of all Childhood Rheumatic Diseases [1]. Although JIA incidence has been reported to range widely, 1.6–23 per 100,000 [2], recent population-based register studies using the International League of Associations for Rheumatology (ILAR) classification criteria have estimated annual incidence in the range of 24.1 [3]–31.7 [4] per 100,000; similar to childhood diabetes [5], yet there is less political, community, and health professional awareness of the impact of JIA on individuals, families, and health systems.
JIA is characterised by joint pain, swelling and inflammation, which, without timely referral to a Pediatric Rheumatologist (PR) for aggressive intervention with disease-modifying drugs, can lead to long-term joint damage and disability [6–9]. Timely diagnosis also aids appropriate management of co-morbidities such as uveitis, preventing vision loss [1]. Large longitudinal studies of health-related quality of life (HRQoL) in the era of biologic treatments for JIA have shown that a longer time to diagnosis predicts a poorer HRQoL trajectory over the first three years post-diagnosis [10], which is the median time to reach maximal HRQoL once on treatment [10, 11]. This early decrement in HRQoL continues into adulthood, where pain intensity, active joints, and physical disability within the first three years are early predictors of physical limitations, pain, and poorer physical HRQOL after 19 years [11]. Chronic pain, even for those in remission, most likely from radiological damage before treatment, reduces long-term HRQoL and increases long-term health system costs, particularly for joint replacement surgery [12], strengthening calls for earlier diagnosis. The findings highlight the importance of early diagnosis and treatment of JIA to prevent lifetime decrements in HRQoL and health system costs.
Despite clinical guidelines recommending that a child with suspected JIA should be assessed by a PR within 10 weeks (2.3 months) of symptom onset [13], a 2020 international systematic review found the pooled median time from symptom onset to first PR assessment was 5.8 (95% CI 5.3, 6.3) months [14]. The delay in diagnosis [14–16] of JIA and the drivers of this delay [1, 8, 14, 16, 17] have been well documented. However, to our knowledge no studies have quantified the incremental impact of the delay in diagnosis on a child’s health-related quality of life HRQoL (physical, psychological, and social functioning) and health system costs for use by policy makers and health funders. This quantification work is essential to provide impetus to fund interventions to improve time to diagnosis.
An online national survey, The IMPACT Survey [18], was undertaken among Australians with JIA and their families from February to June 2023, to capture the experience of diagnosis, treatment, healthcare access and interactions, and to measure HRQoL and the financial costs associated with treatment and care. The survey identified for the first time that HRQoL for Australian children with JIA was lower than that of children with epilepsy or Type 1 diabetes [18]. The survey also confirmed that health system costs associated with the condition were high, and the average time to diagnosis for JIA was 11 months [18], eight months longer than the recommended standard [13]. However, there was no assessment of whether the time to diagnosis had a significant impact on HRQoL and health system costs.
The aims of this study are twofold: (1) To quantify the relationship between time to diagnosis and its impact on HRQoL, Quality Adjusted Life Years (QALYs), and health system costs, and (2) Estimate the net benefit in dollars to healthcare funders of timely diagnosis. This study differs from a typical cost-utility analysis in that it does not evaluate a particular intervention for cost-effectiveness. Rather, the health economic modelling undertaken in this paper provides health funders and policy makers with an estimate of the dollar cost (QALYs forgone and health system costs) per person of a delayed JIA diagnosis, or alternatively, the threshold (or maximum) funds per person that can be spent on a particular intervention to improve time to diagnosis. The paper shows how the threshold, along with estimates of the children affected in the relevant country, can be used to set a budget for improving time to diagnosis. Finally, with the inclusion of the funds required per-person to implement a particular intervention, the cost-utility and cost-benefit of any intervention to improve time to diagnosis for children with JIA to within six months of actively seeking treatment can be evaluated with the estimates provided in this paper.
Methods
Study population
Australians aged up to 25 years with JIA diagnosed before age 16 and their families were recruited through consumer organisations and paediatric rheumatology services and completed the IMPACT Survey between February and June 2023. Detailed methods are published elsewhere [18]. Ethics approval was obtained from The University of Sydney Human Research Ethics Committee (HREC: 2022/902).
Data collection
The IMPACT Survey was designed and piloted by a multidisciplinary team of researchers with expertise in child/adolescent health research, members of the Australian Paediatric Rheumatology Group, and people with lived experience of JIA. It was administered online via REDCap as a one-time, cross-sectional survey. The survey collected information on sociodemographic and clinical characteristics, process of diagnosis, healthcare interactions, treatment, physical and mental health, social/family impact, government and out-of-pocket costs and health-related quality of life. Parents/carers and children/young people (hereafter referred to as children/child) were encouraged to complete the survey together, and more than half the participants (54%) reported they completed the validated quality of life measures together, which did not differ by time to diagnosis groups (p = 0.3).
Time to diagnosis measure
Respondents were asked to estimate the time from actively seeking treatment to formal diagnosis of JIA, which was captured in categories of < 1, 1–2, 3–5, 6–8, 9–12 months, and 1–2, 3–4, > 5 years for all participants. Respondents were also asked to report age at symptom onset and age at diagnosis, which were captured in months for children aged ≤ 1 year, in half years for those participants aged ≤ 4 years, and in full years for children > 5 years. Time from symptom onset to diagnosis was then calculated using these ages. The two time to diagnosis measures had a high linear (Pearson) correlation, 80% (95%CI 75%, 85%). Given that the time from actively seeking treatment was more granular, this was chosen as our measure of time to diagnosis. Based on previous systematic review [14], and clinical feedback from pediatric rheumatologists on the window of opportunity to prevent long-term joint damage and disability, it was decided to compare outcomes for children diagnosed < 6 months versus 6 + months from actively seeking treatment.
Outcome measures
Health-related quality of life (HRQoL) was assessed using the Child Health Utility Instrument (CHU9D) [19]. CHU9D uses a 5-point scale across nine specific domains. Australian preference weights were used to transform CHU9D scores into utility values ranging between 1.00 (perfect health) to zero (being dead) [20]. Utility values allowed for the estimation of Quality-Adjusted Life Years (QALYs) for participants, enabling cost-utility and cost-benefit analyses to be conducted.
Annual government healthcare costs were estimated based on participant responses to the IMPACT survey on healthcare use, including medical investigations, health professional visits, hospitalizations and medications. Costs were estimated by applying Australian government subsidy item costs (medications) [21], schedule fees (medical services) [22], and National Efficient Prices (hospital stays) [23]. The net benefit in dollars was estimated using the present value of incremental healthcare costs plus the willingness to pay for one QALY multiplied by the present value of incremental QALYs.
Analysis
Statistical analysis
Descriptive statistics were calculated and comparisons made between sociodemographic and clinical characteristics of survey participants by time to diagnosis (< 6 months versus 6 + months) using chi-squared tests for categorical data and t-tests for continuous variables. Linear regression was conducted to estimate the relationship between time to diagnosis and the main outcome measures of HRQoL and annual government healthcare costs. Given the cross-sectional nature of the survey, additional analysis was conducted using multivariable generalized additive models to take into account non-linearity of age, and potential confounding by age, gender and time from diagnosis to survey completion and potential interaction by age-gender or time from diagnosis to survey completion and time to diagnosis to ensure inferences were robust.
Economic analysis
A cost-utility analysis was conducted over a lifetime horizon from a health funder perspective in 2023 Australian dollars, comparing time from actively seeking treatment to diagnosis (< 6 months, 6 + months). A lifetime horizon was chosen for this analysis, given that those with delayed diagnosis were more likely to suffer lifelong disability, less likely to gain treatment-free remission, and more likely to require care into adulthood [7]. Each participant’s Quality Adjusted Life Years (QALYs) were estimated using their life expectancy [21] and multiplied by their CHU9D utility value. Costs and QALYs were present valued over a lifetime horizon using a 5% per annum discount rate [24]. The net benefit in dollars per child of an earlier diagnosis was calculated using each participant’s present valued QALYs and health system costs, and the generally accepted willingness to pay of 50,000 for one QALY in Australia [[25](#CR25)]. One-way sensitivity analyses were also conducted for robustness: (1) Discount rates 3% and 7%, (2) Willingness to pay for one QALY (30,000, $70,000), and (3) Removing participants completing the survey within one year of diagnosis to remove any short-term treatment effects on HRQoL and costs within the first year of treatment. A pre-defined economic analysis plan was followed (Additional file 1), and the analysis is reported in accordance with the Consolidated Health Economic Evaluation Reporting Standards (CHEERS) checklist [26] (Additional file 2). All statistical and economic analyses were performed using R (ver. 4.4.1)(R Core Team 2023) [27] packages Gmisc for plot and table output [28], forestplot [29] and knitr (Xie 2023) [30] for reproducible research and results with P-values < 0.05 were considered statistically significant.
The study was approved by The University of Sydney Human Research Ethics Committee (HREC: 2022/902).
Results
Of the 184 IMPACT survey participants with JIA, 163 (89%) were included based on those who had completed the CHU9D instrument. Participants missing CHU9D were almost equally distributed between the time to diagnosis groups (< 6 months: n = 14/116 (12%); 6 + months: n = 7/68 (10%)) with no systematic difference in characteristics to those with completed CHU9D. Survey participants ranged from having been just diagnosed to 21 years after diagnosis, but were concentrated in the first five years post-diagnosis, median (interquartile range) 4.5 (1.9–8.4) years (Table 1). Most importantly, the time from diagnosis to completing the survey did not differ significantly between diagnosis groups (p = 0.14) (Table 1). Compared to those diagnosed 6 + months after actively seeking treatment, those diagnosed < 6 months were younger at symptom onset, mean(SD) 4.4(3.8) versus 5.7(3.6) years; p = 0.03, at diagnosis, and at survey completion, mean(SD) 11.0 (5.2) versus 12.8 (4.8), p = 0.03 (Table 1). There was no evidence of a relationship between time to diagnosis and gender, ethnicity, location (state/territory), parental education, socioeconomic status, rurality or any other clinical condition (all p > 0.05), except uveitis (p = 0.001), which is known to be positively associated with an earlier diagnosis [14] ] (Table 1).
Table 1. Demographic and clinical characteristics of survey participants by time to diagnosisDemographic and clinical characteristicsTime to diagnosis in monthsTotalN = 163P value^**^< 6N = 1026 + N = 61 Age at symptom onset in years
0.028 Mean (SD)4.4 (± 3.8)5.7 (± 3.6)4.9 (± 3.8) Median (IQR)3.0 (1.5–6.0)5.0 (2.0–9.0)4.0 (2.0–7.0) Age at diagnosis in years
< 0.001 Mean (SD)4.7 (± 3.9)7.6 (± 3.8)5.8 (± 4.1) Median (IQR)3.0 (2.0–6.0)7.0 (4.0–11.0)5.0 (2.0–9.0) Age at survey in years
0.032 Mean (SD)11.0 (± 5.2)12.8 (± 4.8)11.7 (± 5.1) Median (IQR)10.3 (7.0–14.9)12.9 (9.5–16.0)11.8 (7.6–15.5) Time from diagnosis to completing survey in years
0.14 Mean (SD)6.3 (± 4.9)5.1 (± 4.8)5.8 (± 4.9) Median (IQR)5.6 (1.8–8.6)3.4 (1.9–5.9)4.5 (1.9–8.4) Gender
0.78 Male30 (29.4%)20 (32.8%)50 (30.7%) Female72 (70.6%)41 (67.2%)113 (69.3%) Ethnicity
0.37 White/European82 (80.4%)53 (86.9%)135 (82.8%) Aboriginal Australian/Torres Strait Islander4 (3.9%)1 (1.6%)5 (3.1%) Asian5 (4.9%)5 (8.2%)10 (6.1%) Middle Eastern7 (6.9%)1 (1.6%)8 (4.9%) Other4 (3.9%)1 (1.6%)5 (3.1%) Australian State or Territory
0.36 Australian Capital Territory4 (3.9%)3 (4.9%)7 (4.3%) New South Wales62 (60.8%)29 (47.5%)91 (55.8%) Queensland10 (9.8%)12 (19.7%)22 (13.5%) South Australia11 (10.8%)5 (8.2%)16 (9.8%) Tasmania1 (1.0%)2 (3.3%)3 (1.8%) South Australia7 (6.9%)7 (11.5%)14 (8.6%) Western Australia7 (6.9%)3 (4.9%)10 (6.1%) Parental education (highest level)
0.55 Did not complete high school4 (3.9%)3 (4.9%)7 (4.3%) HSC or equivalent (Year 12)14 (13.7%)12 (19.7%)26 (16.0%) College/TAFE/Diploma28 (27.5%)14 (23.0%)42 (25.8%) University25 (24.5%)19 (31.1%)44 (27.0%) Postgraduate31 (30.4%)13 (21.3%)44 (27.0%) ^*****^ SEIFA Quintiles - IRSD
0.35 1 - Most disadvantaged14 (13.7%)10 (16.4%)24 (14.7%) 219 (18.6%)9 (14.8%)28 (17.2%) 322 (21.6%)15 (24.6%)37 (22.7%) 423 (22.5%)7 (11.5%)30 (18.4%) 5 - Least disadvantaged24 (23.5%)20 (32.8%)44 (27.0%) ^†^ Remoteness
0.27 Major city81 (79.4%)42 (68.9%)123 (75.5%) Inner regional16 (15.7%)13 (21.3%)29 (17.8%) Outer regional5 (4.9%)6 (9.8%)11 (6.7%) Private health insurance
0.99 Yes62 (60.8%)37 (60.7%)99 (60.7%) No40 (39.2%)24 (39.3%)64 (39.3%) Other reported clinical conditions Bone fractures9 (8.8%)12 (19.7%)21 (12.9%) 0.079 Dental problems18 (17.6%)16 (26.2%)34 (20.9%) 0.27 Diabetes2 (2.0%)1 (1.6%)3 (1.8%) 0.99 ^ ¶^Heart problems5 (4.9%)5 (8.2%)10 (6.1%) 0.61 Kidney3 (2.9%)1 (1.6%)4 (2.5%) 0.99 Psoriasis7 (6.9%)11 (18.0%)18 (11.0%) 0.052 Uveitis34 (33.3%)6 (9.8%)40 (24.5%) 0.001 ^*^Socio-economic indices Australia, 2021, quintiles derived from national deciles by participant’s postal area, IRSD - Index of Relative Socio-economic Disadvantage^†^Remoteness measured by Accessibility/ Remoteness Index of Australia Plus (ARIA+) based on participant’s postal area^¶^Pericarditis, myocarditis, endocarditis, ventricular dysfunction^**^P values are chi-squared tests for proportions and t-tests for continuous variables
The average CHU9D score was lower for children diagnosed at 6 + months, 0.44 (SD 0.29), compared to those diagnosed < 6 months, 0.59 (SD 0.29); p = 0.003 (Table 2). Within the nine dimensions that comprise the CHU9D, children in the < 6 months diagnosis group reported higher scores in the dimensions of pain, tiredness, sleep, daily routine, and activities than those in the delayed diagnosis group (p < 0.05) (Table 2).
Table 2. Child Health Utility 9D Instrument (CHU9D) Dimension Scores by time to diagnosis groupsChild Health Utility Instrument (CHU9D)Dimension ScoresUtility Value(Range: 1 = Perfect health, 0 = Dead)Time to diagnosis in monthst-TestP value< 6N = 1026 + N = 61Mean (SD) Overall* 0.59 (± 0.29)0.44 (± 0.29)0.003 HRQoL dimensions Worry (Range 0.11 to 0.22)0.17 (± 0.05)0.15 (± 0.05)0.11 Sadness (Range 0.02 to 0.15)0.10 (± 0.05)0.09 (± 0.05)0.07 Pain* (Range − 0.02 to 0.11)0.05 (± 0.04)0.02 (± 0.04)0.001 Tiredness* (Range 0.03 to 0.11)0.07 (± 0.02)0.06 (± 0.02)0.001 Annoyance (Range − 0.04 to 0.08)0.04 (± 0.04)0.03 (± 0.04)0.09 School (Range − 0.02 to 0.09)0.05 (± 0.04)0.04 (± 0.04)0.07 Sleep* (Range − 0.05 to 0.06)0.03 (± 0.03)0.02 (± 0.03)0.03 Daily routine* (Range − 0.05 to 0.07)0.02 (± 0.05)-0.00 (± 0.05)0.008 Activities* (Range 0.02 to 0.13)0.11 (± 0.02)0.10 (± 0.03)0.007*Statistically significant at p = 0.05
Compared with 6 + months, a time to diagnosis < 6 months was associated with a clinically and statistically significant increase in HRQoL utility value of 0.14 (95%CI 0.05, 0.23) per child (Table 3). Results were also comparable after adjusting for potential confounding and interaction by age, sex and time from diagnosis to survey completion, 0.14 (95%CI 0.04, 0.23) (Table 3).
Table 3. Model estimates for Health-related Quality of Life (HRQoL) measured by Child Health Utility 9D Instrument (CHU9D) Utility Value by time to diagnosis groupChild Health Utility Instrument (CHU9D)Utility Value(Range: 1 = Perfect health, 0 = Dead)Time to diagnosis in monthsDifferenceWald TestP value< 6 N = 1026 + N = 61Mean (95% CI)Unadjusted0.59 (0.53, 0.64)0.44 (0.39, 0.52)⇑0.14(0.05, 0.23)0.003Adjusted^^0.58 (0.50, 0.67)0.45 (0.35, 0.55)⇑0.14(0.04, 0.23)0.004Adjusted by age, gender, and age-gender interaction. There was no evidence that time from diagnosis to the survey (Wald Test P value = 0.193), or an interaction between diagnosis group and time from diagnosis to the survey (Likelihood Ratio Test P value = 0.112), improved model fit
The average annual government healthcare costs for children diagnosed at <6months was 6,416) and lower than the average annual cost of 37,034) for children diagnosed 6 + months (p = 0.012) (Table 4). Large cost savings were observed for the < 6 months group in overall hospitalizations, and those specifically for surgeries, pain, inflammation, and investigative procedures (Table 4). Smaller, but significant cost savings were also found in fewer visits to primary care physicians and allied health professionals (Table 4).
Table 4. Annual government healthcare costs (medical investigations, health professional visits, hospitalizations, and medications) related to JIA in Australian dollars ()Time to diagnosis in monthst-TestP value< 6N = 1026 + N = 61Mean (SD) Total costs 18,765 (± 16,**416)**29,494 (± 37,034) 0.012
Cost components
Medical investigations ^*^ X-rays, blood tests, MRI, Ultrasound, CT scans, nuclear medicine, eye examinations1,694 (± 621)1,753 (± 824)0.60 Subtotal 1,***694 (± 621)***1,753 (± 824) 0.60
Health professional visits ^^ Primary care physician^†^459 (± 230)575 (± 295)0.005 Clinical specialists^*^984 (± 1132)1,080 (± 863)0.57 Rheumatology Nurse464 (± 791)421 (± 1007)0.76 Allied health professionals1,153 (± 1649)1,831 (± 2203)0.03 Subtotal 2,596 (± 2,***754)***3,487 (± 2,976) 0.05
Hospitalizations Bone fracture-480 (± 3751)- Infection/virus811 (± 4,262)2,612 (± 10,164)0.12 Injections/infusions4,750 (± 8,358)5,657 (± 9,543)0.53 Mental health398 (± 4,015)-- Pain/inflammation/investigative1,510 (± 4,524)7,299 (± 26,726)0.03 Surgery28 (± 288)281 (± 1,071)0.03 Subtotal 7,498 (± 12,***152)***16,329 (± 31,275) 0.01
Medications ^******^ ^ §^csDMARDS397 (± 242)430 (± 315)0.46^ ¶^bDMARDS5,489 (± 6033)6,080 (± 6,980)0.57^ ∥^tsDMARDS943 (± 4,176)1,262 (± 4,804)0.66^ #^Corticosteriod ORAL148 (± 189)153 (± 191)0.89 Subtotal 6,978 (± 7,***446)7,925 (± 9,549) 0.48 ^^Applies the Medicare Safety Net as indicated by the participant†Assumes participants visiting allied health completed a chronic disease care plan with primary physician‡Assumes chronic disease plan rebates are claimed§Assumes dosages: Methotrexate Oral and Subcutaneously 15 mg per week (60% participants oral, 40% injections), Hydroxychloroquine 200 mg daily, Suflasalazine 1000 mg daily, Leflunomide 20 mg daily¶Assumes dosages: Adalimumab 40 mg/0.8mL injection every 2 weeks, etanercept 50 mg/mL injection weekly, Infliximab 120 mg/mL injection monthly, Tocilizumab 162 mg/0.9 mL injection weekly, Abatacept 125 mg/mL injection weekly, Secukinumab 150 mg/mL injection weekly∥Assumes dosages: Tofacitinib 5 mg twice daily, Upadacitinib 15 mg daily, Baricitinib 4 mg daily#Assumes dosages: Prednisone 25 mg dailyExcludes all other medications than DMARDS or ORAL corticosteriods. Note injections and infusions of corticosteriods are assumed to be included in hospitalisation costs
Overall, this represented significant annual savings in healthcare costs for the < 6 months versus 6 + months group of 2,393, $19,065); p = 0.01 (Table 5).
Table 5. Model estimates for annual government healthcare costs (medical tests, health professional, hospital, and medications) related to JIA in Australian dollars ()Time to diagnosis in monthsDifferenceWald TestP value< 6 N = 1026 + N = 61Mean (95% CI)Unadjusted^^18,765(13,665, 23,864)29,494(22,899, 36,088)⇓-10,729(-2,393, -19,065)0.012^^Adjusted estimates are not shown as there was no evidence of a difference in annual government healthcare costs by age (Wald Test, P value = 0.536), gender (Wald Test P value = 0.899), or age-gender interaction (Likelihood Ratio Test P value = 0.103). In addition, there was no evidence that adding time to diagnosis (Wald Test P value = 0.651), or an interaction term between diagnosis group and time from diagnosis to the survey (Likelihood Ratio Test P value = 0.289), improved model fit
Over a lifetime horizon, the present value of healthcare savings from diagnosis within six months was 45,388, 50K per QALY [25], the net benefit to the Australian government (health funder) of diagnosis within the 6-month window was 139,630, 231,470 (95%CI 370,471) [31])(Table 6).
Table 6. Lifetime change in government healthcare costs, Quality Adjusted Life Years and Net Benefit in Australian and US Dollars (208,458 (95%CI 371,528); p = 0.01Quality Adjusted Life Years (QALYs)⇑2.82 (95%CI 1.03, 4.61);p = 0.002Net Benefit @ 349,520 (95%CI 559,411);p = 0.001Net Benefit @ 231,470 (95%CI 370,471);p = 0.001AUD = Australian Dollars, USD = US DollarsAnnual healthcare use, including medical investigations, health professional visits, hospitalizations and medications, was determined using data from participants completing The IMPACT Survey [18]. Costs were estimated by applying Australian government subsidy item costs (medications) [21], schedule fees (medical services) [22], and National Efficient Prices (hospital stays) [23]. Each participant’s Quality Adjusted Life Years (QALYs) were estimated using their life expectancy [21] multiplied by their CHU9D utility value. Costs and QALYs were present valued over a lifetime horizon using a 5% per annum discount rate [24]. 2023 AUD/USD Exchange rate 1.51 [31]
Fig. 1. Cost effectiveness plane: Incremental healthcare costs in Australian dollars (AUD) per quality adjusted life years saved from JIA diagnosis within six months of actively seeking treatment
One-way sensitivity analysis showed that the net benefit was most sensitive to the assumed time value of money, with the net benefit reduced to 537K at a 3% discount rate (Fig. 2). Removing potential short-term treatment effects by reperforming the analysis excluding the 17 participants who completed the survey within one year of diagnosis, resulted in a negligible reduction in the net benefit of $5K (1.4%)(Fig. 2).
Fig. 2. One-way sensitivity analysis forestplot
The net benefit in dollars per child with JIA can be used to set the cost threshold per child for an intervention to be cost-effective, value the benefits of alternate interventions, or estimate the total budget for interventions using the benefits forgone of not improving time to diagnosis. For example, in Australia, based on the estimated 5.1 million [32] resident children under 16 years as at 30 June 2023, and using a very conservative annual incidence based on children with a first admission to public hospitals of 7 per 100,000 [33] (358 children), and 37% of children receiving a diagnosis 6 + months from actively seeking treatment, the total benefits forgone of delayed diagnosis to healthcare funders for those 134 children would be 19, $75) million.
Discussion
The IMPACT Survey [18] confirmed little has changed in Australia in terms of time to diagnosis from 2014 to 2023 (6 + month waiting time: 41% of children in 2014 [1] versus 37% in 2023 [18]). Compared to children diagnosed within 6 months of actively seeking treatment, children waiting 6 + months for diagnosis reported lower health-related quality of life, with deficits in the dimensions of pain, tiredness, sleep, daily routine and activities. The difference did not diminish over the years from diagnosis (participant data reached 20 years post diagnosis), supporting the hypothesis of a window of opportunity for early aggressive treatment with disease-modifying drugs to limit long-term joint damage and disability [6–9]. Children in the delayed diagnosis group also reported a higher usage of health services, resulting in an average increase in costs for the healthcare funder of more than $10,000 per child. The majority of this cost increase was from hospitalizations for pain, inflammation, and investigative procedures. This and the fact that the higher health service use did not diminish in the years following diagnosis (participant data reached 20 years post diagnosis) again supports the hypothesis of a window of opportunity for early aggressive treatment.
As the HRQoL and healthcare cost differences from time to diagnosis are likely to persist over a lifetime, the present value of Quality Adjusted Life Years (QALY) saved, 2.8 (95%CI 1.0, 4.6), and healthcare cost savings, 45,388, 50K per QALY saved, the net benefit to the healthcare funder is estimated at 140K, 350K intervention to improve just one child’s time to diagnosis within six months would likely be cost-effective for the healthcare funder. Since there is a significant annual incidence of JIA, and 37 out of each 100 children and adolescents with incident JIA are impacted by a delayed diagnosis in Australia, an intervention to improve times to diagnosis has the potential to have a sizeable budget impact based on the number of children assisted.
To our knowledge, this is the first study to quantify the health economic impact of delayed diagnosis of JIA. Studies of autism have shown similar health benefits and healthcare cost savings with early diagnosis. The early identification of autism allows for timely interventions that significantly improve developmental outcomes, which can reduce the cost of special education services in childhood [34], and reduce dependency in adulthood [35].
There are a number of opportunities to reduce the time to diagnosis. In 2014, Arthritis Australia concluded that inadequate public and health practitioner awareness of the condition and limited access to specialists for diagnosis and care appear to be key factors leading to these delays [1], and these factors persist today, with the longest delay from the first healthcare professional visit to PR referral [16]. Knowledge of JIA amongst primary health physicians, pediatricians and other specialists is an issue internationally [36]. In Europe and North America, several organizations are devoting considerable efforts to increasing knowledge of JIA among primary healthcare providers [36], while in Australia, a nationwide communication strategy to promote early diagnosis of JIA has been rolled out by the consumer group Juvenile Arthritis Foundation Australia, through professional organisations and Primary Health Networks, highlighting early symptoms of JIA [37].
The waiting time from referral to appointment with a PR may also impact time to diagnosis. Paediatric rheumatology services in Australia and New Zealand fall well behind accepted international benchmarks, with a significant shortfall in the number of PRs [38]. There is excessive reliance on services provided in private practice, and the shortage of publicly funded PRs is a major barrier to providing timely and accessible care for children, particularly those living in regional and rural areas [39]. It is interesting to note that the hiring of an additional public PR would cost the healthcare funder less than $350K and would likely assist more than one additional child to diagnosis within six months, making it a cost-effective intervention.
The strengths of this study include the design of survey questions with input from patients, families, and clinicians, the use of child-specific, validated HRQoL instruments with population-appropriate utility value sets, the collection of detailed healthcare usage data, and the use of robust and consistent standard government unit prices for cost estimates.
Study limitations include the usual cross-sectional survey biases, such as selection bias and confounding. However, the age, gender, and socio-economic groups represented in the study were representative of the JIA population, and thorough testing and adjustment for potential confounders were performed. Recall bias for time to diagnosis and healthcare usage is another limitation. However, our findings regarding the months of delay in diagnosis and overall healthcare costs align with international literature. The assumption of a constant difference in HRQoL and health system costs between diagnosis groups over a lifetime horizon is a limitation. However, it is a conservative assumption, given longitudinal studies suggest that HRQoL differences and health system costs are likely persist or worsen over time [10–12, 40, 41]. In addition, removing potential short-term treatment effects by reperforming the analysis excluding the 17 participants who completed the survey within one year of diagnosis, resulted in a negligible reduction in the net benefit of $5K (1.4%).
Policy implications
In the era of disease-modifying medications that, with early aggressive treatment, can prevent long-term joint damage and disability in children with JIA, international estimates that 50% of children with JIA are waiting six months or more from symptom onset for diagnosis and treatment [14] represents a significant cost in terms of health economic benefits forgone. This article provides health funders and policymakers with relevant estimates of the delay in diagnosis in terms of HRQoL, QALYs, and health system costs. An intervention to improve the time to diagnosis of JIA within six months is expected to have a present value of 231K) per child with JIA in terms of QALYs saved and health system costs at a generally accepted willingness to pay for one QALY of $50K. In the context of a significant annual incidence of JIA [3, 4], and 50 out of 100 children with incident JIA waiting six months or more for diagnosis [14], an intervention to improve time to diagnosis has the potential to have a sizeable budget impact based on the number of children assisted. Not only are the health economic benefits sizeable, but the improvement in HRQoL for people living with JIA is beneficial.
Conclusion
Interventions to improve the time to diagnosis of JIA within six months of seeking help are likely cost-effective and can significantly improve HRQoL for people living with JIA.
Supplementary Information
Below is the link to the electronic supplementary material.
Supplementary Material 1: Additional file 1, DOC (Microsoft Word), Economic Analysis Plan, Details of the pre-defined Economic Analysis Plan
Supplementary Material 2: Additional file 2, DOC (Microsoft Word), CHEERS Checklist, Completed CHEERS Checklist for the study
The reference list from the paper itself. Each links out to its DOI / PubMed record.
- 1Arthritis Australia. Time to Move: Juvenile Idiopathic Arthritis, A national strategy to reduce a costly burden. Pdf. Accessed 14. February, 2024. https://arthritisaustralia.com.au/wordpress/wp-content/uploads/2017/09/Final_Time_to_Move__JIA.pdf
- 2Haynes A, Bulsara MK, Bergman P, et al. Incidence of type 1 diabetes in 0 to 14 year olds in Australia, 2002 to 2017. Pediatr Diabetes. 2020;21(5):707–712. 10.1111/pedi.13025.10.1111/pedi.1302532304132 · doi ↗ · pubmed ↗
- 3Bond D, Von Huben A, Lain S, Colagiuri R, Nassar N. The IMPACT study: Investigating the Mental, Physical, Social and Financial Cos Ts (IMPACT) of Juvenile Idiopathic Arthritis and Related Childhood Rheumatic Diseases. Pdf. Accessed 17 July, 2025. https://www.jafa.org.au/impact-study-landmark-results-out-now/.
- 4Australian Bureau of Statistics. Table 1.9, life tables, life expectancy. Microsoft Excel Worksheet. ABS. Accessed 27. February, 2024. https://www.abs.gov.au/statistics/people/population/life-expectancy/2020-2022.
- 5Australian Government Department of Health and Aged Care. Medicare Benefits Schedule Book, 1 November 2022. Pdf. Accessed 12. September, 2023. https://www.mbsonline.gov.au/internet/mbsonline/publishing.nsf/Content/148049 BCC 6D 57ED 4CA 25889 F 00110 A 8A/$File/1%20November%202022%20MBS%20Book.pdf.
- 6Independent Hospital and Aged Care Pricing Authority. NWAU calculator for acute activity 2022-23. Microsoft Excel Binary Worksheet. Accessed 3. June, 2024. https://www.ihacpa.gov.au/health-care/pricing/nwau-calculators.
- 7NSW Treasury. NSW government guide to cost-benefit analysis, PDF. September. Accessed 9 2025. https://www.nsw.gov.au/departments-and-agencies/nsw-treasury/documents-library/tpg 23-08.
- 8R Core Team. R: a language and environment for statistical computing. R Foundation for Statistical Computing. https://www.R-project.org/.