New Neuroimaging Findings in Enoyl-CoA Hydratase Short-Chain 1 (ECHS1) Deficiency
Hiroko Tada, Keiko Ichimoto, Kei Murayama, Tomohide Goto, Jun-ichi Takanashi

TL;DR
This paper reports new neuroimaging findings in a patient with ECHS1 deficiency, highlighting cerebellar involvement not previously observed in most cases.
Contribution
The study identifies cerebellar lesions as a novel imaging feature of ECHS1 deficiency.
Findings
Diffusion-weighted imaging showed reduced diffusion in the cortex and white matter.
Cerebellar hyperperfusion and increased lactate were observed via MR spectroscopy.
Cerebellar lesions were linked to a specific ECHS1 variant.
Abstract
Enoyl-CoA hydratase short-chain 1 (ECHS1) variants are among the most common causes of Leigh syndrome. A five-year-old boy with ECHS1 deficiency initially presented with acute encephalopathy during the neonatal period. The patient had a high serum lactate level and a normal lactate/pyruvate ratio. Diffusion-weighted imaging showed reduced diffusion in the peri-rolandic subcortical white matter on day 3 and in the entire cortex and subcortical white matter on day 7. The patient subsequently presented with poor feeding, hypotonia, nystagmus, cerebellar ataxia, hearing loss, and strabismus. At one year of age, neuroimaging revealed reduced diffusion, hyperperfusion on arterial spin labeling, and increased lactate on magnetic resonance (MR) spectroscopy in the cerebellum. Cerebellar lesions have not previously been reported as imaging findings of ECHS1 deficiency except in one previous…
Genes, proteins, chemicals, diseases, species, mutations and cell lines named across the full text — each resolved to its canonical identifier and authoritative record.
Click any figure to enlarge with its caption.
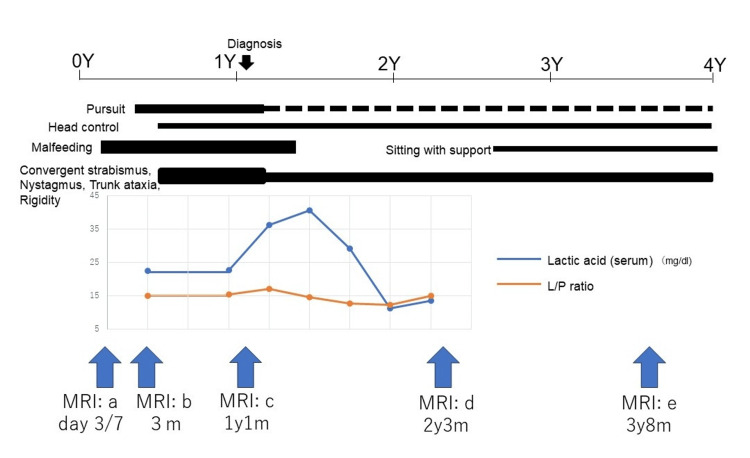 Figure 1
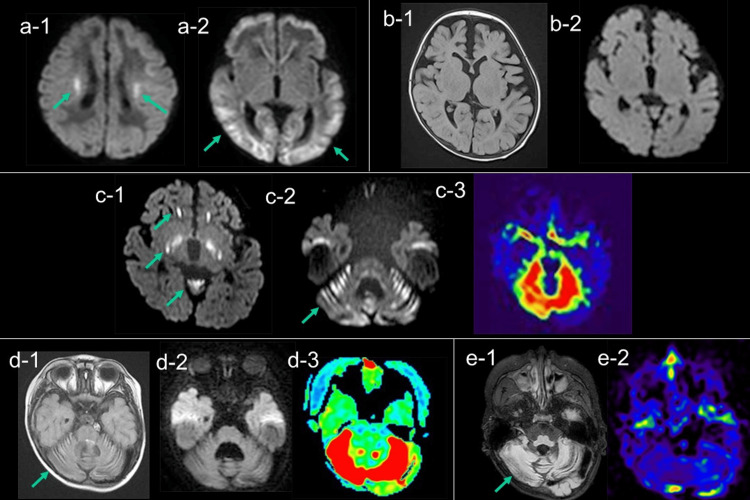 Figure 2
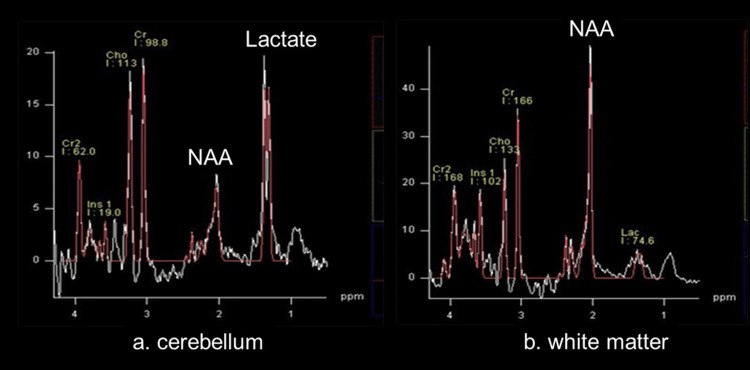 Figure 3
Peer Reviews
No public reviews on file for this paper yet. If you reviewed it on a platform where reviews are public (OpenReview, ICLR, NeurIPS, ICML), you can paste yours below so the community can read it here.
Videos
No videos yet. Explain this paper in a talk, walkthrough, or lecture? Add one.
Taxonomy
TopicsMetabolism and Genetic Disorders · Glycosylation and Glycoproteins Research · Diet and metabolism studies
Introduction
The enoyl-CoA hydratase short-chain 1 (ECHS1) gene is crucial for the metabolism of the essential amino acid valine. Defects in this gene cause the accumulation of toxic substances and disturbances in energy production; they can also cause Leigh syndrome (MIM #256000) [1]. Clinically, patients with ECHS1 deficiency exhibit variable combinations of developmental delay, hypotonia, ataxia, and episodes of acute encephalopathy. Neuroimaging typically reveals lesions in the basal ganglia and brainstem; however, cerebellar involvement is considered extremely uncommon [2-4].
Herein, we report a case of ECHS1 deficiency in a patient whose neuroimaging findings changed over time and included cerebellar lesions at approximately one year of age.
Case presentation
The patient is now a five-year-old Japanese boy, who was born to healthy parents. He was born at 39 weeks of gestation via normal delivery and weighed 2,546 g. On day 3 after birth, the patient was admitted with acute encephalopathy due to persistent convulsions and impaired consciousness. Blood tests performed on admission showed slightly elevated serum lactate (27.9 mg/dL; reference range: 4.0-19.2) and pyruvate (2.02 mg/dL; reference range: 0.3-0.9) levels with a normal lactate/pyruvate (L/P) ratio of 13.8 (reference range: 10-20). No abnormalities were detected in the newborn screening tests. The automatic auditory brainstem response test suggested left-sided hearing loss. The patient was intubated during days 3-7 after birth, improved slowly, and was discharged on day 21 (Figure 1).
The longitudinal course of the clinical symptoms, changes in serum lactate and the L/P ratio, and timing of magnetic resonance studiesLactate levels were highest at one year and one month (40 mg/dL), and the L/P ratios were all within normal limits (<20).MRI: magnetic resonance imaging; L/P ratio: lactate/pyruvate ratio
Diffusion-weighted imaging (DWI) on day 3 revealed hyperintensity in the peri-rolandic subcortical white matter (Figure 2, a-1), which spread to the entire cortex, subcortical white matter, and corpus callosum on day 7 (Figure 2, a-2). The lesions disappeared on day 21. Despite extensive serum and cerebrospinal fluid (CSF) workup, the underlying cause of the acute encephalopathy remained uncertain. He was able to control his head at three months of age and roll over at six months. He slowly exhibited ataxia of the trunk, rigidity of the limbs, nystagmus, and strabismus (Figure 1). Magnetic resonance imaging (MRI) at three months revealed mild cerebral atrophy without obvious parenchymal signal abnormalities (Figure 2, b-1 and b-2).
Temporal changes in MRI(a) DWI showed reduced diffusion in the peri-rolandic subcortical white matter (a-1: arrow) on day 3, followed by that in the subcortical white matter on day 7 (a-2: arrow). (b) FLAIR (b-1) and DWI (b-2) at three months revealed mild cerebral atrophy without obvious parenchymal signal abnormalities. (c) At one year and one month, DWI showed reduced diffusion in the globus pallidus, substantia nigra, anterior periventricular white matter, and cerebellar cortex (c-1 and c-2: arrow). ASL showed hyperperfusion in the cerebellum (c-3). (d) At two years and two months, FLAIR showed high signal intensity in the atrophic cerebellar cortex (d-1: arrow). DWI showed no diffusion abnormalities (d-2); however, ASL still showed hyperperfusion in the cerebellum (d-3). (e) At three years and eight months, FLAIR showed progressive cerebellar atrophy (e-1: arrow) with hypoperfusion on ASL (e-2).MRI: magnetic resonance imaging; DWI: diffusion-weighted imaging; FLAIR: fluid-attenuated inversion recovery; ASL: arterial spin labeling
Laboratory test results at 11 months showed high lactate and pyruvate concentrations in the blood and CSF, with a normal L/P ratio, and elevated 2-methyl-2,3-dihydroxybutyric acid levels in the urine (Figure 1). This led to a suspected diagnosis of ECHS1 deficiency. The diagnosis was confirmed by whole-exome analysis, which revealed a compound heterozygous variant of ECHS1 (c.176 A>G/c.23 T>C) at one year and three months of age. T2 hyperintensity and high signal intensity on DWI were observed in the globus pallidus, substantia nigra, and white matter around the anterior horn of the lateral ventricle at one year and one month of age (Figure 2, c-1). Additionally, T2-weighted imaging (T2WI) and DWI revealed a high signal intensity lesion in the cerebellum (Figure 2, c-2), with hyperperfusion on arterial spin labeling (ASL) (3D-ASL; TR/TE=8000/11 ms; post-labeling delay (PLD)=1500 ms) (Figure 2, c-3) and markedly elevated lactate levels on magnetic resonance (MR) spectroscopy (TR/TE 5000/30 msec, quantitatively analyzed using LCModel) (Figure 3).
Magnetic resonance spectroscopy at one year and one monthIn the cerebellum (a), a marked decrease in NAA levels was observed with a prominent lactate peak. In the white matter (b), magnetic resonance spectroscopy showed reduced NAA without obvious lactate.NAA: N-acetylaspartate
After making a definite diagnosis of ECHS1 deficiency at one year and three months of age, a low-protein and valine-restricted diet (plasma valine concentrations under 85 µmol/L) and vitamin cocktail therapy (biotin, vitamins B, C, and E, and coenzyme Q10) were initiated under the guidance of a metabolic specialist. The patient's clinical condition and lactate and pyruvate levels were monitored every one to three months.
After initiating dietary and vitamin therapy, no further neurological deterioration was observed. Motor function stabilized, and the patient achieved new developmental milestones, such as sitting and standing with support, at five years of age (Figure 1).
At two years and two months, MRI showed cerebellar atrophy and high signal intensity in the cerebellar cortex on fluid-attenuated inversion recovery (Figure 2, d-1) with normal signal on DWI (Figure 2, d-2); however, ASL still showed cerebellar hyperperfusion (Figure 2, d-3). At three years and eight months, MRI revealed progressive cerebellar atrophy with ASL hypoperfusion (Figure 2, e-1 and e-2).
Discussion
The most important aspects of this case were the previously unreported DWI findings during the neonatal period and cerebellar lesions at one year of age.
The patient presented with hyperlactatemia with a normal L/P ratio during the neonatal period, wherein DWI showed reduced diffusion that spread over time from the peri-rolandic subcortical white matter (day 3) to the entire cortical and subcortical lesions (day 7). The mechanism by which ECHS1 deficiency causes hyperlactatemia with a normal L/P ratio is thought to be because methacryl-CoA and acryl-CoA accumulate due to ECHS1 deficiency, resulting in the dysfunction of the electron transport chain and pyruvate dehydrogenase complex (PDHC) activity, the latter of which consequently leads to hyperlactatemia with a normal L/P ratio, similar to that observed with PDHC deficiency [5]. Neuroimaging of patients with ECHS1 deficiency during the neonatal period [6-9] revealed cortical dysplasia, periventricular pseudocysts, hypoplasia of the corpus callosum, and abnormalities of the basal ganglia, in addition to diffuse white matter abnormalities. These imaging findings are similar to those observed in neonatal PDHC deficiency [10], suggesting that neonatal ECHS1 deficiency, similar to neonatal PDHC deficiency, develops in utero. In contrast, in our case, no evidence of brain dysplasia was observed; the migration of lesions with reduced diffusion suggested a postnatal onset. In neonatal patients with hyperlactatemia, with a normal L/P ratio and reduced diffusion in the subcortical white matter, ECHS1 should be considered; this might facilitate early diagnosis and treatment [8].
Masnada et al. [7] reported 19 cases of ECHS1 deficiency, of which seven cases developed from late infancy until two years, named the slowly progressive infantile form, and showed MRI lesions in the periventricular white matter and basal ganglia [9,10]. The MRI findings at the age of one year and one month in this case were consistent with those of the slowly progressive infantile form showing white matter and basal ganglia lesions. However, cerebellar lesions have never been reported except for in this case and another one with the same ECHS1 variants (c.176A>G/c.23T>C) [11]. MR spectroscopy at one year and one month of age showed a marked lactate peak in the cerebellum, which was not observed in the white matter or basal ganglia, suggesting that mitochondrial dysfunction in the cerebellum was particularly severe. It is reasonable to assume that the hyperperfusion in the cerebellum observed on ASL might have compensated for energy depletion resulting from mitochondrial dysfunction. The reason why ECHS1 with the variants caused a more vulnerable impact on cerebellar neurons than basal ganglia or white matter remains unclear. Further studies are needed to confirm whether cerebellar lesions are specific to this mutation.
Conclusions
We report a case of ECHS1 deficiency in a boy whose neuroimaging findings changed over time. This case presents new neuroimaging findings of ECHS1 deficiency, including early cortical-subcortical diffusion restriction and subsequent cerebellar involvement. These findings might serve as diagnostic clues; however, they should be interpreted with caution until further confirmed in additional cases.
The reference list from the paper itself. Each links out to its DOI / PubMed record.
- 1ECHS 1 mutations in Leigh disease: a new inborn error of metabolism affecting valine metabolism Brain Peters H Buck N Wanders R 2903290813720142512561110.1093/brain/awu 216 · doi ↗ · pubmed ↗
- 2Valine-restricted diet for patients with ECHS 1 deficiency: divergent clinical outcomes in two Japanese siblings Brain Dev Sato-Shirai I Ogawa E Arisaka A 3083134320213313912510.1016/j.braindev.2020.10.003 · doi ↗ · pubmed ↗
- 3Mitochondrial short-chain enoyl-Co A hydratase 1 deficiency Gene Reviews® [Internet] Ganetzky R Stojinski C Seattle (WA)University of Washington, Seattle 2019 https://www.ncbi.nlm.nih.gov/books/NBK 542806/31219693 · pubmed ↗
- 4Increased ketone levels as a key magnetic resonance spectroscopic findings during acute exacerbation in ECHS 1-related Leigh syndrome Radiol Case Rep Murofushi Y Ochiai K Yasukochi M 629262961920243938703810.1016/j.radcr.2024.08.164PMC 11461927 · doi ↗ · pubmed ↗
- 5ECHS 1 disorder and HIBCH disorder as abnormalities of valine metabolism Mitochondria and Diseases, Genetic Medicine 35 Ogawa E 8690 Osaka, Japan Medicaldo 2020
- 6ECHS 1 deficiency as a cause of severe neonatal lactic acidosis JIMD Rep Ganetzky RD Bloom K Ahrens-Nicklas R Edmondson A Deardorff MA Bennett MJ Ficicioglu C 33373020162692090510.1007/8904_2016_538PMC 5110442 · doi ↗ · pubmed ↗
- 7Phenotypic spectrum of short-chain enoyl-Coa hydratase-1 (ECHS 1) deficiency Eur J Paediatr Neurol Masnada S Parazzini C Bini P 1511582820203280068610.1016/j.ejpn.2020.07.007 · doi ↗ · pubmed ↗
- 8Pathogenic biallelic mutations in ECHS 1 in a case with short-chain enoyl-Co A hydratase (SCEH) deficiency-case report and literature review Int J Environ Res Public Health Muntean C Tripon F BoglișA Bănescu C 20881920223520627610.3390/ijerph 19042088 PMC 8871535 · doi ↗ · pubmed ↗